


1. Introduction
In the current situation where competition in the financial industry is increasingly fierce, the digital transformation of the banking industry is accelerating. The customer relationship management platform integrates customer information, gains insights into behaviors, grasps demands, and has a score of over 80%, receiving high recognition from banks and being applied in the marketing digital transformation strategy and practice [1]. This research can help banks accurately position customers, meet the needs of improving marketing efficiency and effectiveness, and make the precision of marketing strategies and the predictive ability of customer demands the core of competition. It can help banks gain an in-depth understanding of customer demands, optimize resource allocation, enhance marketing effects, and thereby enhance market competitiveness. This research aims to deeply explore bank marketing prediction based on CatBoost, systematically sort out relevant research results, provide scientific basis and practical guidance for bank marketing decisions, and promote the intelligent development of bank marketing. This research can help banks gain an in-depth understanding of customer demands, optimize resource allocation, enhance marketing effects, and thereby enhance market competitiveness. Analyze the application status, advantages, and challenges of CatBoost in bank marketing prediction, and provide new perspectives and methods for research in related fields.
In recent years, research on bank marketing prediction has mainly focused on the application of traditional machine learning models (such as logistic regression, random forest, etc.) and deep learning (such as LSTM, etc.). In bank data analysis, the use of machine learning models is still in the exploration stage. Most studies focus on the improvement and optimization of individual machine learning models, and less use ensemble learning methods for analysis and prediction. On the other hand, few studies focus on feature extraction and data preprocessing, but have not yet thoroughly explored the issue of imbalanced bank data [2]. This study proposes an integrated modeling framework based on Catboost, utilizing its categorical feature embedding and ordered boosting techniques to efficiently handle high-cardinality categorical variables in bank data. It addresses the limitations of traditional methods in feature engineering and visualizes feature contributions through SHAP values, directly linking customer profiles with marketing strategies to support banks' precise operations.
2. Introduction to relevant models
2.1. KNN (K-Nearest Neighbors)
2.1.1. Fundamental principles
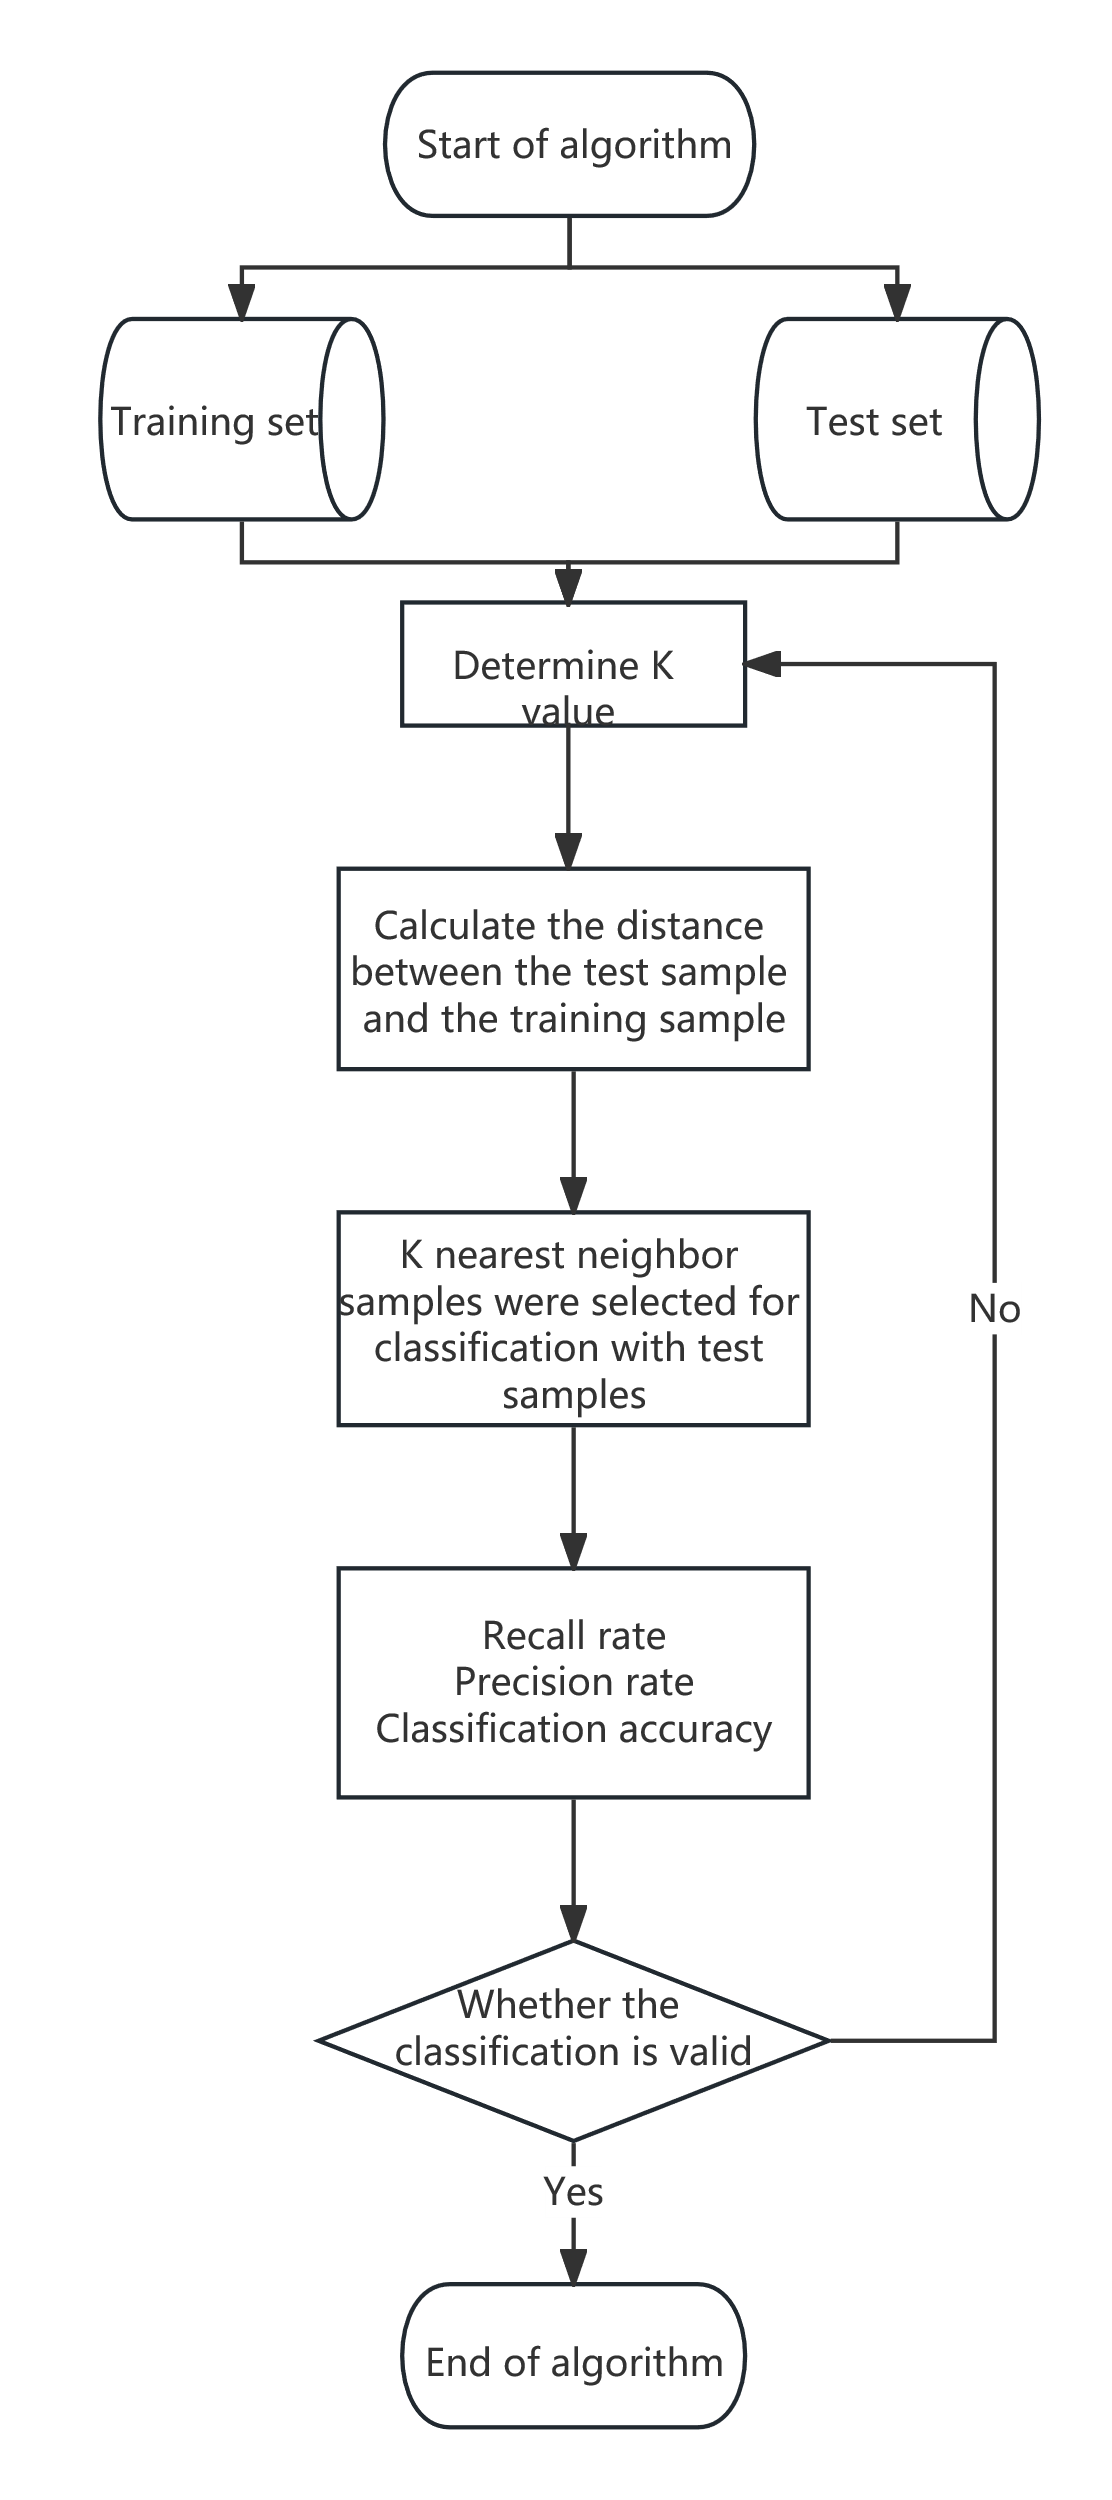
The core idea of the KNN algorithm is to make predictions based on similarity. For an unknown category data point, it identifies the K nearest neighbors (samples from the training data) in the feature space and determines the category or predicted value of the data point based on information from these neighbors.The KNN algorithm primarily relies on a small number of nearby samples rather than determining categories through discriminant class domains. Therefore, it performs better with datasets where class domains intersect or overlap frequently. It is suitable for classifying rich sample domains but may lead to misclassification when used in domains with fewer samples.
2.1.2. Selection of K value
K is a hyperparameter that represents the number of nearest neighbors used for prediction. The size of the K value affects the model's complexity and prediction results. A smaller K value may cause the model to overfit, while a larger K value may reduce the model's generalization ability, making it prone to underfitting. Therefore, the optimal K value is usually selected through methods such as cross-validation (see Figure 1).
2.2. Logistic regression
The core idea of logistic regression is to transform the problem into a probability prediction problem by mapping a linear combination of input features through a non-linear Sigmoid function (also known as the Logistic function) to the (0, 1) interval.Sigmoid function formula is as follows:
Here, z represents the predicted value of a certain linear model. The LR method is used for banking business predictions. Its advantages include low computational load, fast training speed, and the ability to provide probability values for samples, which facilitates customer ranking and targeted services. However, it performs poorly when dealing with multiple features and variables, is prone to underfitting, has low prediction accuracy, and struggles with imbalanced data classification issues [3].The principle of logistic regression is simple and the algorithm is highly efficient, but its predictive performance is significantly influenced by the distribution of sample data. In scenarios involving nonlinear factors and strong correlations between indicators, logistic regression performs poorly.
2.3. Categorical Boosting
2.3.1. CatBoost's innovative technology
CatBoost is a machine learning algorithm based on gradient boosting decision trees. It is an ideal choice for handling mixed data tasks due to its unique categorical feature processing mechanism and ordered boosting technique.By applying gradient boosting techniques on decision trees, CatBoost is specifically designed to handle categorical features and employs more effective strategies to reduce overfitting [4]. Additionally, CatBoost introduces several innovative technologies on top of traditional GBDT: Symmetric Decision Tree Structure: Uses symmetric trees (Oblivious Trees) as base learners, where each level uses the same feature and split point, enhancing training and prediction efficiency.Handling Categorical Features: No need for one-hot encoding or label encoding of categorical features; it directly processes categorical data, avoiding data expansion.Target-Oriented Encoding (Target-Aware Encoding): Dynamically generates encodings for categorical features based on target values, strengthening the relationship between features and target values.Ordered Target Statistics: Utilizes ordered target statistics to handle categorical features, preventing overfitting.Missing Value Handling: Built-in mechanisms for handling missing values allow direct processing of datasets with missing values without pre-processing.
2.3.2. Model advantages
Two significant advantages of the CatBoost algorithm are its ability to effectively handle categorical features without requiring conversion during data preprocessing, and its use of ordered boosting methods to address prediction bias issues in GBDT algorithms while significantly improving computational speed and avoiding overfitting [5]. Additionally, CatBoost demonstrates robustness against missing values and outliers, supports parallel and distributed training, and is compatible with multi-core CPUs and distributed environments, thereby enhancing training speed.
2.4. GBDT (Gradient Boosting Decision Tree)
GBDT (Gradient Boosting Decision Tree) is an ensemble learning algorithm based on boosting methods, widely used for classification and regression tasks [6]. The core idea of GBDT is to iteratively optimize the model. The GBDT algorithm requires M iterations, with each iteration using gradient descent to minimize the cost function by moving in the negative gradient direction, gradually reducing the loss function value and thus obtaining a more accurate model [7]. Specifically, the GBDT model consists of multiple decision trees, each tree attempting to fit the residuals from the previous iteration, thereby gradually approaching the true values and progressively optimizing the model's predictive performance.
2.5. Random Forest
Random Forest is an ensemble learning algorithm based on decision trees that combines decision trees with randomization ideas. It excels in classification, regression, and feature selection and has strong generalization capabilities [8]. Therefore, Random Forest is widely used in classification and regression tasks due to its simplicity, ease of use, and robustness.
2.5.1. Core principles
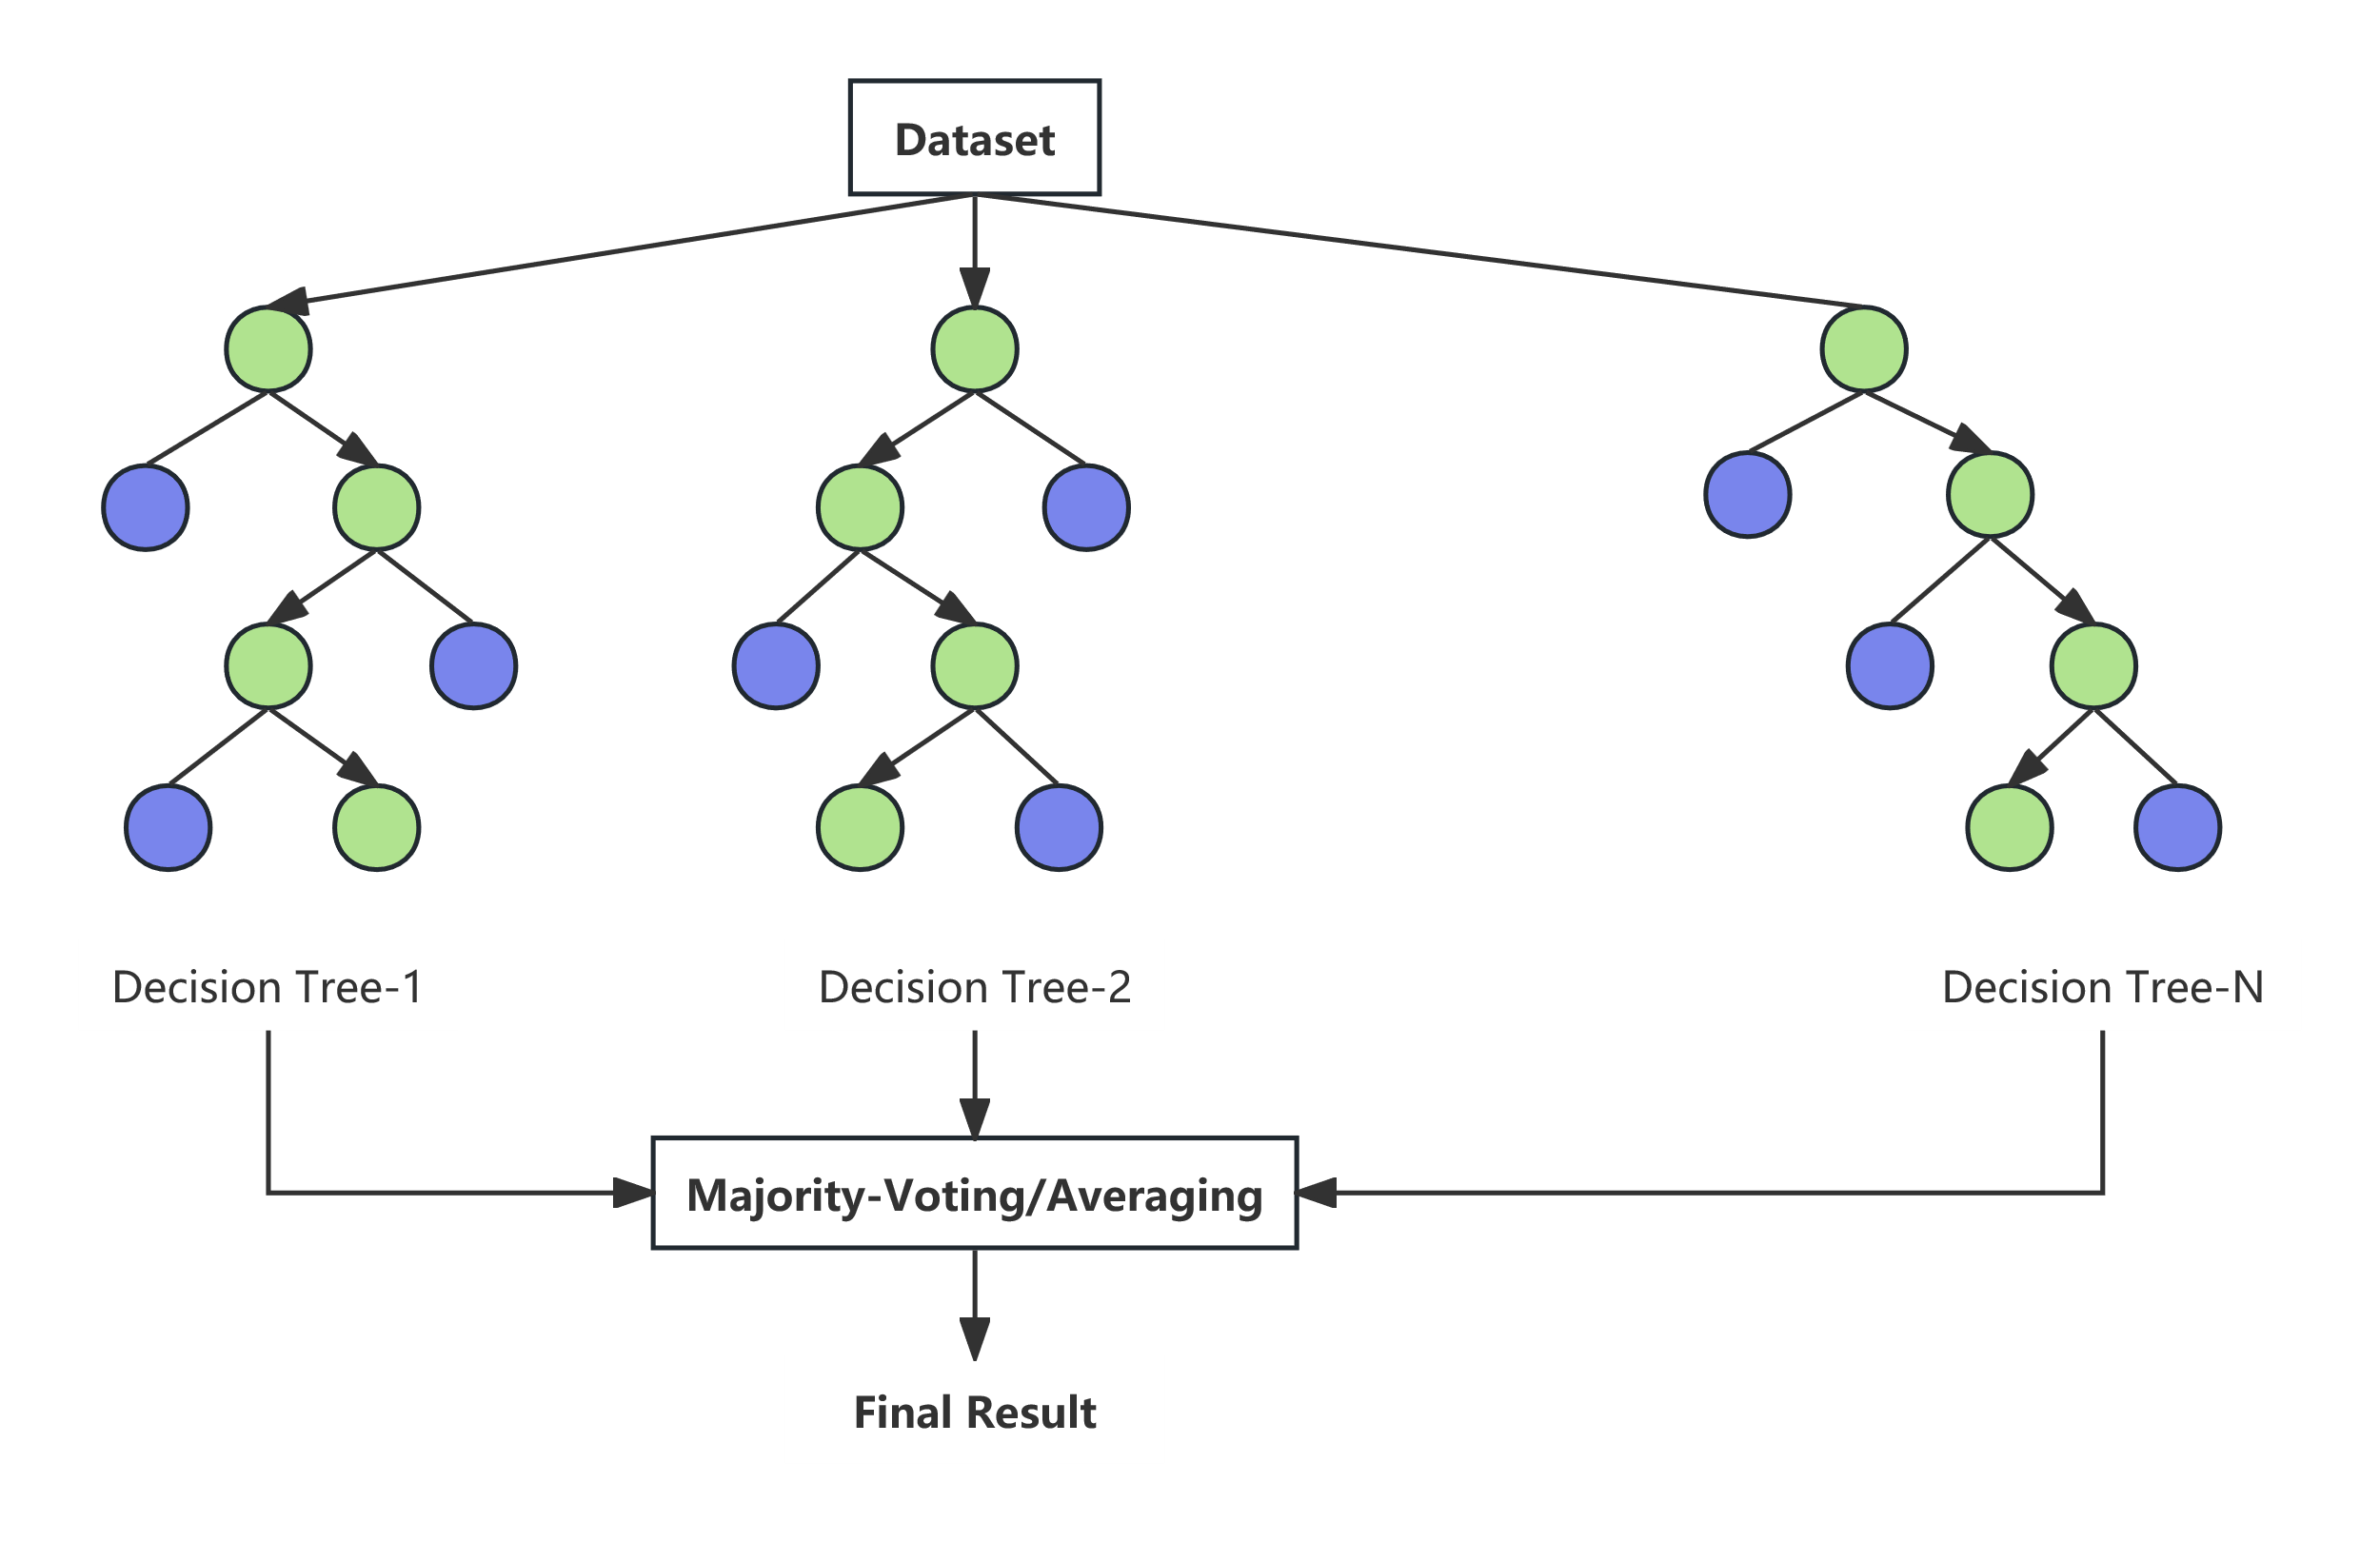
The core idea of random forests is to build multiple decision trees using 'randomness' and then aggregate their results to obtain the final prediction. During the training of each decision tree, random forests perform sampling with replacement from the training data to generate a sub-dataset of the same size as the original dataset. This means that each decision tree uses slightly different data, increasing model diversity. When constructing each split node of the decision tree, random forests only consider a subset of features (typically the square root of the total number of features). This randomness further increases the differences between decision trees, preventing model overfitting. Therefore, the random forest algorithm not only inherits the advantages of CART but also combines all decision trees using the Bagging method, effectively avoiding the overfitting issues caused by individual decision trees [9].
2.5.2. Model training process
The basic steps of the Random Forest algorithm involve using bootstrap sampling to randomly draw multiple subsets of samples from the original dataset and constructing a decision tree for each subset. During each node split of the trees, a random selection of features is chosen as candidate splitting attributes to increase model diversity. Finally, the predictions of all decision trees are combined through voting (for classification tasks) or averaging (for regression tasks), thereby reducing the risk of overfitting of individual trees and enhancing the overall generalization ability of the model (see Figure 2).
3. Dataset introduction
|
Variable Name |
Specific measurement content |
type |
Example |
|
age |
Customer Age |
Numerical type (continuous) |
Scope: 18-95 |
|
Balance |
Customer account balance |
Numerical type (continuous) |
Scope: -6847-81204 |
|
day |
Last contact days |
Numerical type (continuous) |
Scope: 1-31 |
|
job |
Occupation type |
Classification (nominal) |
“student” |
|
poutcome |
Last marketing campaign result |
Classification (nominal) |
“success” |
|
previous |
The number of times the customer has been contacted before |
Numerical type (discrete) |
Range: 0-58 |
|
pdays |
The number of days between last contact (no contact=-1) |
Numerical type (mixed) |
Scope: -1-854 |
|
compaign |
The number of times customers have been contacted in this event |
Numerical type (discrete) |
Scope: 1-63 |
|
duration |
The duration of this monitoring fee call |
Numerical type (continuous) |
Scope: 2-3881 |
|
month |
Last contact month |
Classification (ordered) |
“Jan” |
|
contact |
Type of contact information |
Classification (nominal) |
“cellular” |
|
loan |
Do you have a personal loan |
binary classification |
“yes” “no” |
|
housing |
Is there a housing loan available |
binary classification |
“yes” “no” |
|
default |
Is there a credit default |
binary classification |
“yes” “no” |
|
education |
Educational level |
Classification (ordered) |
“primary” |
|
marital |
marital status |
Classification (nominal) |
“married” |
|
deposit |
Do you accept fixed-term deposit business |
binary classification |
“yes” “no” |
|
age |
balance |
day |
duration |
campaign |
pdays |
previous |
|
|
count |
11162.0 |
11162.0 |
11162.0 |
11162.0 |
11162.00 |
11162. |
11162.0 |
|
mean |
41.2319 |
1528.53 |
15.6580 |
371.993 |
2.508421 |
51.330 |
0.83255 |
|
std |
11.9133 |
3225.41 |
8.42074 |
347.128 |
2.722077 |
108.75 |
2.29200 |
|
min |
18.0000 |
-6847.0 |
1.00000 |
2.00000 |
1.000000 |
-1.000 |
0.00000 |
|
25% |
32.0000 |
122.000 |
8.00000 |
138.000 |
1.000000 |
-1.000 |
0.00000 |
|
50% |
39.0000 |
550.000 |
15.0000 |
255.000 |
2.000000 |
-1.000 |
0.00000 |
|
75% |
49.0000 |
1708.00 |
22.0000 |
496.000 |
3.000000 |
20.750 |
1.00000 |
|
max |
95.0000 |
81204.0 |
31.0000 |
3881.00 |
63.00000 |
854.00 |
58.0000 |
This dataset is sourced from Kaggle. Descriptive statistical analysis was performed on the dataset, calculating the 'mean', 'std', 'min', and 'max' for each variable. Subsequently, the data was checked for missing values, and it was found that the data has been processed and contains no missing values. Finally, the data types were reviewed (see Table1 and 2).
4. Data visualization analysis
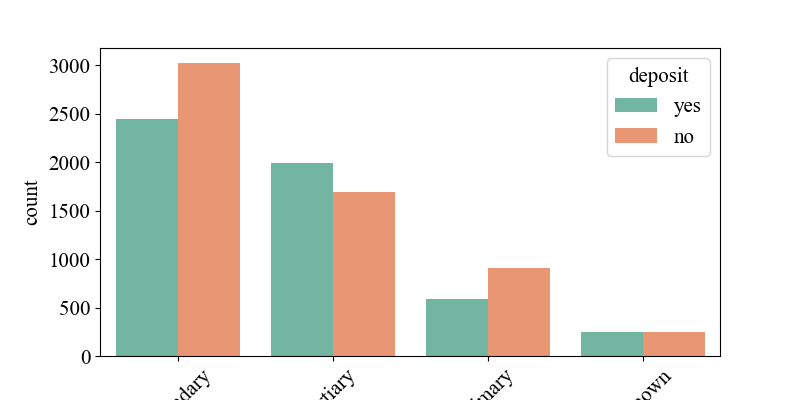
Figure 3 shows the impact of education level on 'deposit'. From the chart, it can be seen that the number of 'deposit' for those with secondary education is the highest, followed by higher education and then primary education. However, from the chart, it is evident that the number of 'yes' for 'deposit' among those with higher education is greater than 'no'. This indicates that people with higher education levels are more willing to accept banks' promotional fixed-term deposit products.
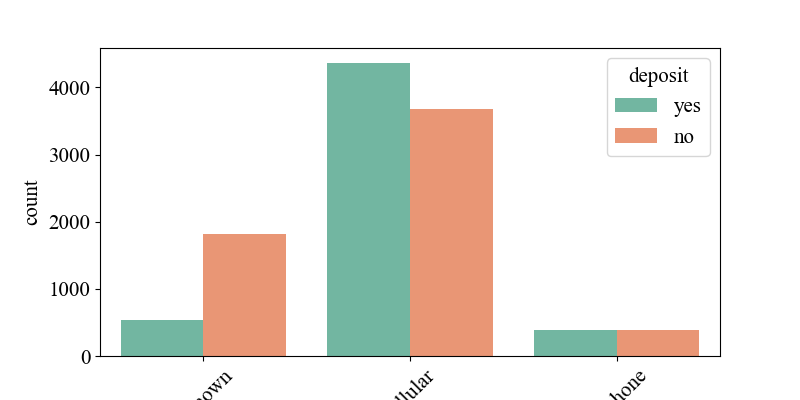
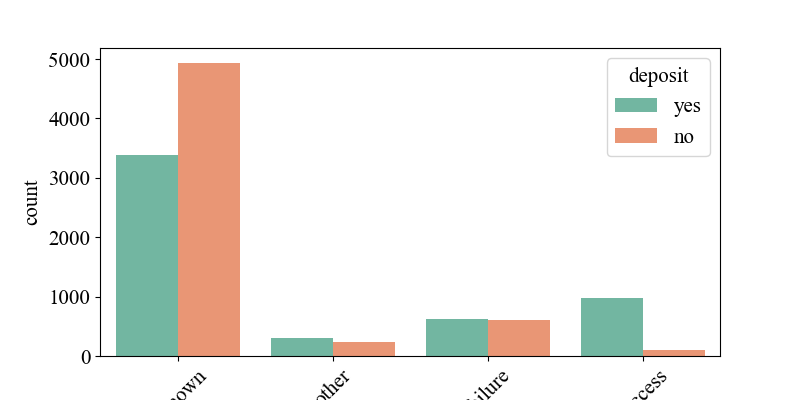
Figure 4 illustrates the relationship between the ways banks contact customers and 'deposit'. It shows that customers contacted via mobile phones are generally more willing to accept bank-promoted fixed-term deposit products. Analyzing this phenomenon in the current context, mobile phones are the primary means of communication for today's younger or highly active customer groups, while fixed-line phones may be more commonly used by older adults or family households, with lower usage rates today. Therefore, banks have higher success rates when contacting customers through mobile phones or SMS. Figure 7 depicts the relationship between customers' participation results in previous bank marketing activities and 'deposit'. It indicates that customers who responded and completed target behaviors (such as opening fixed-term deposit accounts) in past activities are more likely to accept bank marketing products.
4.1. Continuous column visualization
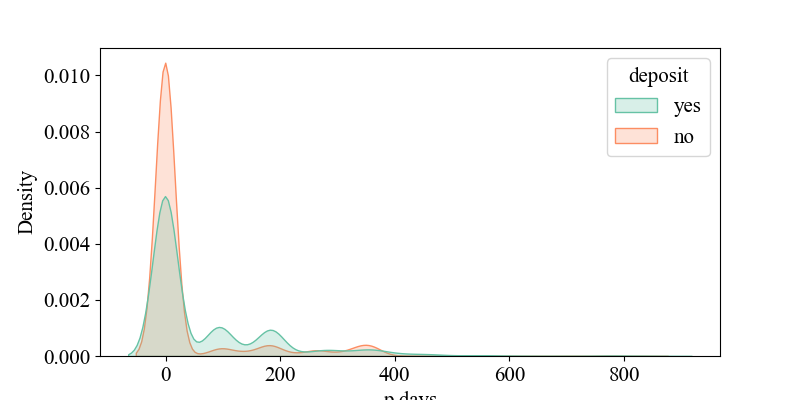
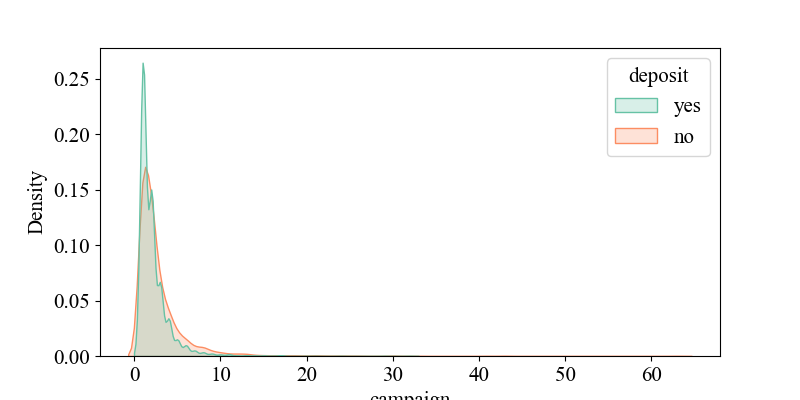
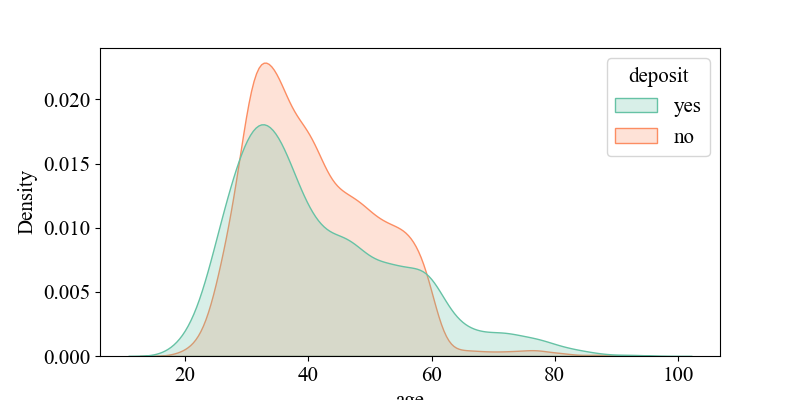
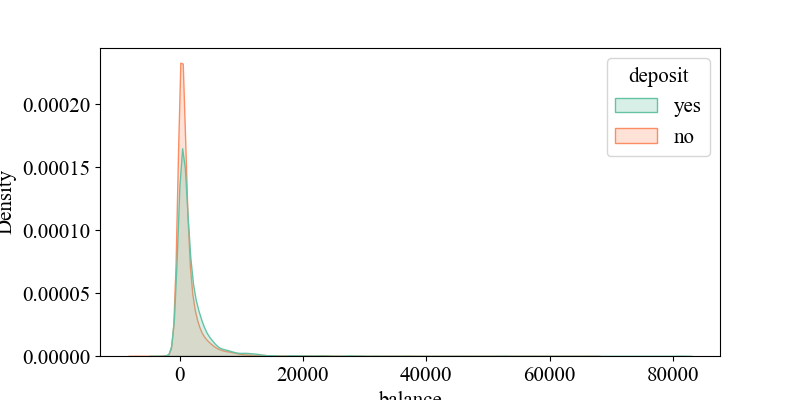
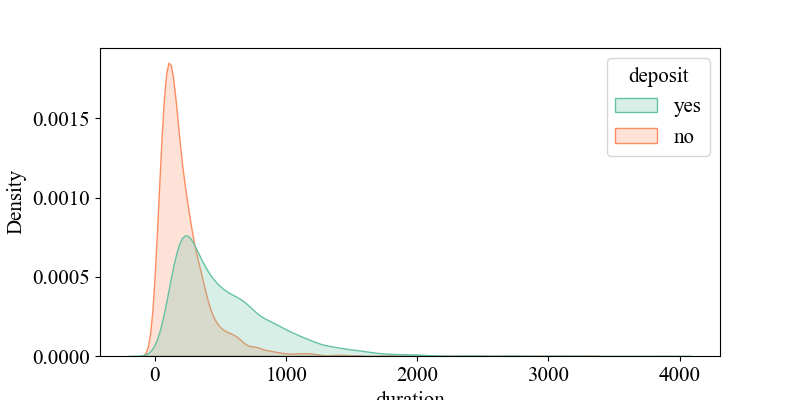
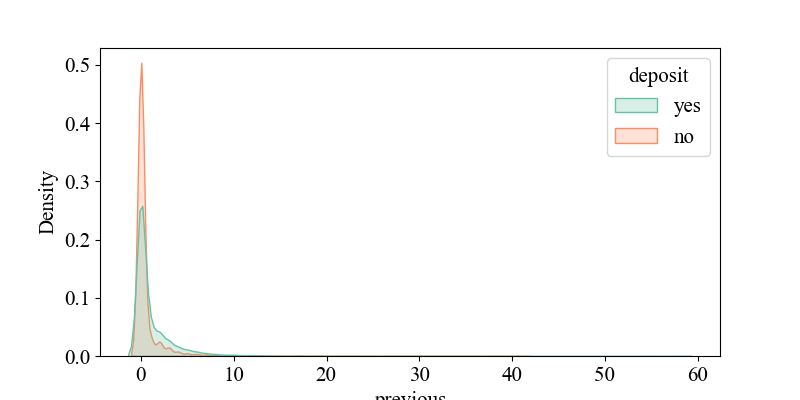
Figure 5-7 show the relationship between 'p days' and 'deposit', indicating that when 'p days' is around '0', the density of 'yes' is highest, suggesting that customers were recently contacted and may be more responsive to current activities. It illustrates the connection between 'campaign' and 'deposit', showing that around '2', the density of 'yes' is highest, implying that higher contact frequency might decrease customer interest (requiring multiple contacts, likely over four times). It depicts the relationship between 'age' and 'deposit', revealing that middle-aged individuals around 30 years old are more receptive to bank marketing products. It shows the link between 'balance' and 'deposit', indicating that customers with account balances around 5,000 yuan are more likely to accept bank marketing products, while negative balances may reflect credit risks, requiring banks to be cautious in promoting financial products. It displays the connection between 'duration' and 'deposit', suggesting that longer call durations may indicate higher customer interest and a greater likelihood of response. It illustrates the relationship between 'previous' and 'deposit', showing that customers with many previous contacts but no response (poutcome = failure) may have reduced interest in current activities.
4.2. Heatmap of correlation coefficients for continuous variables
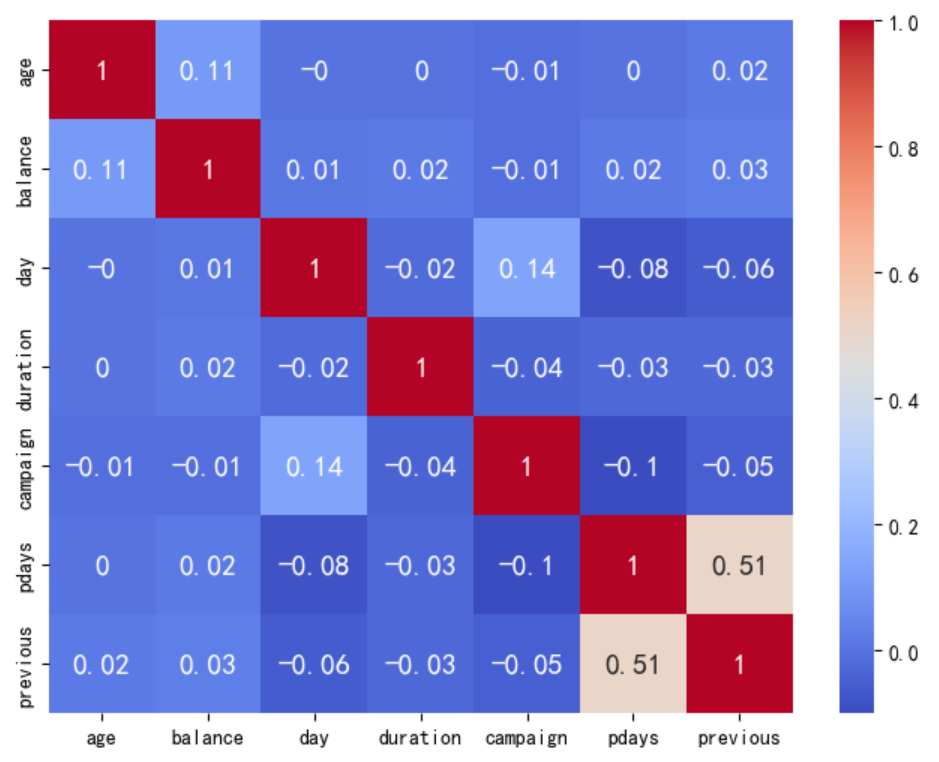
A heatmap of correlation coefficients for continuous variables is a graphical tool used to visually display the correlations between multiple continuous variables. By observing the color distribution of the heatmap as a whole, the redder the color, the stronger the linear correlation between the two variables; the bluer the color, the weaker the linear correlation between the two variables. From the heatmap, it can be seen that the overall colors tend towards blue, indicating that the linear correlation between the variables is generally weak. However, the linear correlation between pdays and previous is relatively strong compared to other variable pairs, approximately 0.5. It was found that the overall data exhibits significant nonlinear associations (see Figure 8).
5. Machine learning model training
The overall data shows a significant nonlinear relationship, so to learn the significant nonlinear correlation of the data, the following machine learning method was designed.
5.1. KNN
5.1.1. Model performance results
|
precision |
recall |
f1-score |
support |
|
|
0 |
0.77 |
0.78 |
0.77 |
1166 |
|
1 |
0.75 |
0.74 |
0.75 |
1067 |
|
accuracy |
0.76 |
2233 |
||
|
macro avg |
0.76 |
0.76 |
0.76 |
2233 |
|
weighted avg |
0.76 |
0.76 |
0.76 |
2233 |
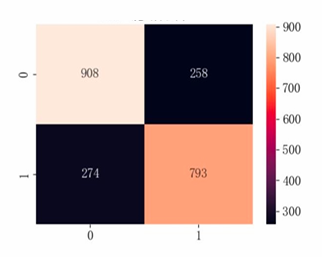
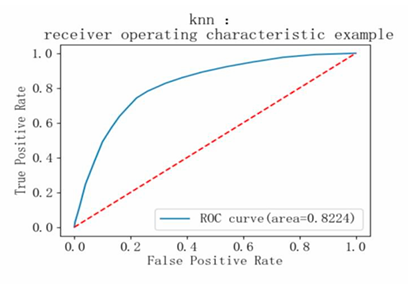
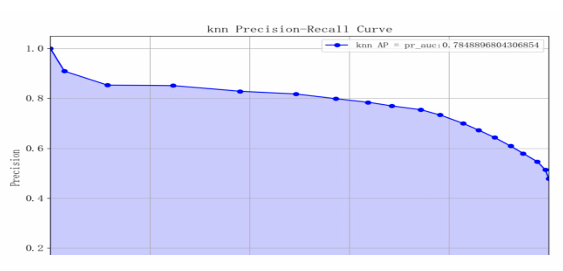
Based on the model performance training results, the metrics for category 0 are slightly better than those for category 1, but the difference is minor. The overall prediction accuracy of the model is 0.76, with both macro average and weighted average being 0.76, indicating that the distribution of alternative samples is relatively balanced. The AUC value of the model is approximately 0.82, and the AP value is 0.78, suggesting that the model's performance is moderate (see Table 3 and Figure 9-11).
5.1.2. Model performance analysis
Advantages of KNN: It is simple and easy to understand, with straightforward algorithm logic that is easy to implement; KNN adapts to nonlinear data, does not assume data distribution, and can handle data with nonlinear relationships, making it suitable for bank marketing datasets where complex relationships may exist. It is also well-suited for small-scale datasets; KNN performs well on multi-class problems. However, KNN is sensitive to noise and outliers. Some features in this dataset contain outliers (e.g., balance being negative, p days = -1 indicating no contact), and KNN's high sensitivity to noise and outliers might lead it to choose irrelevant neighbors, thus affecting model performance. Additionally, KNN has high computational complexity and low efficiency, which could result in delays when responding to real-time bank marketing activities due to the large volume of customer data.
5.2. Logistic Regression
5.2.1. Model performance results
|
precision |
recall |
f1-score |
support |
|
|
0 |
0.79 |
0.82 |
0.80 |
1166 |
|
1 |
0.79 |
0.76 |
0.78 |
1067 |
|
accuracy |
0.79 |
2233 |
||
|
macro avg |
0.79 |
0.79 |
0.79 |
2233 |
|
weighted avg |
0.79 |
0.79 |
0.79 |
2233 |
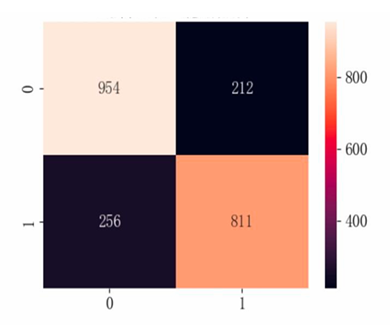
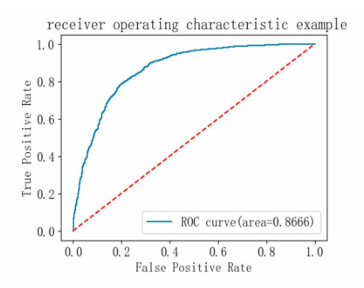
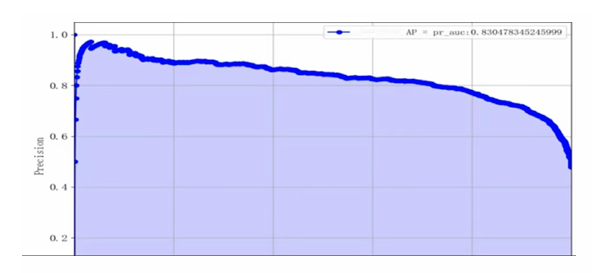
Based on the model performance training results, the logistic regression model performs relatively evenly across both categories, with an overall accuracy of 0.79, an AUC of 0.8666, and an AP of 0.8305, indicating that the model has good classification performance. From the supporting data, it can be seen that the number of samples for category 0 is slightly higher than that for category 1, which may affect the model's prediction performance for category 1 (see Table 4 and Figure 12-14).
5.2.2. Model performance analysis
Advantages of logistic regression: The logistic regression model is simple in form, easy to implement and understand; it has strong interpretability, with model weights representing the degree of influence of features on the target variable. Disadvantages of logistic regression: Logistic regression assumes that data is linearly separable, and it performs poorly on non-linear problems, which is evident in this dataset that shows significant non-linear correlation; there is class imbalance, with slightly more samples of class 0 than class 1, making the logistic regression model somewhat lacking in handling class imbalance issues and accurately predicting class 1.
5.3. Catboost
5.3.1. Model performance results
|
precision |
recall |
f1-score |
support |
|
|
0 |
0.87 |
0.83 |
0.85 |
1166 |
|
1 |
0.82 |
0.87 |
0.84 |
1067 |
|
accuracy |
0.85 |
2233 |
||
|
macro avg |
0.85 |
0.85 |
0.85 |
2233 |
|
weighted avg |
0.85 |
0.85 |
0.85 |
2233 |
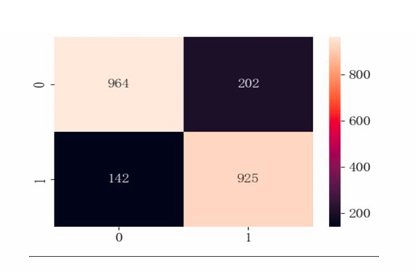
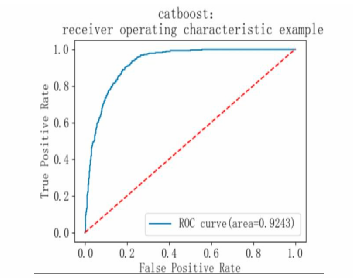
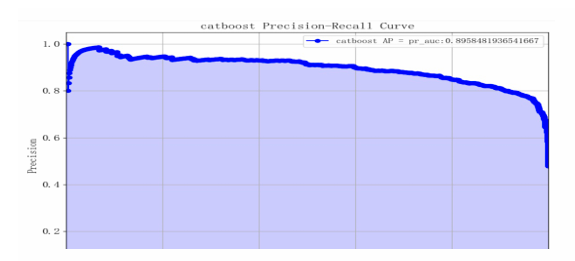
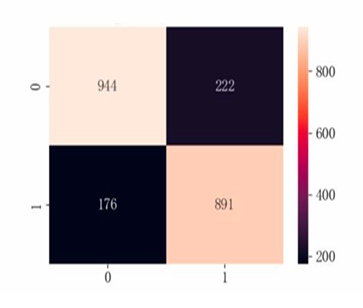
The analysis of model performance shows that both precision and recall for class 0 and class 1 are high, with an overall accuracy rate of 0.85. The macro average and weighted average F1 scores are also high at 0.85, indicating that the model performs well on both categories and maintains good overall balance. The model's AP value is 0.89, suggesting it effectively balances recall and precision; its AUC value is 0.92, indicating excellent performance in distinguishing between positive and negative classes (see Table 5 and Figure 15-17).
5.3.2. Model performance analysis
CatBoost effectively overcomes outliers and class imbalance in this dataset due to its strong handling of categorical features and robustness. The high AP and AUC values indicate stable performance across different thresholds, highlighting its advantage in distinguishing between positive and negative classes while maintaining a balance between precision and recall. Additionally, the confusion matrix shows that the misclassification rates for categories 1 and 0 are similar, with an even F1 score, demonstrating that the CatBoost model is well-suited for predictive tasks in bank marketing.
5.4. Gradient Boosting Decision Tree (GBDT)
|
precision |
recall |
f1-score |
support |
|
|
0 |
0.84 |
0.81 |
0.83 |
1166 |
|
1 |
0.80 |
0.84 |
0.82 |
1067 |
|
accuracy |
0.82 |
2233 |
||
|
macro avg |
0.82 |
0.82 |
0.82 |
2233 |
|
weighted avg |
0.82 |
0.82 |
0.82 |
2233 |
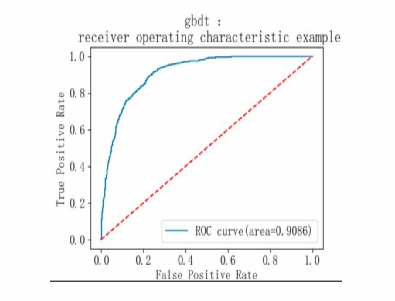
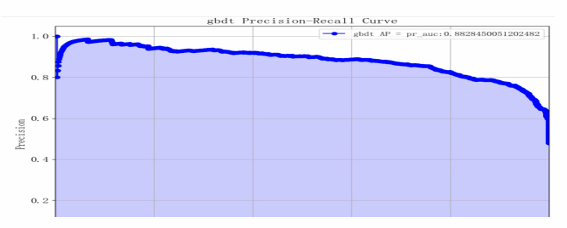
Based on the model performance training results, the F1 scores for categories 1 and 0 are relatively high, indicating that the model performs comparably well across both categories. The overall accuracy of the model is 0.82, with an AP value of 0.88 and an AUC value of 0.90, demonstrating that the model has strong classification capabilities and good overall performance (see Table 6 and Figure 18-20).
5.5. Random Forest
|
precision |
recall |
f1-score |
support |
|
|
0 |
0.86 |
0.81 |
0.83 |
1166 |
|
1 |
0.80 |
0.86 |
0.83 |
1067 |
|
accuracy |
0.83 |
2233 |
||
|
macro avg |
0.83 |
0.83 |
0.83 |
2233 |
|
weighted avg |
0.83 |
0.83 |
0.83 |
2233 |
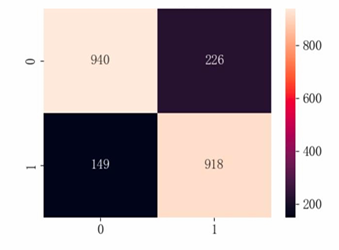
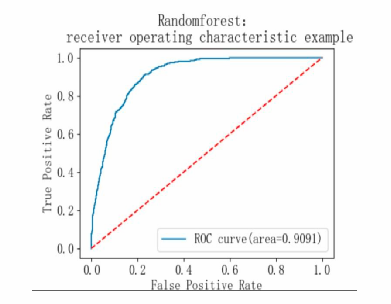
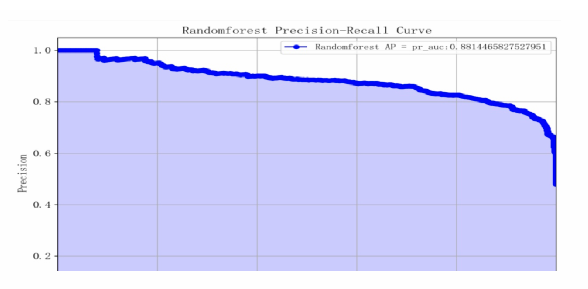
Based on the model performance training results, the F1 scores for categories 1 and 0 are both 0.83, indicating that the model's classification performance is relatively balanced. The macro average and weighted average F1 scores are both 0.83, with an overall accuracy rate of 0.83, an AP value of 0.88, and an AUC value of 0.90, suggesting that the model performs well (see Table 7 and Figure 21-23).
6. Comparison of machine learning model performance
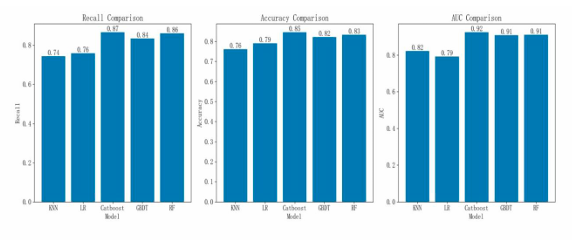
From the model performance comparison chart, the Catboost model has a recall rate of 0.87, an accuracy rate of 0.85, and an AUC value of 0.92. This indicates that the Catboost model performs the best, suggesting that it is highly suitable for predictive tasks in bank marketing (see Figure 24).
7. Feature importance and SHAP analysis
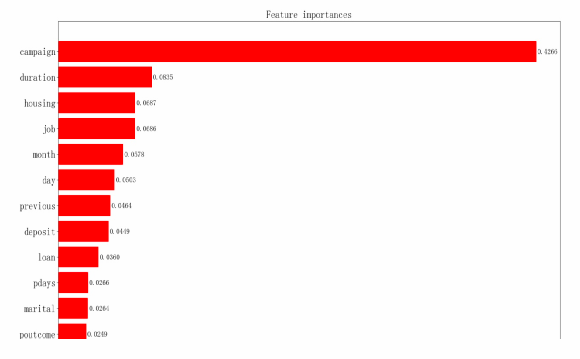
Feature importance analysis is a method used in machine learning to evaluate the impact of input features on model prediction results. We can see that the 'campaign' feature has an importance score of 0.4266, indicating that the number of times the bank contacted the customer had the greatest influence on the model's predictions during this marketing campaign, followed by 'duration' (see Figure 25-26).
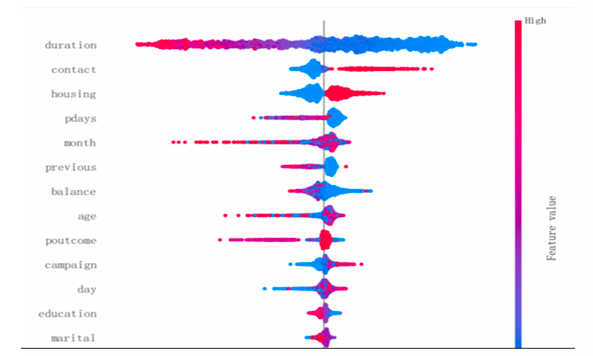
SHAP explainbility values are based on Shapley values [10]. SHAP (SHapley Additive exPlanations) values are a method for explaining the predictions of machine learning models by quantifying the contribution of each feature to the prediction outcome. Each point represents the SHAP value of a sample, with color indicating the size of the feature value (typically red indicates high feature values, blue indicates low feature values). A positive SHAP value on the right side means that the feature has a positive impact on the prediction result, while a negative value on the left side has the opposite effect. The greater the distribution of SHAP values, the more significant the feature's impact on the model's prediction results. In the chart, the SHAP values for 'duration' are widely distributed, indicating that call duration significantly affects the model's prediction results. The positive SHAP values on the right side for 'duration' are blue, indicating low feature values, while the negative SHAP values on the left side are red, indicating high feature values. This suggests that when the feature value is lower, its positive impact on the model's output is more pronounced. Next, the SHAP values for 'contact' are also widely distributed, indicating that the contact method has a certain influence on the model's prediction results. The remaining features have narrower distributions, suggesting they have less impact on the model's prediction results. Based on feature importance analysis and SHAP analysis, 'campaign' and 'duration' are the most important features, having the greatest impact on the model's prediction results.
8. Conclusion
8.1. Research conclusions
This study conducts statistical descriptions and visual analyses based on banking marketing data, revealing a significant nonlinear correlation. Consequently, the aforementioned model framework was designed for research, comparing the performance of five models and performing feature importance and SHAP value visual analyses. According to the feature importance and SHAP analyses, 'campaign' and 'duration' are the most important features. Excessive contact attempts may reduce customer interest, while longer call durations indicate higher customer interest and a higher likelihood of response. Therefore, these two features have the greatest impact on the model's prediction results.
The study designed a bank marketing prediction model based on Catboost and compared its performance with four other machine learning models (KNN, logistic regression, GBDT, and random forest). The comparison shows that the Catboost model has a recall rate of 0.87, an accuracy rate of 0.85, and an AUC value of 0.92, indicating that it performs best among the models, making it highly suitable for such banking marketing prediction tasks.
8.2. Future research
Due to insufficient data sample size, the machine learning model is unable to extract enough information, affecting the validity of the experimental results. Additionally, the model may suffer from 'algorithmic bias' due to data bias, and the black-box nature of CatBoost may obscure the indirect impact of sensitive features. Future research could also explore ensemble learning as a direction, delving into different configurations of CatBoost for integration to enhance generalization ability.
References
[1]. Sun, S. Q., (2023) China banking marketing digitalization industry research report. In Proceedings of the October 2023 iResearch Conference, Shanghai iResearch Market Consulting Co., Ltd. 304–387.https: //doi.org/10.26914/c.cnkihy.2023.094272
[2]. Song, K. H., (2022) Research on bank marketing data analysis and application based on hybrid sampling and ensemble learning [Master’s thesis]. Guangdong University of Finance & Economics. DOI: 10.27734/d.cnki.ggdsx.2022.000967
[3]. Danyuan, Y., (2021) Design and implementation of bank marketing system based on customer demand prediction [Master’s thesis]. Southeast University, https: //doi.org/10.27014/d.cnki.gdnau.2021.003612
[4]. Ben Jabeur, S., Gharib, C., (2021) Mefteh-Wali, S., & Ben Arfi, W., CatBoost model and artificial intelligence techniques for corporate failure prediction. Technological Forecasting and Social Change, 166, 120658. https: //doi.org/10.1016/j.techfore.2021.120658
[5]. Zhang, Y., (2021) Composite CatBoost-based bank customer churn prediction model [Master’s thesis]. Lanzhou University. DOI: 10.27204/d.cnki.glzhu.2021.000568
[6]. Lai, J., (2023) Research on personal loan default prediction based on random forest model [Master’s thesis]. Shihezi University. DOI: 10.27332/d.cnki.gshzu.2023.000509
[7]. You, M., (2021) Research on precision marketing for Y Bank’s individual customers based on data mining [Master’s thesis]. Southeast University. DOI: 10.27014/d.cnki.gdnau.2021.004159
[8]. Liu, G. P., (2023) Research on risk assessment of internet financial loans based on CatBoost algorithm [Master’s thesis]. East China Normal University. DOI: 10.27149/d.cnki.ghdsu.2023.002717
[9]. Hu, Y., (2022) Empirical research on financial credit risk control model based on machine learning algorithms [Master’s thesis]. North Minzu Universit. DOI: 10.27754/d.cnki.gbfmz.2022.000166
[10]. García-Céspedes, R., (2025) Alias-Carrascosa, F. J., & Moreno, M., On Machine Learning models explainability in the banking sector: the case of SHAP. Journal of the Operational Research Society, 45, 1–13. https: //doi.org/10.1080/01605682.2025.2485263
Cite this article
Lu,W. (2025). Research on the Optimization of Bank Precision Marketing Strategies Based on Catboost. Advances in Economics, Management and Political Sciences,200,103-122.
Data availability
The datasets used and/or analyzed during the current study will be available from the authors upon reasonable request.
Disclaimer/Publisher's Note
The statements, opinions and data contained in all publications are solely those of the individual author(s) and contributor(s) and not of EWA Publishing and/or the editor(s). EWA Publishing and/or the editor(s) disclaim responsibility for any injury to people or property resulting from any ideas, methods, instructions or products referred to in the content.
About volume
Volume title: Proceedings of ICEMGD 2025 Symposium: Innovating in Management and Economic Development
© 2024 by the author(s). Licensee EWA Publishing, Oxford, UK. This article is an open access article distributed under the terms and
conditions of the Creative Commons Attribution (CC BY) license. Authors who
publish this series agree to the following terms:
1. Authors retain copyright and grant the series right of first publication with the work simultaneously licensed under a Creative Commons
Attribution License that allows others to share the work with an acknowledgment of the work's authorship and initial publication in this
series.
2. Authors are able to enter into separate, additional contractual arrangements for the non-exclusive distribution of the series's published
version of the work (e.g., post it to an institutional repository or publish it in a book), with an acknowledgment of its initial
publication in this series.
3. Authors are permitted and encouraged to post their work online (e.g., in institutional repositories or on their website) prior to and
during the submission process, as it can lead to productive exchanges, as well as earlier and greater citation of published work (See
Open access policy for details).
References
[1]. Sun, S. Q., (2023) China banking marketing digitalization industry research report. In Proceedings of the October 2023 iResearch Conference, Shanghai iResearch Market Consulting Co., Ltd. 304–387.https: //doi.org/10.26914/c.cnkihy.2023.094272
[2]. Song, K. H., (2022) Research on bank marketing data analysis and application based on hybrid sampling and ensemble learning [Master’s thesis]. Guangdong University of Finance & Economics. DOI: 10.27734/d.cnki.ggdsx.2022.000967
[3]. Danyuan, Y., (2021) Design and implementation of bank marketing system based on customer demand prediction [Master’s thesis]. Southeast University, https: //doi.org/10.27014/d.cnki.gdnau.2021.003612
[4]. Ben Jabeur, S., Gharib, C., (2021) Mefteh-Wali, S., & Ben Arfi, W., CatBoost model and artificial intelligence techniques for corporate failure prediction. Technological Forecasting and Social Change, 166, 120658. https: //doi.org/10.1016/j.techfore.2021.120658
[5]. Zhang, Y., (2021) Composite CatBoost-based bank customer churn prediction model [Master’s thesis]. Lanzhou University. DOI: 10.27204/d.cnki.glzhu.2021.000568
[6]. Lai, J., (2023) Research on personal loan default prediction based on random forest model [Master’s thesis]. Shihezi University. DOI: 10.27332/d.cnki.gshzu.2023.000509
[7]. You, M., (2021) Research on precision marketing for Y Bank’s individual customers based on data mining [Master’s thesis]. Southeast University. DOI: 10.27014/d.cnki.gdnau.2021.004159
[8]. Liu, G. P., (2023) Research on risk assessment of internet financial loans based on CatBoost algorithm [Master’s thesis]. East China Normal University. DOI: 10.27149/d.cnki.ghdsu.2023.002717
[9]. Hu, Y., (2022) Empirical research on financial credit risk control model based on machine learning algorithms [Master’s thesis]. North Minzu Universit. DOI: 10.27754/d.cnki.gbfmz.2022.000166
[10]. García-Céspedes, R., (2025) Alias-Carrascosa, F. J., & Moreno, M., On Machine Learning models explainability in the banking sector: the case of SHAP. Journal of the Operational Research Society, 45, 1–13. https: //doi.org/10.1080/01605682.2025.2485263