1. Introduction
A-shares, or RMB ordinary shares, are ordinary shares issued by companies incorporated in China, listed in China, denominated in RMB and available for subscription and trading in RMB by domestic institutions, organizations or individuals. With the gradual disappearance of the epidemic and the gradual recovery of the Chinese economy, investing in A-shares becomes a good option for capital management.
The portfolio selection in this paper is based on a mean-variance model. The mean-variance model is a classic portfolio optimization model that has been widely followed and studied since the 1950s. The mean-variance model was first introduced in 1952, when Markowitz used the expected return and standard deviation of a portfolio as an indicator of portfolio effectiveness and introduced the concept of an "efficient frontier." The concept of "efficient frontier", where the portfolio with the smallest standard deviation among all portfolios with the same expected return is the optimal portfolio [1]. in 1964, the capital asset pricing model (CAPM) was proposed, which is based on the mean-variance model and considers the effect of market risk and asset-specific risk on expected returns [2]. The CAPM was further developed into the three-factor model, which improved on the CAPM by considering market factors, firm size and the ratio of stock price to book value, improving the accuracy of asset pricing [3]. The Black-Littman model was also proposed in the same year, which improves on the mean-variance model by introducing subjective views and information. This model can help investors to better deal with uncertainty and information asymmetry and improve portfolio effectiveness [4].
In summary, the Mean-Variance model is a classical model in the field of portfolio optimization, which has evolved and improved with the changes in financial markets and the development of technology.
The rising penetration of the new energy vehicle market has attracted the attention of a wide range of investors. This is the main reason why this paper has been chosen to analyze this sector [5]. Nowadays, in the context of the "double carbon" target, green and low-carbon development has become the main theme of China’s economic and social development. Low carbon economy is a sustainable economic development model based on low energy consumption, low emissions and low pollution. Low carbon economy is a sustainable economic development model based on low energy consumption, low emissions and low pollution. The development of the new energy industry is of great importance to China's low-carbon economic transformation. It is of great significance to improve energy efficiency, create a clean energy structure and promote the development of new energy industries for China's low carbon economic transformation [6]. The new energy sector will be the new driving force behind China's economic development and transformation [7]. In general, "New Energy + Technology Innovation" will benefit from China's national policy in the medium to long term and is expected to perform a stable upward swing climb in the overall market as investors' risk appetite picks up [8], In this context, the new energy sector has become a popular area for investment. This paper uses a mean-variance model to study portfolios in new energy, using Chinese A-shares as the research data, to provide a reference for individual investors' portfolio management.
In this paper, a portfolio consisting of nine stocks will be constructed using Monte Carlo method [9], and the asset weights in the minimum variance allocation and maximum Sharpe ratio allocation will be derived using the first half-year data. The cumulative returns of the two asset allocations are then compared with the equal weighting model using the second half-year data. The results show that the maximum Sharpe ratio allocation significantly outperforms the asset allocation of the equal-weight model, while the minimum variance allocation maintains better stability with essentially comparable returns, and the model utility is validated.
2. Data
The data in the paper are sourced from the RESSET database (http://www.resset.cn/). This paper selects the nine stocks with the highest market capitalization in the new energy sector in the Shenzhen Stock Exchange, which are CAQC, GXGK, BFHC, GFLY, BYD, YWLN, YGDY, JSJD and XDZN. (Details are shown in Fig. 1, Table 1 and Table 2) Closing prices from January 4th, 2022, to December 31st, 2022, are collected and separated into training set and test set. The training set is used to calculate the average returns and covariance matrix to construct the efficient frontier. The test set is used to determine the merits of the asset allocation by comparing the cumulative returns of the selected asset allocation with those of an equally weighted model.
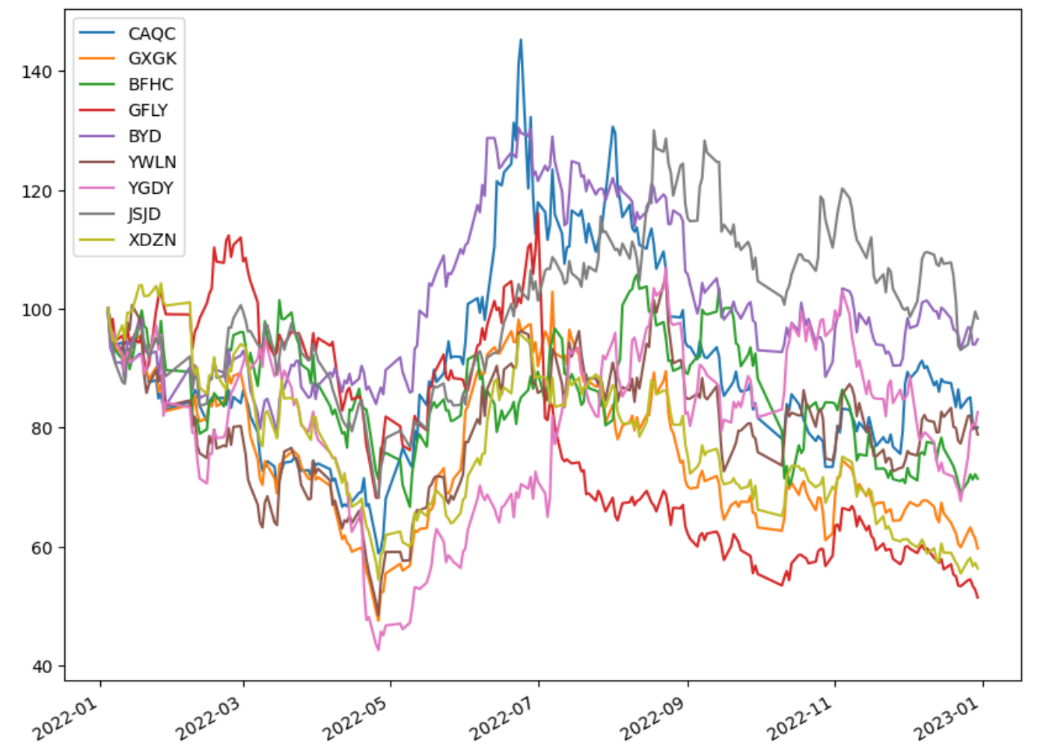
Figure 1: Closing price change curves for nine stocks.
Table 1:Descriptive statistics of the selected assets.
CAQC | GXGK | BFHC | GFLY | BYD | YWLN | YGDY | JSJD | XDZN | |
Mean | -0.0003 | -0.0016 | -0.0008 | -0.0021 | 0.0002 | -0.0003 | 0.0001 | 0.0003 | -0.002 |
Variance | 0.0013 | 0.0010 | 0.0012 | 0.0013 | 0.0008 | 0.0013 | 0.0018 | 0.0009 | 0.0009 |
Max | 0.1003 | 0.1002 | 0.1000 | 0.1000 | 0.0830 | 0.1160 | 0.2000 | 0.1196 | 0.0830 |
Min | -0.1723 | -0.1001 | -0.1000 | -0.2971 | -0.0736 | -0.09244 | -0.2000 | -0.0957 | -0.1019 |
The Table 1 shows that 'JSJD' has the highest average return while 'GFLY' has the lowest average return. For variance, 'BYD' is the lowest, while 'YDGY' is the highest.' YDGY' has the highest maximum return and the lowest minimum return, while 'BYD' has the lowest maximum return and the highest minimum return. The covariance matrix for the 9 stocks is as follows.
Table 2: The covariance matrix for the 9 stocks (continue).
CAQC | GXGK | BFHC | GFLY | BYD | YWLN | YGDY | JSJD | XDZN | |
CAQC | 0.422090 | 0.140310 | 0.105748 | 0.068412 | 0.164120 | 0.176934 | 0.079546 | 0.133403 | 0.190642 |
GXGK | 0.140310 | 0.261932 | 0.171844 | 0.193514 | 0.170067 | 0.260207 | 0.204896 | 0.166914 | 0.186545 |
BFHC | 0.105748 | 0.171844 | 0.337536 | 0.149862 | 0.162654 | 0.212294 | 0.166805 | 0.175739 | 0.185297 |
GFLY | 0.068412 | 0.193514 | 0.149862 | 0.302272 | 0.138986 | 0.230617 | 0.172649 | 0.157808 | 0.159701 |
BYD | 0.164120 | 0.170067 | 0.162654 | 0.138986 | 0.252967 | 0.192984 | 0.130138 | 0.144838 | 0.173828 |
YWLN | 0.176934 | 0.260207 | 0.212294 | 0.230617 | 0.192984 | 0.395680 | 0.210687 | 0.190237 | 0.231260 |
YGDY | 0.079546 | 0.204896 | 0.166805 | 0.172649 | 0.130138 | 0.210687 | 0.461472 | 0.200049 | 0.168696 |
JSJD | 0.133403 | 0.166914 | 0.175739 | 0.157808 | 0.144838 | 0.190237 | 0.200049 | 0.213734 | 0.174854 |
XDZN | 0.190642 | 0.186545 | 0.185297 | 0.159701 | 0.173828 | 0.231260 | 0.168696 | 0.174854 | 0.295229 |
\( Variance: σ_{P}^{2}=var(\sum _{i}{w_{i}}{r_{i}} )=\sum _{ij}{w_{i}}{w_{j}}cov({r_{i}}{r_{j}}) \) | (1) | ||||||||
3. Methods
Defining the mean as the rate of return and the variance as the risk, quadratic programming balances return and risk so that the mutually constraining objectives can be optimally balanced, i.e., seeking the portfolio with the least risk for a given return or the portfolio that maximizes return for a given risk.
This paper considers two specific portfolios and identifies them in the efficient frontier: the maximum Sharpe ratio portfolio and the minimum volatility portfolio.
Variance is used to measure the risk of an investment model, the higher the variance the higher the risk, Markowitz proposed the following definition of portfolio variance.
The covariance \( cov({r_{i}}{r_{j}}) \) is a measure of the correlation between the two investment directions. trend is the same, the sloped covariance is positive and the closer the correlation is, the closer the value is to 1; conversely, it is negative and tends to be -1.
The Sharpe ratio is a commonly used tool to measure and evaluate risk-adjusted returns in investments [10]. It is calculated as follows.
\( SharpeRatio= \frac{E({R_{p}})-{R_{f}}}{{σ_{p}}} \) | (2) | ||
\( {R_{f}} \) stands for Risk-Free Rate, E ( \( {R_{p}} \) )indicates the expected return on the portfolio, \( {σ_{p}} \) represents the standard deviation of the portfolio. A portfolio with the same expected return has a higher Sharpe ratio if its standard deviation is low. As a result, a portfolio with the largest Sharpe ratio outperforms other portfolios in terms of risk-adjusted performance. The lowest variance strategy helps risk-averse investors minimize stock risk while maintaining market risk, so the lowest volatility combination will provide clues to investors.
4. Results
Based on the income data of nine stocks from January 4, 2022, to June 30, 2022, this paper simulates the results of 100,000 portfolios with different weights using the Monte Carlo method and displays the expected returns and volatility of these portfolios in the same chart, as shown in the Fig. 2 below.
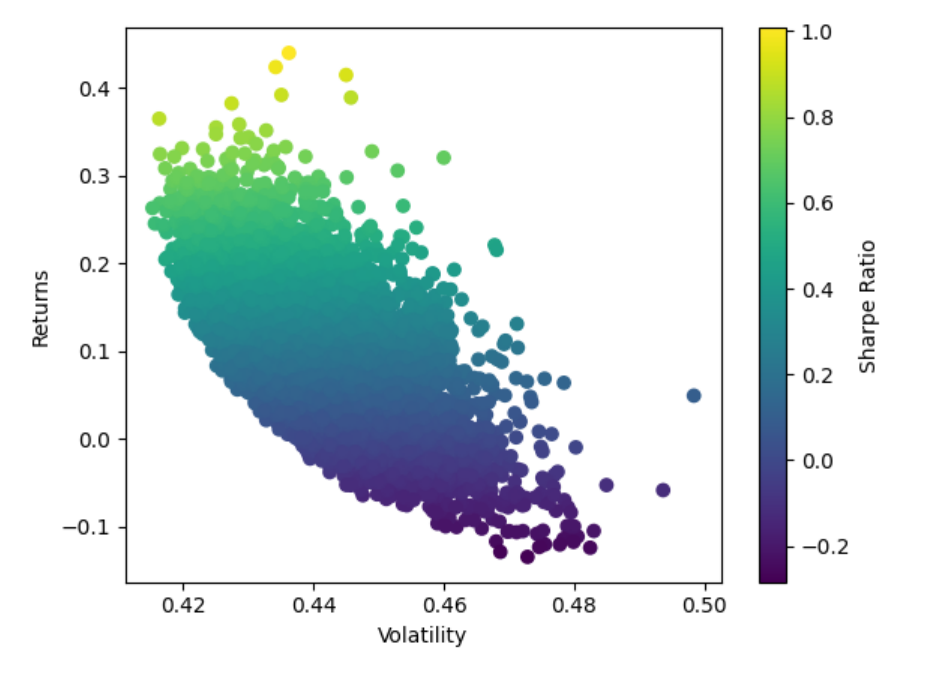
Figure 2: Efficient frontier retrieved by Monte Carlo method.
As shown in the diagram, these results form a sector called the efficient set and the curved boundary of the efficient set is called the efficient frontier. Based on this diagram and the mean variance model, the optimal portfolios, namely the maximum Sharpe ratio portfolio and the minimum volatility portfolio, can be obtained. They can be considered to have the maximum return per unit of risk, and the calculated weight allocations, returns, variances and Sharpe indices are as follows in Table 3 and Fig. 3.
Table 3: Asset weights under two criterions.
CAQC | GXGK | BFHC | GFLY | BYD | |
Maximum Sharpe Ratio | 29.27% | 1.18% | 4.92% | 17.05% | 31.09% |
Minimum Volatility | 15.85% | 5.39% | 11.38% | 18.58% | 20.72% |
YWLN | YGDY | JSJD | XDZN | ||
Maximum Sharpe Ratio | 8.77% | 1.32% | 5.1% | 1.29% | |
Minimum Volatility | 0.54% | 7.49% | 14.32% | 5.73% |
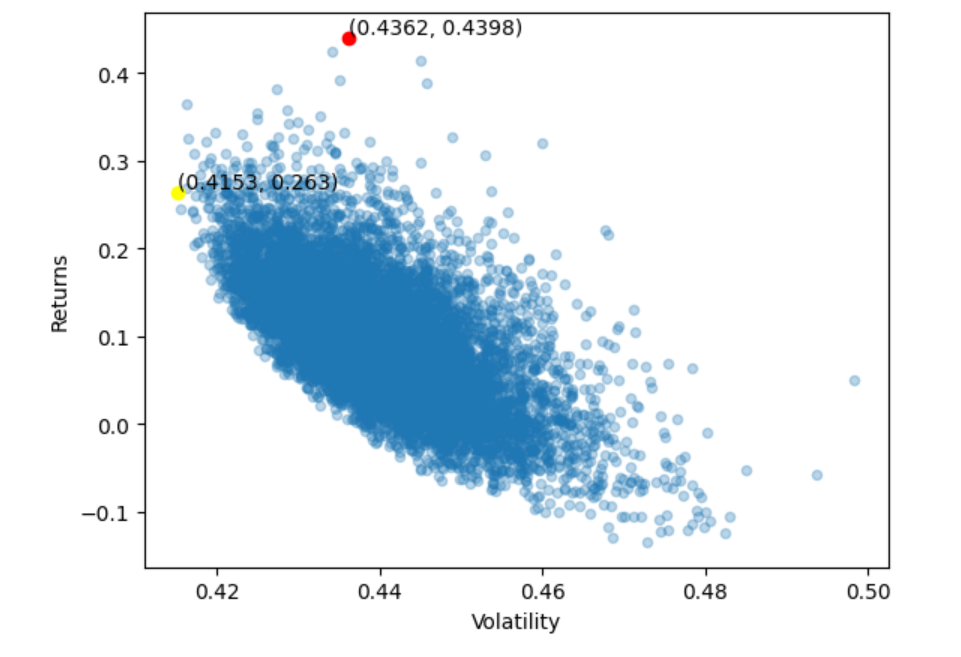
Figure 3: Maximum sharpe ratio point and minimum variance point.
The results of these two portfolios are very different. In the maximum Sharpe Ratio portfolio, BYD has the largest weighting at 31.09%, while GXGK has the smallest weighting at 1.18%. In the minimum volatility portfolio, BYD has the largest weighting at 20.72% while YWLN has the lowest weighting at 0.54%. Comparing between these two portfolios, CAQC, BFHC, YWLN, YGDY and JSJD have very different weights, while GXGK and XDZN have very small weights in both portfolios. This paper validates the model using real data from 1 July 2022 to 30 December 2022, and the daily yield change curves obtained are as follows in Table 4, Fig. 4, Fig. 5 and Table 5.
Table 4: Portfolio characteristics of the two portfolios.
Sharp Ratio | Volatility | Returns | |
Maximum Sharpe Ratio | 1.0082 | 0.4362 | 43.98% |
Minimum Volatility | 0.6333 | 0.4153 | 26.30% |
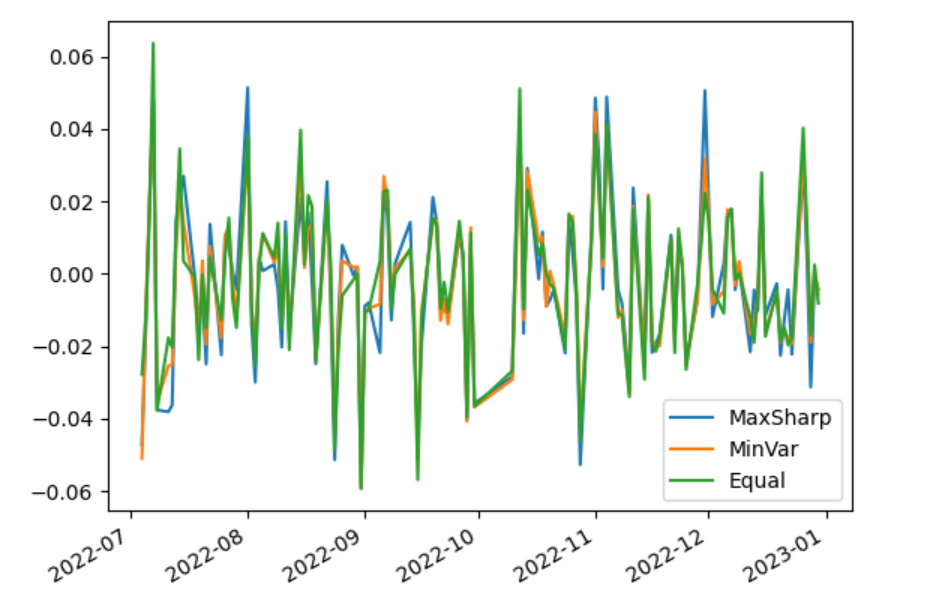
Figure 4:Daily yield change curve.
The blue line represents a maximum Sharpe ratio portfolio, the orange line represents a minimum variance portfolio, and the green line represents an equally weighted portfolio.
The cumulative returns of the maximum Sharpe ratio, minimum variance and equal-weighted portfolios were calculated, and the results were -4.6%, -22.23% and -21.25% respectively, indicating that the maximum Sharpe ratio model outperformed the equal-weighted model, while the minimum variance model was inferior to the equal-weighted model.
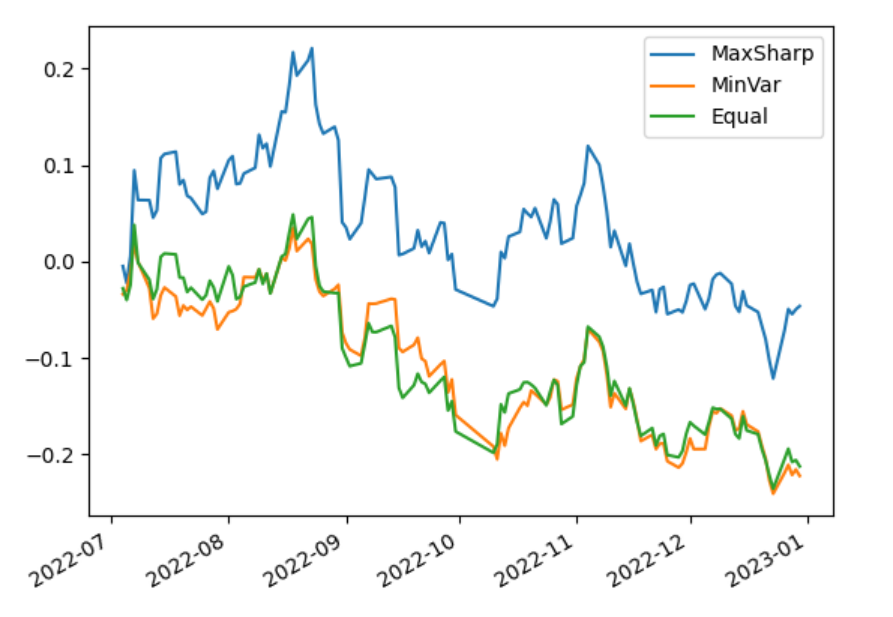
Figure 5: Cumulative return.
Table 5: Cumulative yield on the last day.
Returns | |
Maximum Sharpe Ratio | -4.6% |
Minimum Volatility | -22.23% |
Equal Weighting | -21.25% |
5. Conclusion
This paper uses the Monte Carlo method to simulate investment weights and apply mean-variance analysis for portfolio optimization to construct a maximum Sharpe ratio portfolio and a minimum volatility portfolio. The maximum Sharpe Ratio portfolio was found to have a much higher return than the minimum volatility portfolio and the equal-weighted portfolio using real data in the second half of the year, proving that the maximum Sharpe Ratio portfolio is very effective for portfolios in new energy.
However, there are shortcomings in this paper. For example, weights are constant, in the actual investment activities, a time-varying portfolio may be more profitable, and deserves in-depth investigation.
References
[1]. Markowitz, H.: Portfolio Selection. The Journal of Finance 7(1), 77–91 (1952).
[2]. William F. S.: CAPITAL ASSET PRICES: A THEORY OF MARKET EQUILIBRIUM UNDER CONDITIONS OF RISK. The Journal of Finance 19(3), 425-442 (1964).
[3]. FAMA, E.F., FRENCH, K.R.: The Cross-Section of Expected Stock Returns. The Journal of Finance 47, 427-465 (1992).
[4]. Black, F., Litterman, R.: Global Portfolio Optimization. Financial Analysts Journal 48(5), 28-43 (1992).
[5]. Ben S. Bernanke.: Irreversibility, Uncertainty, and Cyclical Investment. The Quarterly Journal of Economics 98(1), 85-106 (1983).
[6]. Wang, Y.: Analysis of new energy industry development and financial support countermeasures in the context of low carbon economy - A review of Low carbon finance: a study on financing mechanism and innovation of renewable energy industry. International Economic Cooperation (02), 2 (2023).
[7]. Bian, Y.Z.: New energy sector becomes new driver of economic development. China Today 71(9), 52-52 (2022).
[8]. Zhang, C.X.: "New energy + technology innovation" may be the main line of investment in the fourth quarter. Wealth Times (11), 5 (2021).
[9]. Metropolis, N., Ulam, S.: The monte carlo method. Journal of the American Statistical Association 44(247), 335–341 (1949).
[10]. William F. Sharpe.: Mutual Fund Performance. The Journal of Business 39(1), 119-138 (1966).
Cite this article
Zhang,Z. (2023). Portfolio Optimization for New Energy Sector in the Chinese Capital Market. Advances in Economics, Management and Political Sciences,26,237-244.
Data availability
The datasets used and/or analyzed during the current study will be available from the authors upon reasonable request.
Disclaimer/Publisher's Note
The statements, opinions and data contained in all publications are solely those of the individual author(s) and contributor(s) and not of EWA Publishing and/or the editor(s). EWA Publishing and/or the editor(s) disclaim responsibility for any injury to people or property resulting from any ideas, methods, instructions or products referred to in the content.
About volume
Volume title: Proceedings of the 2023 International Conference on Management Research and Economic Development
© 2024 by the author(s). Licensee EWA Publishing, Oxford, UK. This article is an open access article distributed under the terms and
conditions of the Creative Commons Attribution (CC BY) license. Authors who
publish this series agree to the following terms:
1. Authors retain copyright and grant the series right of first publication with the work simultaneously licensed under a Creative Commons
Attribution License that allows others to share the work with an acknowledgment of the work's authorship and initial publication in this
series.
2. Authors are able to enter into separate, additional contractual arrangements for the non-exclusive distribution of the series's published
version of the work (e.g., post it to an institutional repository or publish it in a book), with an acknowledgment of its initial
publication in this series.
3. Authors are permitted and encouraged to post their work online (e.g., in institutional repositories or on their website) prior to and
during the submission process, as it can lead to productive exchanges, as well as earlier and greater citation of published work (See
Open access policy for details).
References
[1]. Markowitz, H.: Portfolio Selection. The Journal of Finance 7(1), 77–91 (1952).
[2]. William F. S.: CAPITAL ASSET PRICES: A THEORY OF MARKET EQUILIBRIUM UNDER CONDITIONS OF RISK. The Journal of Finance 19(3), 425-442 (1964).
[3]. FAMA, E.F., FRENCH, K.R.: The Cross-Section of Expected Stock Returns. The Journal of Finance 47, 427-465 (1992).
[4]. Black, F., Litterman, R.: Global Portfolio Optimization. Financial Analysts Journal 48(5), 28-43 (1992).
[5]. Ben S. Bernanke.: Irreversibility, Uncertainty, and Cyclical Investment. The Quarterly Journal of Economics 98(1), 85-106 (1983).
[6]. Wang, Y.: Analysis of new energy industry development and financial support countermeasures in the context of low carbon economy - A review of Low carbon finance: a study on financing mechanism and innovation of renewable energy industry. International Economic Cooperation (02), 2 (2023).
[7]. Bian, Y.Z.: New energy sector becomes new driver of economic development. China Today 71(9), 52-52 (2022).
[8]. Zhang, C.X.: "New energy + technology innovation" may be the main line of investment in the fourth quarter. Wealth Times (11), 5 (2021).
[9]. Metropolis, N., Ulam, S.: The monte carlo method. Journal of the American Statistical Association 44(247), 335–341 (1949).
[10]. William F. Sharpe.: Mutual Fund Performance. The Journal of Business 39(1), 119-138 (1966).


