


1.Introduction
For decades, housing has been one of the biggest livelihood issues in China. Shanghai's housing costs are comparatively high considering it is one of the top cities in China. Given the development of housing resource saturation in Shanghai's central metropolitan area, the improvement of the urban public transportation system, more balanced public services, continuous adjustment of industrial layout, and the relocation of permanent residents from the central urban area to the suburbs, the housing demand for new cities, large industrial parks in the suburbs, and large residential communities will increase, and the spatial pattern will be continuously optimized. More and more out-of-towners are also choosing to buy houses in different districts based on their condition. But many of them spent most of their time working and living in the rental house near their workplace. They are not as familiar with the detailed housing information as local Shanghainese do. House price prediction can help them make decisions about when to buy and what kind of property to buy by understanding future trends in house prices to best meet their needs while not unduly burdening their finances.
2.Related work
There are many researchers at home and abroad paying attention to housing price prediction. Han Li and Yehua Dennis Wei used a hedonic model, focused on public transportation options, amenities, structural characteristics, accessibility, and public and private service amenities, and examined apartment pricing patterns in specific areas in Shanghai and the relationships with neighborhood characteristics. [1]. Jiajun Lu used a baseline model and equations to compute the relationship between the view of the orientation of Residential properties and their value [2]. Zheng Peng, Qiang Huang, and Yincheng Han compared the accuracy of linear regression, decision tree model, and XGboost algorithm when predicting the second house price in Chengdu, and found that XGboost has the best performance and also prevents overfitting [3]. By using linear regression to forecast property prices in Mumbai, N. N. Ghosalkar and S. N. Dhage obtained the smallest prediction error of 0.3713. [4]. Random forest algorithm has been used in many classification tasks, like Breast Cancer Classification [5]. Bola Adetunji and Oluwatobi Noah Akande also used a random forest algorithm and detailed house information to predict the Boston housing price [6]. So, in this paper, the prediction of Shanghai housing prices is based on a random forest algorithm, using data with basic housing characteristics, and see if the accuracy of the prediction can be satisfactory.
3.Random Forest Theory
A well-liked supervised classification and regression machine learning technique is Random Forest. Random forest is an integrated learning decision trees-based method [7]. To increase the model's precision, stability, and generalizability, numerous decision trees are constructed and their outputs are integrated. A decision tree is a tree structure that divides data according to characteristics, and each leaf node stands for a class or value. The decision tree divides the data into different subsets through a series of feature judgment conditions, and each subset corresponds to a leaf node.
Random Forest improves the diversity of the model by introducing two kinds of randomness:
Random sampling: When constructing each decision tree, randomly select a part of the samples from the training data with replacement as the training set for constructing trees. This makes sure that each decision tree's training data set is a distinct subset of the data.
Random feature selection: Instead of considering all features, a random selection of features is made from all features at each split of a node. This ensures that each tree split is based on a different subset of features.
Random forests make predictions by combining the results of multiple decision trees. For classification problems, a voting method can be used to select the category predicted by the majority decision tree. For regression problems, the average of the majority decision tree predictions can be taken.
The process of random forest [8] is shown in figure1:
1. Create a random subset by randomly choosing a portion of the training set's samples and replacing them.
2. Randomly select a part of features from all features as candidate features for the current decision tree split.
3. Based on the sampled data and randomly selected features, a decision tree is constructed, which is usually split recursively until a specific condition (such as maximum depth, number of leaf node samples, etc.) is reached.
4. Repeat steps 1-3: Repeat the above steps to build multiple different decision trees.
5. For classification problems, the classification results of multiple decision trees are voted, and the category with the most votes is chosen as the outcome of the final projection. For regression problems, the predictions of multiple decision trees are averaged.
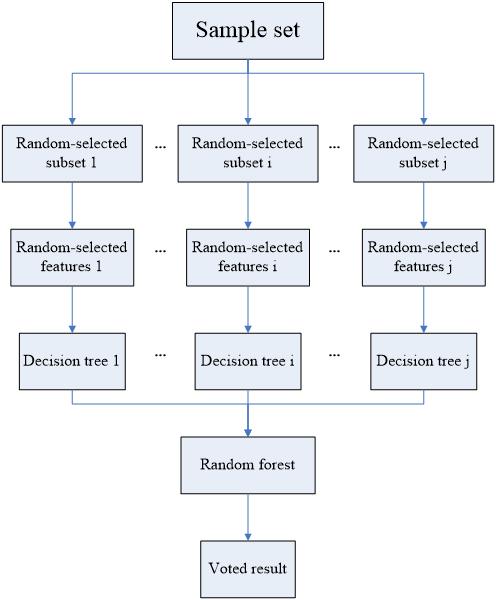
Figure 1: The process of random forest
4.Experiment
4.1.Data collection
Nowadays, data about house prices in Shanghai can be obtained in many different ways. But many of them just give an overall price of the housing estate with different features. Structured and categorized data are needed to help learn the relationship between the features of houses and the price of houses. The project collects the data from Lianjia which is a rental website that provides real second-hand prices in the past. It can ensure the validity of the data and guarantee the feasibility of our further analysis.
4.2.Numbering
At first, the dataset has 10,000 data, each of which has 19 variables. However, some variables are missing nearly half of their data. For example, the variable ‘inside space’ only has 673 valid data. So, these kinds of variables are removed from the dataset. Every observation with missing values is also removed. What’s more, the attribute ‘housing type’ is also split into attributes ‘bedrooms’ and ‘living rooms.’ All of the character data are converted to numeric features. Administrative districts are converted to numbers from 0 to 16, which are ordered by the average housing price in every district, and the renovation conditions are converted to numbers ordered by the condition of houses’ renovation. House orientation is also converted to numeric features based on the conclusion of Jiajun Lu [2]. Finally, the cleaned dataset has 5960 data. Table 1 shows the description of the dataset.
Table 1: Cleaned data description
|
mean |
std |
min |
50% |
max |
|
|
price |
56933.45 |
21688.96 |
11183 |
54014 |
178123 |
|
bedroom |
2.118456 |
0.841965 |
1 |
2 |
8 |
|
living room |
1.408054 |
0.616604 |
0 |
1 |
4 |
|
floor |
1.124832 |
0.81531 |
0 |
1 |
2 |
|
construction area |
85.50447 |
44.1665 |
23.3 |
76.775 |
595 |
|
building type |
0.086242 |
0.280744 |
0 |
0 |
1 |
|
house orientation |
1.99329 |
0.294328 |
0 |
2 |
4 |
|
renovation condition |
1.483389 |
0.642297 |
0 |
2 |
2 |
|
lifts |
0.64245 |
0.890088 |
0 |
0 |
5 |
|
residents every floor |
3.665604 |
3.031262 |
1 |
3 |
52 |
|
have lift |
0.401846 |
0.490312 |
0 |
0 |
1 |
|
built time |
1998.707 |
9.84235 |
1911 |
1998 |
2016 |
|
administrative district |
7.274832 |
3.314368 |
0 |
8 |
16 |
4.3.Training model
In this project, random forest algorithms are used to build the model. The random forest was produced using the Random Forest Classifier from the Phyton Scikit-learn (sklearn) [9] machine learning toolbox. The training set is utilized to generate each decision tree, which is then used to train the model before integrating the random forest. There is usually a series of hyperparameters involved that impact the model's performance and the training process. Attention should be paid to avoid "overfitting" for the training sample, that is, the characteristics of the training sample are described "too accurately" to enable a reasonable analysis of the new sample. To select the ideal set of hyperparameters, the project uses grid search [10] and cross-validation [11] to solve the problem.
Cross-validation evaluates model performance multiple times, each time on a different subset of data. This helps to detect the performance fluctuation of the model under different data distributions and avoid the dependence on a single validation set, thus reducing the influence of validation set selection on model performance evaluation. Cross-validation can provide more accurate performance estimates, avoiding situations where a model performs well on a particular validation set but poorly on data it has not seen.
Cross-validation evaluates the model's performance multiple times over different combinations of hyperparameters to determine which hyperparameters perform best under different circumstances. This can help select hyperparameters that perform well on different data subsets, rather than just adapting to a particular data distribution.
By combining grid search and cross-validation, we can more comprehensively tune the model and thus better control the overfitting problem. This approach not only helps to achieve better performance on the training set but also enables the model to generalize better to previously unseen data, thereby reducing the risk of overfitting. While training the model, we can have a clear idea about the importance of every feature. The outcomes are displayed in Figure 2.
In this paper, a decision tree model is also trained in the same way to make the comparison. The best hyperparameters are shown in Table 2.
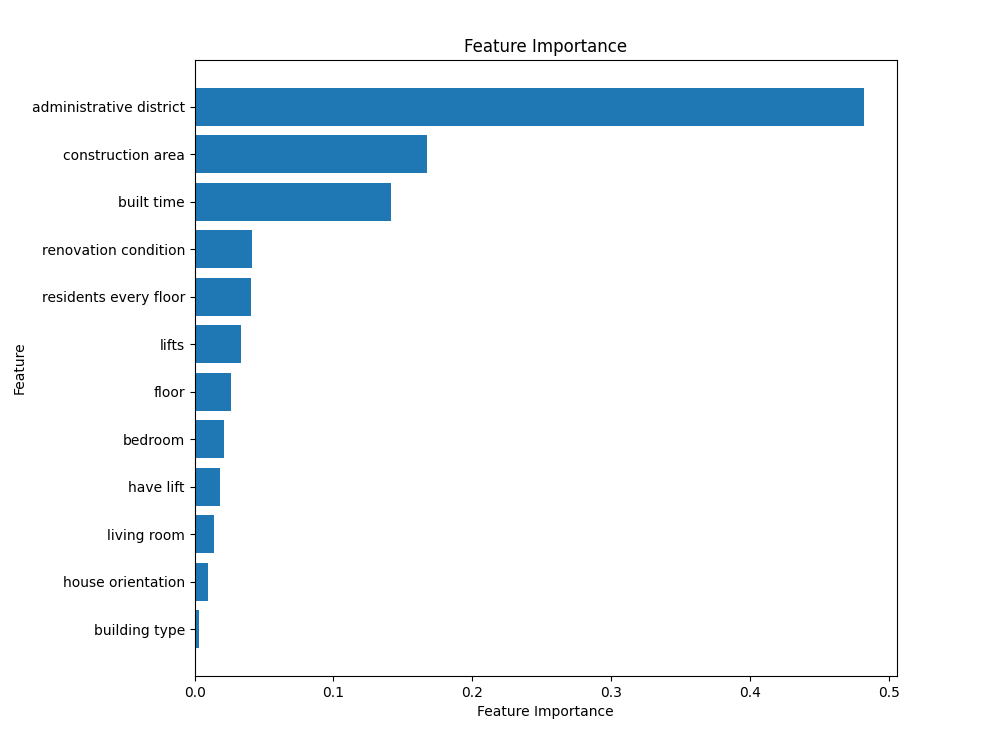
Figure 2: Feature importance histogram
Table 2: Best performed hyperparameters
|
n_estimators |
max_depth |
|
|
random forest |
100 |
10 |
|
decision tree |
\ |
10 |
4.4.Validating model
Then we use the model we trained to test by using the test dataset and evaluate our prediction accuracy. In this paper, score, and MAE are chosen as indexes to judge the performance. The formula of MAE is shown below.
\( MAE=|\frac{\sum _{i=1}^{n}{y_{i}}-{x_{i}}}{n}| \)(1)
When the same input parameters are provided to the model, the test contrasts the outputs of the system being tested with the model's outputs. The model's output values are saved in records. The result of predictions made by random forest model and decision trees models are shown in Table 3 and Figure 3,4.
Table 3: Score and MAE of the prediction
|
score |
MAE |
|
|
random forest |
0.633660287 |
9416.847 |
|
decision tree |
0.496240231 |
10552.071 |
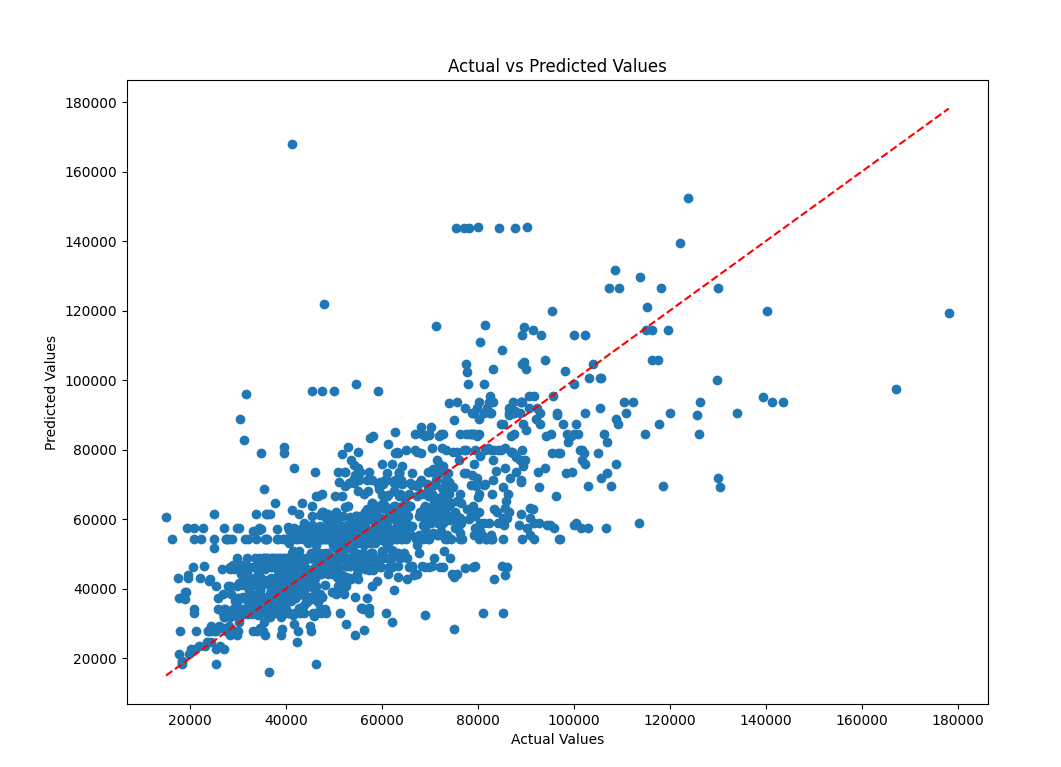
Figure 3: Actual price vs. Predicted price of Decision tree model
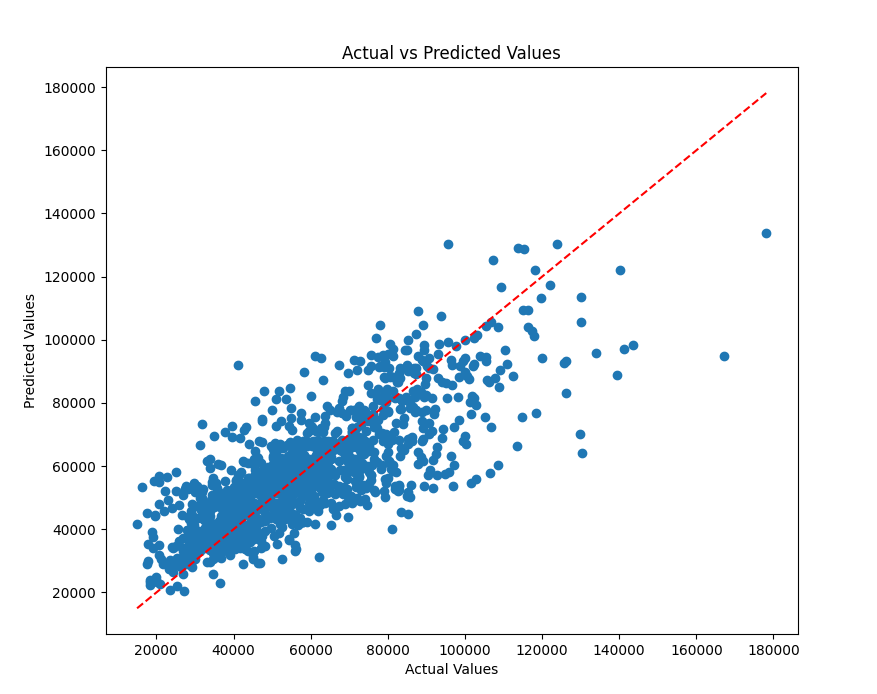
Figure 4: Actual price vs. Predicted price of random forest model
5.Conclusion
In this paper, using a dataset of fundamental housing features, the random forest approach in machine learning is applied to model and predict Shanghai home values. Cross-validation is used to avoid over-fitting problems to a certain extent. In order to assess how effective the random forest is, the component called the decision tree algorithm is used. Through the splitting points and the MAE, it is evident that the random forest performs superior in this prediction task. However, the value of MAE is still very large, which means that with only some essential housing characteristics, it’s hard to make precise predictions of housing prices. What’s more, the paper found that among the features the paper chooses, the administrative district is the most crucial feature affecting housing prices.
References
[1]. Han Li, Yehua Dennis Wei, Yangyi Wu and Guang Tian 2019 Analyzing housing prices in Shanghai with open data: Amenity, accessibility, and urban structure Cities vol 91 P165-179
[2]. Jiajun Lu 2018 The value of a south-facing orientation: A hedonic pricing analysis of the Shanghai housing market Habitat International Vol 81 P24-32
[3]. Z. Peng, Q. Huang, and Y. Han 2019 Model Research on Forecast of Second-Hand House Price in Chengdu Based on XGboost Algorithm 2019 IEEE 11th International Conference on Advanced Infocomm Technology (ICAIT) P168-172
[4]. N. N. Ghosalkar and S. N. Dhage 2018 Real Estate Value Prediction Using Linear Regression 2018 Fourth International Conference on Computing Communication Control and Automation (ICCUBEA) P1-5
[5]. Buttan Y., Chaudhary A. and Saxena K. 2021 An Improved Model for Breast Cancer Classification Using Random Forest with Grid Search Method. In: Goyal, D., Chaturvedi, P., Nagar, A.K., Purohit, S. (eds) Proceedings of Second International Conference on Smart Energy and Communication. Algorithms for Intelligent Systems Springer
[6]. Abigail Bola Adetunji, Oluwatobi Noah Akande, Funmilola Alaba Ajala, Ololade Oyewo, Yetunde Faith Akande and Gbenle Oluwadara 2022 House Price Prediction using Random Forest Machine Learning Technique Procedia Computer Science Vol 199 P806-813
[7]. Kingsford C. and Salzberg S. 2008 What are decision trees Nat Biotechnol 26, 1011–1013 (2008).
[8]. Y. Liu and H. Wu 2017 Prediction of Road Traffic Congestion Based on Random Forest 2017 10th International Symposium on Computational Intelligence and Design (ISCID) P361-364
[9]. Raschka S. and Mirjalili V. 2017 Python machine learning: Machine learning and deep learning with Python, scikit-learn, and TensorFlow 2nd ed. Birmingham: Packt Publishing
[10]. Liashchynskyi P and Liashchynskyi P. 2019 Grid search, random search, genetic algorithm: a big comparison for NAS[J]. arXiv preprint arXiv:1912.06059
[11]. Daniel Berrar 2019 Cross-Validation, Shoba Ranganathan, Michael Gribskov, Kenta Nakai, Christian Schönbach, Encyclopedia of Bioinformatics and Computational Biology Academic Press P542-545
Cite this article
Wu,S. (2024). Shanghai House Price Prediction Using Random Forest. Advances in Economics, Management and Political Sciences,66,224-230.
Data availability
The datasets used and/or analyzed during the current study will be available from the authors upon reasonable request.
Disclaimer/Publisher's Note
The statements, opinions and data contained in all publications are solely those of the individual author(s) and contributor(s) and not of EWA Publishing and/or the editor(s). EWA Publishing and/or the editor(s) disclaim responsibility for any injury to people or property resulting from any ideas, methods, instructions or products referred to in the content.
About volume
Volume title: Proceedings of the 3rd International Conference on Business and Policy Studies
© 2024 by the author(s). Licensee EWA Publishing, Oxford, UK. This article is an open access article distributed under the terms and
conditions of the Creative Commons Attribution (CC BY) license. Authors who
publish this series agree to the following terms:
1. Authors retain copyright and grant the series right of first publication with the work simultaneously licensed under a Creative Commons
Attribution License that allows others to share the work with an acknowledgment of the work's authorship and initial publication in this
series.
2. Authors are able to enter into separate, additional contractual arrangements for the non-exclusive distribution of the series's published
version of the work (e.g., post it to an institutional repository or publish it in a book), with an acknowledgment of its initial
publication in this series.
3. Authors are permitted and encouraged to post their work online (e.g., in institutional repositories or on their website) prior to and
during the submission process, as it can lead to productive exchanges, as well as earlier and greater citation of published work (See
Open access policy for details).
References
[1]. Han Li, Yehua Dennis Wei, Yangyi Wu and Guang Tian 2019 Analyzing housing prices in Shanghai with open data: Amenity, accessibility, and urban structure Cities vol 91 P165-179
[2]. Jiajun Lu 2018 The value of a south-facing orientation: A hedonic pricing analysis of the Shanghai housing market Habitat International Vol 81 P24-32
[3]. Z. Peng, Q. Huang, and Y. Han 2019 Model Research on Forecast of Second-Hand House Price in Chengdu Based on XGboost Algorithm 2019 IEEE 11th International Conference on Advanced Infocomm Technology (ICAIT) P168-172
[4]. N. N. Ghosalkar and S. N. Dhage 2018 Real Estate Value Prediction Using Linear Regression 2018 Fourth International Conference on Computing Communication Control and Automation (ICCUBEA) P1-5
[5]. Buttan Y., Chaudhary A. and Saxena K. 2021 An Improved Model for Breast Cancer Classification Using Random Forest with Grid Search Method. In: Goyal, D., Chaturvedi, P., Nagar, A.K., Purohit, S. (eds) Proceedings of Second International Conference on Smart Energy and Communication. Algorithms for Intelligent Systems Springer
[6]. Abigail Bola Adetunji, Oluwatobi Noah Akande, Funmilola Alaba Ajala, Ololade Oyewo, Yetunde Faith Akande and Gbenle Oluwadara 2022 House Price Prediction using Random Forest Machine Learning Technique Procedia Computer Science Vol 199 P806-813
[7]. Kingsford C. and Salzberg S. 2008 What are decision trees Nat Biotechnol 26, 1011–1013 (2008).
[8]. Y. Liu and H. Wu 2017 Prediction of Road Traffic Congestion Based on Random Forest 2017 10th International Symposium on Computational Intelligence and Design (ISCID) P361-364
[9]. Raschka S. and Mirjalili V. 2017 Python machine learning: Machine learning and deep learning with Python, scikit-learn, and TensorFlow 2nd ed. Birmingham: Packt Publishing
[10]. Liashchynskyi P and Liashchynskyi P. 2019 Grid search, random search, genetic algorithm: a big comparison for NAS[J]. arXiv preprint arXiv:1912.06059
[11]. Daniel Berrar 2019 Cross-Validation, Shoba Ranganathan, Michael Gribskov, Kenta Nakai, Christian Schönbach, Encyclopedia of Bioinformatics and Computational Biology Academic Press P542-545