


1. Introduction
Lung cancer is the most common cancer and one of the main causes of cancer-related deaths worldwide. According to GLOBOCAN 2020, there are an estimated 2.2 million new lung cancer cases (11.4%) and nearly 1.8 million lung cancer deaths (18.0%) in 2020. China had the highest number of lung cancer cases and mortality rates (37.0% and 39.8%, respectively) in 2020, posing a serious threat to the public health [1]. Thus, it shows that lung cancer should not be overlooked and the pathogenesis and treatment of lung cancer is an urgent problem in the medical field that needs to be researched thoroughly. The occurrence of lung cancer is caused by the activation of oncogenes or the inactivation of tumor suppressor genes, which leads to uncontrolled replication and growth of lung cells. Tumors can disrupt the normal structure of lung tissue, block nutrient or oxygen supply, and affect normal lung function. The two most common causes are specific genetic mutations and environmental carcinogens. Tobacco is the most common risk factor for cancer. More than 4000 chemical substances have been found in tobacco, including at least 69 known carcinogens and other toxic substances related to serious diseases [2].
At present, the most direct treatment method for lung cancer is surgical resection of the cancer tumor. In the early stages, complete resection of lung tumors is possible. When lung cancer progresses to the advanced stage, when the tumor is too large or has already spread, it is difficult to completely remove the tumor tissue through surgery, which also limits the possibility of some patients undergoing surgery. Chemotherapy and radiation therapy are auxiliary treatment methods for cancer, which can be used to reduce tumor size before surgery. However, the side effects of chemotherapy and radiation therapy are very significant, not only causing significant physical harm to patients, but also causing harm to their mental health, seriously affecting their quality of life. Targeted therapy is a type of cancer treatment that targets proteins that control the growth, division, and spread of cancer cells. It is the foundation of precision medicine. It helps the immune system destroy cancer cells, cut off signals that help form blood vessels, and ultimately kill cancer cells. This therapy is widely used because it can accurately destroy cancer cells with relatively less obvious side effects. As long as the patient has a good target, targeted treatment will be very effective. Thus, this article aims to analyze the targets of cancer patients through multi-omics approach, to seek more possibilities to develop more effective targeted drugs to treat lung cancer.
In order to shed light on the development of targeted medications to lung cancer, scientists first are required to obtain a deeper understanding of the relationships between multiple aspects and features of the lung adenocarcinoma cells so that drugs targeting the specific signal transduction pathway, protein expression or metabolites could be established. In order to obtain a more comprehensive understanding of the correlation between multiple disease-associated features and molecular levels, multi-omics analysis integrates the genomic, epigenomic, transcriptomic, proteomic, and metabolomic data from diseased individuals and is capable of comparing the different changes in levels of each identified molecules with the assist of charts and graphs by information technologies, ultimately proposing potential biomarker. Furthermore, it offers a theoretical basis for researching and developing target drugs.
Various multi-omics approaches had previously been done to lung cancer treatments in recent years. Back as soon as in 2020, Asada et al. integrated RNA and miRNA expressions, compared 25 cancer related genes and filtered out 6 potential genes influencing that survival rates of patients [3] combined data of DNA methylation, RNA, miRNA, and DNA copy number and determined in total of six cancer subtypes and their corresponding survival rate related genes on the chromosome [4]. Subsequently, specific oncogene NUF2 and regulators of radiotherapy resistance such as GALNT2 are discovered in 2021, 2023 respectively [5, 6]. As a new technology integrating etiology with data science, researches on lung adenocarcinoma and its related targets remained superficial and incomprehensive.
Despite its various advantages, drawbacks of multi-omics approaches remained significant. To begin with, due to the differences in size, format and resolution among multiple data sets, multi-omics data are often hard to integrate for analysis. Moreover, due to differences in experimental procedures and equipment, multi-omics data sets are often scarce and incomplete. In addition, analysis and comparation between multi-omics data sets may generate confounding results leading to undecipherable correlations which decreases the reliability of the results, this need to be carefully analyzed be experts with prevalent data sets. Finally, multi-omics data usually involves patients’ private information, which may raise concerns about its privacy protection [7]. For example, omics data may reveal genetic information, cancer variants or treatment biomarkers related to diseases or characteristics that are private to patients. Therefore, it is important to no violate any personal privacy and ethical concerns while dealing with multi-omics data sets.
As a result, we integrated existing lung adenocarcinoma multi-omics data sets and analyzed the correlation in the new method, seeking to provide valuable insights to targeted drug development and clinical medications to lung adenocarcinoma.
2. Method
Firstly, we downloaded our lung adenocarcinoma related multi-omics data sets from CBioPortal and extracted mRNA and RPPA related data for further analysis. We analyzed the intersection of the two data sets using Boolean logic and filtered their co-expressed targets. Then, we calculated the difference in expression of the target genes, sorted the 10 genes with highest increased and decreased expression, respectively, and speculated treatment targets for the progression of lung adenocarcinoma.
2.1. Read
By using “read_csv” method in “pandas” pack, a data file with dataframe structure is read. Input “data_rppa_zscores.txt” and “data_mrna_seq_v2_rsem_zscores_ref_all_samples.txt” to the dataframe, then use “head” methodology to read the first five lines in order to examine if all datas are read correctly.
2.2. Examination
The examination of the presence of “TGCA-44-2657-01” in two dataframes is done at the start by using the following code, since the intersection of data column “TGCA-44-2657-01” need to be obtained afterwards.
data_rppa_columns[1] in data_rna.columns
A variable of Boolean type is returned, and the variables of this type can only be “true” or “false”. If the above code returns “true”, it means that there is a column named “TCGA-44-2657-01” in both data boxes, then the data can continue to be analyzed. Otherwise the analysis terminates
2.3. Intersection
The following code is used to obtain common elements (intersections) of this data column after conforming the existence of the common column.
common_data = np.intersectid(data_rppa[‘TCGA-44-2657-01’],data_rna[‘tcga-44-2657-01’])
2.4. Filtration
Moreover, only obtaining common elements are not enough, the name of genes corresponding to these common elements need to be excavated as well. Therefore, filtration is done by inputting these common elements back to the original dataframe by the following codes.
rppa_filter_condition = data_rppa[‘TCGA-44-2657-01’].isin(common_data)
rppa_wanted_cols = [‘ Composite. ELement. REF*, ‘TCGA-44-2657-01*]
rppa_data_after_filter =
data_rppa. LocLrppa_ Fil ter_condition, rppa_wanted_colsJ- sort-valuesC” TCGA- 44-2657-
011)
Especially, “rppa_filter_condition = data_rppa[‘TCGA-44-2657-01’].isin(common_data)”is used as a condition for filtration. If a row of data_rppa dataframe, which is a gene sample, has its “TCGA-44-2657-01” data present in common_data, then this row will be labelled as “true”. Therefore, “rppa_filter_condition” and “data_rppa” will obtain the same Boolean type classified by the same row number. This Boolean type will be used as filter condition to filtrate the data of “data_rppa”, then the corresponding gene names are obtained.
The “rna_data” dataframe is opperated like this as well.
following code is used to obtain common elements (intersections) of this data column after conforming the existence of the common column.
2.5. Output
From the filtering step above, we not only acquired the name of the genes from the intersection of two data groups, but also used “sort_values” to arrange them in order, and chose the only top ten and bottom ten data values using the following code:
rppa_index =np.concatenate([np.arange(10),np.arange(len(rppa_data_after_filter)-10,len(rppa_ data_after_filter))])
rppa_result = rppa_data_after_filter.iloc[rppa_index,:]
In the table, “rppa_result” represented the final result for RPPA data, and it is the same method for RNA data. After we obtained the first and last ten rows from the table, what we got is still to data sets, we still need to merge the tables to become a single table. As we have a common column of “TCGA-44-2657-01”, we are able to merge two tables base on this common key using internal combination using the following code:
final_ret = pd.merge(rna_result,rppa_result,on=‘TCGA-44-2657-01’)
final_ret.to_csv(“merged_data.csv”)
And the following code is used to rewrite the final result in a .csv file
final_ret.to_csv(“merged_data.csv”).
2.6. Integration
The previous five steps generates a result for only one person; however, we need to integrate more data to obtain a more accurate and comprehensive result.
First, we need to identify all patients both present in the RPPA and the mRNA set but the following code.
common_cols = np.intersect1d(data_rppa.columns,data_rna.columns)
Then, we perform the following code to merge the RPPA and mRNA data for each patients and download their data individually to obtain a csv document, or table, for each of the 181 patients. The logic of the program is identical to what was explained previously in the five steps.
def data_reshape(col,cnt):
common_data = np.intersect1d(data_rppa[col],data_rna[col])
print(str(cnt),”:”,col,str(common_data.shape[0]))
rppa_filter_condition = data_rppa[col].isin(common_data)
rppa_wanted_cols = [‘Composite.Element.REF’,col]
rppa_data_after_filter = data_rppa.loc[rppa_filter_condition,rppa_wanted_cols].sort_values(col)
rppa_index = np.concatenate([np.arange(10),np.arange(len(rppa_data_after_filter)-10,len(rppa_data_after_filter))])
rppa_result = rppa_data_after_filter.iloc[rppa_index,:]
rna_filter_condition = data_rna[col].isin(common_data)
rna_wanted_cols = [‘Hugo_Symbol’,’Entrez_Gene_Id’,col]
rna_data_after_filter = data_rna.loc[rna_filter_condition,rna_wanted_cols].sort_values(col)
rna_index = np.concatenate([np.arange(10),np.arange(len(rna_data_after_filter)-10,len(rna_data_after_filter))])
rna_result = rna_data_after_filter.iloc[rna_index,:]
final_ret = pd.merge(rna_result,rppa_result,on=col)
final_ret.to_csv(col+”.csv”)
print(col+’.csv’+’ download’)
for i,col in enumerate(common_cols):
data_reshape(col,i+1)
We define a function “data_reshape” that takes two arguments: “col” and “cnt”. The parameter “col” is a string indicating the name of the column to be processed, and “cnt” is an integer indicating the position of the currently processed column in the common_cols list.
The main operation of the function is as follows. First, we find the intersection of the two datasets with the “np.intersectld” function and store the result in the “common_data” variable. Then we printed the names of the columns currently being processed, the number of intersections, and the names of the columns. Next, we created some variables for storing the filtered RPPA and RNA data and the names of the columns to be retained.
After, we filtered the RPPA data that satisfies the condition by “data_rppa[col].isin(common_data)” and stored the result in the rppa_filter_condition variable; we selected the desired columns from data_rppa based on the filter condition and stored the result in the “rppa_wanted_cols” variable.
Later, we sorted the filtered RPPA data, stored the result in the “rppa_data_after_filter” variable, calculated the index to be retained and stored the result in the “rppa_index” variable. Finally, we selected data from the “rppa_data_after_filter” based on the index and stored the result in the rppa_result variable.
Similarly, we filtered, sorted, and performed selected operations on the RNA data and the results are stored in the rna_result variable. And now we have acquired the data from both data and we need to combine them effectively to show the results more intuitively.
We used the “pd.merge” function to merge the RPPA and RNA data, stored the results in the final_ret variable, saved the merged data as a CSV file and printed out the file name.
Finally, the code iterates through each column in the common_cols list with a loop and passes each column to the data_reshape function for processing.
The code above generated, in total, 181 csv documents for us, and we are going to carry out four procedures to visualize our data: arranging the z-scores for each patient, filtering out the 10 highest and lowest z-score values, counting which gene is most appeared for the all patients, and finally calculating the z-score average.
os.chdir(‘./CSV’)
min_list = np.array([])
max_list = np.array([])
for f in os.listdir():
if not f.startswith(‘.’):
csv = pd.read_csv(f)
min_list = np.concatenate([min_list,csv[‘Hugo_Symbol’][:10].values])
max_list = np.concatenate([max_list,csv[‘Hugo_Symbol’][10:].values])
majority_min = pd.Series(min_list).value_counts()[:10]
majority_min
majority_max = pd.Series(max_list).value_counts()[:10]
majority_max
This code gets all the CSV files in the current directory and reads them as DataFrame objects. Then, for each CSV file, it extracts the first 10 values and the last 10 values of the gene symbol (Hugo_Symbol) column in it and adds them to the min_list and max_list arrays respectively.
Specifically, the code first creates two empty arrays “min_list” and “max_list”, and then uses the “os.listdir()” function to get all the files in the current directory. For each file, if it does not start with “.” it means that it is a CSV file and can be read as a DataFrame object using “pd.read_csv(f)”.
Next, the code uses “csv[‘Hugo_Symbol’][:10].values” to extract the first 10 values of the gene symbol column in each CSV file and adds them to the min_list array using the “np.concatenate()” function. Similarly, the code uses “csv[ ‘Hugo_Symbol’][10:].values” to extract the last 10 values of the gene symbol column in each CSU file and adds them to the max_list array using the “np.concatenate()” function.
Finally, the code prints out the min_list and max_list arrays separately in order to view their contents.
Table1. Most appeared genes with minimum z scores
Hugo_Symbol | Appearances |
CASP14 | 4 |
GMPPA | 3 |
SLC1A5 | 3 |
LMOD2 | 3 |
ATCAY | 3 |
BARHL2 | 3 |
KLK15 | 3 |
TEX13A | 3 |
IL20RB | 3 |
NXF5 | 3 |
Table 2. Most appeared genes with minimum z scores
Hugo_Symbol | Appearances |
RPL37 | 3 |
NT5E | 3 |
NPRL3 | 3 |
ZNF10 | 3 |
PAPOLG | 2 |
WDR77 | 2 |
HIF1AN | 2 |
UQCRFS1 | 2 |
DNTTIP1 | 2 |
IFNAR2 | 2 |
We then calculated the average z-score values for the expression of the genes above using the following code.
min_mean_list = []
for f in os.listdir():
if not f.startswith(‘.’):
csv = pd.read_csv(f)
csv = csv.iloc[:10,:]
temp_mean_list = []
for col in majority_min.index:
if col in csv[‘Hugo_Symbol’].values:
temp_df = csv[csv[‘Hugo_Symbol’] == col]
# print(temp_df)
mean_value = temp_df[f.split(‘.’)[0]].mean()
temp_mean_list.append(mean_value)
else:
temp_mean_list.append(0)
min_mean_list.append(temp_mean_list)
min_mean_arr = np.array(min_mean_list)
min_ret = min_mean_arr.mean(axis=0)
We then carried out the same procedures for genes that appeared the most in the table.
max_mean_list = []
for f in os.listdir():
if not f.startswith(‘.’):
csv = pd.read_csv(f)
csv = csv.iloc[10:,:]
temp_mean_list = []
for col in majority_max.index:
if col in csv[‘Hugo_Symbol’].values:
temp_df = csv[csv[‘Hugo_Symbol’] == col]
# print(temp_df)
mean_value = temp_df[f.split(‘.’)[0]].mean()
temp_mean_list.append(mean_value)
else:
temp_mean_list.append(0)
max_mean_list.append(temp_mean_list)
max_mean_arr = np.array(max_mean_list)
max_ret = max_mean_arr.mean(axis=0)
min_df = pd.DataFrame({‘Hugo_Symbol’:majority_min.index,’value’:min_ret})
min_df.to_csv(‘min_ret.csv’)
max_df = pd.DataFrame({‘Hugo_Symbol’:majority_max.index,’value’:max_ret})
max_df.to_csv(‘max_ret.csv’)
The main purpose of this code is to read all the CSV files in the current directory and calculate the average value of each gene for each file.
The code first creates two lists, “min_mean_list” and “temp_mean_list”, and then uses the “os.listdir()” function to get all the files in the current directory. For each file, if it does not start with “.” it means that it is a CSV file, and you can use “pd.read_csv(f)” to read it as a DataFrame object.
Next, the code uses “csv.iloc[:10,:]” to extract the first 10 rows of data from each CSV file and stores the result in a CSV variable.
The code then creates an empty “temp_mean_list” list for storing the mean values for each gene. For each element in the “majority_min” index (i.e., each gene), perform the following.
If the gene is in the Hugo_Symbo1 column of the CSV, extract the row containing the gene from the CSV and store the result in the temp_df variable.
Use “temp_df[f.split(‘.’)[0]].mean()” to calculate the mean value for that gene in that file and add the result to “temp_mean_list”.
If the gene is not in the “Hugo_Symbo1” column of the CSV, add 0 to “temp_mean_list”.
Finally, the code adds the temp_mean_list to the “min_mean_list” and prints out “min_mean_list” to see its contents.
We then carried out the same procedures for genes that appeared the most in the table, and the result of the final table is presented in the results section as Fig.
3. Result
To begin our analysis, we downloaded our multi-omics data sets of patients diagnosed with lung adenocarcinoma from CBioPortal by searching “tcga luad”, in which TCGA stands for “The Cancer Genome Atlas Program” and LUAD stands for “Lung Adenocarcinoma”. Then, we selected mRNA and RPPA related data for further analysis using python. Firstly, we modelled the expression of mRNA strands and proteins in two normal distribution, and calculated z-scores for the expression levels for each gene in each patient. As there is a direct link between transcription and translation, if a mRNA strand is synthesised, the corresponding protein is also very likely to be synthesized. Furthermore, mRNA and protein expression levels with the same z-score after standardisation also represent a likely correlation their probability of expression are the same. As a result, we analysed the intersection of the two data sets using Boolean logic to find, if any, genes of which mRNA and protein expression converges. Then, we ranked the difference in z-score of the target genes and sorted the 10 genes with highest increased and decreased expression, respectively, and speculated treatment targets for the progression of lung adenocarcinoma. The flow chart of the analysis is listed below.
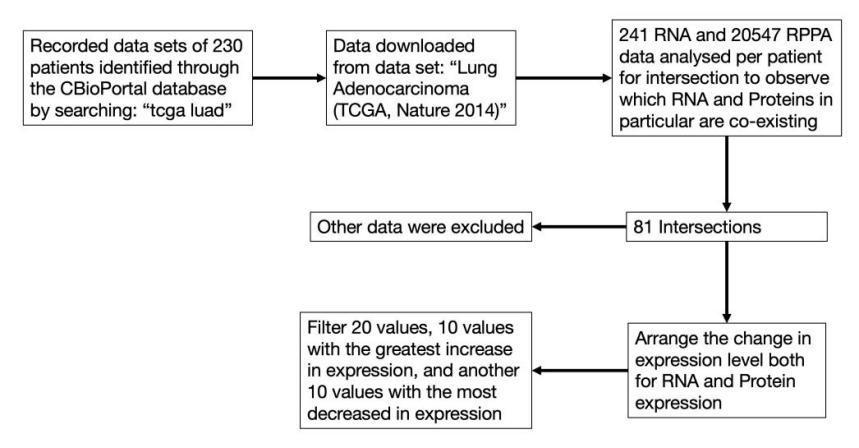
Figure 1. Multi-omics analysis flow chart.
The results of the analysis are listed as follow.
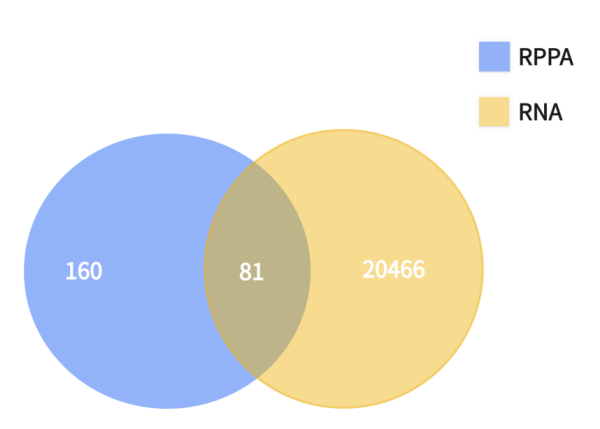
Figure 2. Intersection results of proteome and transcriptome.
In total, 81 genes were found to exist having the same z-score level of mRNA and protein expression, meaning that there is a significant correlation between each of the paired groups as they have same probability of existence in the human body. After the combination of results, we are able to filtered out the other irrelevant genes, and rank the target genes as follow according to their z-score value as follow.
Table 3. List of differentially expressed genes.
Hugo_Symbol | Entrez_Gene_Id | TCGA-44-2657-01 | |
20422 | ZP4 | 57829 | -1.3531 |
4818 | DEFB4A | 1673 | -1.2587 |
8567 | IRS2 | 8660 | -0.9179 |
11110 | MRPL33 | 9553 | -0.7430 |
13083 | PDE12 | 201626 | -0.6891 |
725 | SOWAHC | 65124 | -0.6717 |
4461 | CXCL5 | 6374 | -0.6639 |
1115 | ASPG | 374569 | -0.6428 |
6542 | FMR1NB | 158521 | -0.6401 |
3688 | CHMP2A | 27243 | -0.5369 |
5334 | ECM2 | 1842 | 0.8386 |
12884 | PARD6A | 50855 | 0.8798 |
2568 | ADGB | 79747 | 0.8917 |
531 | ALDH1L1 | 10840 | 0.9030 |
11812 | NHSL2 | 340527 | 0.9191 |
12861 | PAPD7 | 11044 | 0.9876 |
16152 | SLC25A33 | 84275 | 0.9881 |
17599 | TARP | 445347 | 1.0511 |
20332 | ZNF767 | 79970 | 1.3384 |
13948 | PRCD | 768206 | 1.9639 |
The z-score value of the expression in each protein in the patient above indicates the probability of gene expression. The z-score value is calculated by the observed value of expression deducting the mean expression value then divided by the standard deviation of the value when the data of gene expression is modeled into a normal distribution.
In order to obtain more knowledge about the targets, we first searched and filtered existing targets suggested by other experts in the area via PubMed and found that IRS2 was suggested in 2022 by H. Peng et al as a direct symbol of tumorigenesis. The analysis, however, is nowhere near complete. We then calculated the average of each z-score value according to the name of the gene for over 200 patients and generalized a table of genes each with the most increased and decreased expression, and the table is listed below.
Table 4. Highest 10 average z-scores of the 200 patients
Rank | Hugo_Symbol | Value |
1 | RPL37 | 0.0202232044198895 |
2 | NT5E | 0.01805414364640884 |
3 | NPRL3 | 0.018520994475138122 |
4 | ZNF10 | 0.016159668508287293 |
5 | PAPOLG | 0.013338674033149171 |
6 | WDR77 | 0.012006629834254144 |
7 | HIF1AN | 0.007766850828729283 |
8 | UQCRFS1 | 0.013050276243093921 |
9 | DNTTIP1 | 0.015307734806629836 |
10 | IFNAR2 | 0.009991160220994475 |
Table 5. Lowest 10 average z-scores of the 200 patients
Rank | Hugo_Symbol | Value |
1 | CASP14 | -0.025752486187845303 |
2 | GMPPA | -0.017875138121546962 |
3 | SLC1A5 | -0.016581215469613258 |
4 | LMOD2 | -0.017814364640883977 |
5 | ATCAY | -0.018302209944751385 |
6 | BARHL2 | -0.01981160220994475 |
7 | KLK15 | -0.02165966850828729 |
8 | TEX13A | -0.01472817679558011 |
9 | IL20RB | -0.013792817679558011 |
10 | NXF5 | -0.018898342541436467 |
In a detailed search and examination of the functions of the 20 genes, we found 3 genes in total directly contributing to lung adenocarcinoma. Beginning with RPL37 which is ranked number 1 in the expression table above. The next genes is WDR77, ranking number 6 among the most expressed proteins, and it is found to proliferate the cells by letting then to reenter the cell cycle, ultimately forming cancer. Last but not least came IL20RB, which promotes bone metastasis of lung cancer.
RPL37
RPL37 is a gene that is the source of expression of a ribosomal protein located at the 60S subunit in the cytoplasm. The L37E ribosomal proteins is the family of which the gene belongs. In a nutshell, Ribosomes catalyze the building and synthesis of proteins, they contain two subunits in total - a smaller 40S subunit and a larger 60S subunit - consist of 4 RNA strands and almost 80 structurally unique proteins. The RPL37 gene is associated with several diseases such as cataract 4, multiple types, and atrial septal defect. L. Daftuar et al. found in an 2013 article that RPL37 is among the RPs that activates p53, a tumor-suppressor gene by the downregulation of Mdm level [8].
WDR77
WDR77 is one of the WD40-containing proteins that are expressed for rapid growth of the epithelial cells for which it enables cells to join the cell cycle. Z. Gu .et al in 2013 published that the WDR77 gene is re-activated in cells found to be in lung adenocarcinoma and caused abnormally high proliferation by letting cells to re-enter the cell cycle [9].
IL-20RB
IL-20RB, also known as the beta subunit of human interleukin-20 receptor, is a recombinant protein product primarily used in immunohistochemical testing. IL-20RB is mainly expressed in skin tissue and is secreted by peripheral blood mononuclear cells (PBMCs) and activated epithelial cells. Its receptor is formed by combining IL-20Ralpha and IL-20Rbeta subunits. IL-20 must bind to both IL-20Ralpha and IL-20Rbeta simultaneously to activate STAT3 transcription factor and subsequently activate the expression of downstream genes. A recent article in 2022 published by Y. He et al. suggested that IL-20RB directly promoted the metastasis of lung adenocarcinoma to the bone marrow, and proved that the reduced expression of this gene could effectively decrease the metastasis of lung adenocarcinoma cells to the bone marrow [10].
4. Discussion
Although our method of simple multi-omics analysis and integration suggested some of the possible targets related to lung adenocarcinoma, there are still limitations for this experiment. In terms of data, the recorded data sets are identified through CBioPortal by searching “tcga luad”. Therefore, the experimental autonomy is relatively low since we didn’t collect the data by ourselves. In addtion, the accuracy of this dataset cannot be monitored, this leads to a problem since the data collecting process is sophisticated. Firstly, the researchers need to collect lung tissue from a lung adenocarcinoma patient (disease group), and the lung tissue from health person (control group). Then, the samples need to be chopped and grined, so the DNA and RNA can be extracted. After extraction, sequencing is done to DNA RNA and proteins, which leads to analysis of the data. By using instruments, the up regulation or down regulation of each patient’s DNA, RNA and protein can be clearly displayed, and this forms the data set. As described, each step has a high experimental error rate. Therefore, if this ready-made data is used, the accuracy of the experiment cannot be confirmed.
Despite the of the limitation in data accuracy, using Multi Omics approach to analyse the data to detect the possible targets is still a very promising research direction while both results from our method included found targets of lung adenocarcinoma, which proved our method to be effective. This could offer an idea and enlightment for of analysis of future researches on the same topic. In the future, more and more people will get cancer in their early age, because this is already a global trend. Therefore, the demand of developing more targeted drugs to cope with this trend will increase as well. Moreover, targeted therapy can precisely attack on cancer cells, meanwhile having damage to normal civillians cells in patient’s body. Thus, this therapy for cancer will definitely be more of a treatment option compared to other conventional therapy (e.g chemotherapy), which proved the importance of the analysis of targets for lung adenocarcinoma using our method of multi-omics and bioinformatics.
5. Conclusion
In a nutshell, we designed a possible approach to filter and locate targets for lung adenocarcinoma treatments and validated it’s functionality by proving that it is capable of finding possible genes interacting with cancer cells. We integrated the RNA expression with the protein expression level, and calculated z-score averages from data provided from a third party site after modelled into a normal distribution. Then we ranked RNA and gene expression in individuals and all luad patients as a whole to uncover possible target genes responsible or related to lung adenocarcinoma. The fact that we have discovered identified genes from our method proved that the method is completely practical, feasible and is able to provide useful information and shed light on future cancer research using bioinformatics. In addition, the coding in this method is not exclusive, which could be altered flexibly according to the demand of the researchers, as long as the central thesis is clear.
References
[1]. Global Cancer Statistics 2020: GLOBOCAN Estimates of Incidence and Mortality Worldwide for 36 Cancers in 185 Countries
[2]. Sung, H., Ferlay, J., Siegel, R. L., Laversanne, M., Soerjomataram, I., Jemal, A., & Bray, F. (2021). Global Cancer Statistics 2020: GLOBOCAN Estimates of Incidence and Mortality Worldwide for 36 Cancers in 185 Countries. CA Cancer J Clin, 71(3), 209-249. https://doi.org/10.3322/caac.21660
[3]. Liu Z, Zhao Y, Kong P, Liu Y, Huang J, Xu E, Wei W, Li G, Cheng X, Xue L, Li Y, Chen H, Wei S, Sun R, Cui H, Meng Y, Liu M, Li Y, Feng R, Yu X, Zhu R, Wu Y, Li L, Yang B, Ma Y, Wang J, Zhu W, Deng D, Xi Y, Wang F, Li H, Guo S, Zhuang X, Wang X, Jiao Y, Cui Y, Zhan. Integrated multi-omics profiling yields a clinically relevant molecular classification for esophageal squamous cell carcinoma. Cancer Cell. 2023 Jan 9;41(1):181-195.e9. doi: 10.1016/j.ccel2022.12.004. Epub 2022 Dec 29. PMID: 36584672
[4]. Schabath MB, Cote ML. Cancer Progress and Priorities: Lung Cancer. Cancer Epidemiol Biomarkers Prev. 2019 Oct;28(10):1563-1579. doi: 10.1158/1055-9965.EPI-19-0221. PMID: 31575553; PMCID: PMC6777859.
[5]. Asada, K., Kobayashi, K., Joutard, S., Tubaki, M., Takahashi, S., Takasawa, K., Komatsu, M., Kaneko, S., Sese, J., & Hamamoto, R. (2020). Uncovering Prognosis-Related Genes and Pathways by Multi-Omics Analysis in Lung Cancer. Biomolecules, 10(4). https://doi.org/10.3390/biom1004052
[6]. Luan, M., Song, F., Qu, S., Meng, X., Ji, J., Duan, Y., Sun, C., Si, H., & Zhai, H. (2020). Multi-omics integrative analysis and survival risk model construction of non-small cell lung cancer based on The Cancer Genome Atlas datasets. Oncol Lett, 20(4), 58. https://doi.org/10.3892/ol.2020.11919
[7]. Chen, M., Li, S., Liang, Y., Zhang, Y., Luo, D., & Wang, W. (2021). Integrative Multi-Omics Analysis of Identified NUF2 as a Candidate OncogenCorrelates With Poor Prognosis and Immune Infiltration in Non-Small Cell Lung Cancer. Front Oncol, 11, 656509. https://doi.org/10.3389/fonc.2021.656509
[8]. Dong, X., Leng, Y., Tian, T., Hu, Q., Chen, S., Liu, Y., & Shen, L. (2023). GALNT2, an O-glycosylating enzyme, is a critical regulator of radioresistance of non-small cell lung cancer: evidence from an integrated multi-omics analysis. Cell Biol Toxicol. https://doi.org/10.1007/s10565-023-09825-6
[9]. Zhang L, Parvin R, Chen M, Hu D, Fan Q, Ye F. High-throughput microfluidic droplets in biomolecular analytical system: A review. Biosens Bioelectron. 2023 May 15;228:115213. doi: 10.1016/j.bios.2023.115213. Epub 2023 Mar 8. PMID: 36906989.
[10]. Daftuar, L., Zhu, Y., Jacq, X., & Prives, C. (2013). Ribosomal proteins RPL37, RPS15 and RPS20 regulate the Mdm2-p53-MdmX network. PLoS One, 8(7), e68667. https://doi.org/10.1371/journal.pone.0068667
Cite this article
Chenyu,L.;Duan,P.R. (2024). Exploration and determination of lung cancer targets using multi-omics approaches. Theoretical and Natural Science,33,34-45.
Data availability
The datasets used and/or analyzed during the current study will be available from the authors upon reasonable request.
Disclaimer/Publisher's Note
The statements, opinions and data contained in all publications are solely those of the individual author(s) and contributor(s) and not of EWA Publishing and/or the editor(s). EWA Publishing and/or the editor(s) disclaim responsibility for any injury to people or property resulting from any ideas, methods, instructions or products referred to in the content.
About volume
Volume title: Proceedings of the 2nd International Conference on Modern Medicine and Global Health
© 2024 by the author(s). Licensee EWA Publishing, Oxford, UK. This article is an open access article distributed under the terms and
conditions of the Creative Commons Attribution (CC BY) license. Authors who
publish this series agree to the following terms:
1. Authors retain copyright and grant the series right of first publication with the work simultaneously licensed under a Creative Commons
Attribution License that allows others to share the work with an acknowledgment of the work's authorship and initial publication in this
series.
2. Authors are able to enter into separate, additional contractual arrangements for the non-exclusive distribution of the series's published
version of the work (e.g., post it to an institutional repository or publish it in a book), with an acknowledgment of its initial
publication in this series.
3. Authors are permitted and encouraged to post their work online (e.g., in institutional repositories or on their website) prior to and
during the submission process, as it can lead to productive exchanges, as well as earlier and greater citation of published work (See
Open access policy for details).
References
[1]. Global Cancer Statistics 2020: GLOBOCAN Estimates of Incidence and Mortality Worldwide for 36 Cancers in 185 Countries
[2]. Sung, H., Ferlay, J., Siegel, R. L., Laversanne, M., Soerjomataram, I., Jemal, A., & Bray, F. (2021). Global Cancer Statistics 2020: GLOBOCAN Estimates of Incidence and Mortality Worldwide for 36 Cancers in 185 Countries. CA Cancer J Clin, 71(3), 209-249. https://doi.org/10.3322/caac.21660
[3]. Liu Z, Zhao Y, Kong P, Liu Y, Huang J, Xu E, Wei W, Li G, Cheng X, Xue L, Li Y, Chen H, Wei S, Sun R, Cui H, Meng Y, Liu M, Li Y, Feng R, Yu X, Zhu R, Wu Y, Li L, Yang B, Ma Y, Wang J, Zhu W, Deng D, Xi Y, Wang F, Li H, Guo S, Zhuang X, Wang X, Jiao Y, Cui Y, Zhan. Integrated multi-omics profiling yields a clinically relevant molecular classification for esophageal squamous cell carcinoma. Cancer Cell. 2023 Jan 9;41(1):181-195.e9. doi: 10.1016/j.ccel2022.12.004. Epub 2022 Dec 29. PMID: 36584672
[4]. Schabath MB, Cote ML. Cancer Progress and Priorities: Lung Cancer. Cancer Epidemiol Biomarkers Prev. 2019 Oct;28(10):1563-1579. doi: 10.1158/1055-9965.EPI-19-0221. PMID: 31575553; PMCID: PMC6777859.
[5]. Asada, K., Kobayashi, K., Joutard, S., Tubaki, M., Takahashi, S., Takasawa, K., Komatsu, M., Kaneko, S., Sese, J., & Hamamoto, R. (2020). Uncovering Prognosis-Related Genes and Pathways by Multi-Omics Analysis in Lung Cancer. Biomolecules, 10(4). https://doi.org/10.3390/biom1004052
[6]. Luan, M., Song, F., Qu, S., Meng, X., Ji, J., Duan, Y., Sun, C., Si, H., & Zhai, H. (2020). Multi-omics integrative analysis and survival risk model construction of non-small cell lung cancer based on The Cancer Genome Atlas datasets. Oncol Lett, 20(4), 58. https://doi.org/10.3892/ol.2020.11919
[7]. Chen, M., Li, S., Liang, Y., Zhang, Y., Luo, D., & Wang, W. (2021). Integrative Multi-Omics Analysis of Identified NUF2 as a Candidate OncogenCorrelates With Poor Prognosis and Immune Infiltration in Non-Small Cell Lung Cancer. Front Oncol, 11, 656509. https://doi.org/10.3389/fonc.2021.656509
[8]. Dong, X., Leng, Y., Tian, T., Hu, Q., Chen, S., Liu, Y., & Shen, L. (2023). GALNT2, an O-glycosylating enzyme, is a critical regulator of radioresistance of non-small cell lung cancer: evidence from an integrated multi-omics analysis. Cell Biol Toxicol. https://doi.org/10.1007/s10565-023-09825-6
[9]. Zhang L, Parvin R, Chen M, Hu D, Fan Q, Ye F. High-throughput microfluidic droplets in biomolecular analytical system: A review. Biosens Bioelectron. 2023 May 15;228:115213. doi: 10.1016/j.bios.2023.115213. Epub 2023 Mar 8. PMID: 36906989.
[10]. Daftuar, L., Zhu, Y., Jacq, X., & Prives, C. (2013). Ribosomal proteins RPL37, RPS15 and RPS20 regulate the Mdm2-p53-MdmX network. PLoS One, 8(7), e68667. https://doi.org/10.1371/journal.pone.0068667