


1 Introduction
In the contemporary field of ecosystem research, the quest for innovative methodologies that can unravel the complexities of species relationships has become a focal point of scholarly interest. This study, leveraging the Composite Multi-Factor Relationship (CMFR) model, represents a cutting-edge attempt to dissect the intricate web of interactions between species, with a particular emphasis on the stability of ecological systems. By pioneering the application of this advanced methodological framework, our research makes a substantial contribution to the body of knowledge concerning ecosystem dynamics and the nuanced interplay of species within these environments. The burgeoning interest in quantitative models capable of capturing and predicting the intricacies of ecological interactions reflects a broader scientific movement towards more holistic understandings of ecosystem functions. Among these models, the CMFR model distinguishes itself by offering a sophisticated approach that considers a multitude of factors affecting species relationships, thereby facilitating a more comprehensive exploration of ecosystem dynamics.
This study employs the CMFR model to analyze the relationship between sea lampreys and their prey in the Great Lakes, drawing upon data spanning from 2001 to 2011. This analysis integrates extensive data on plankton conditions and the sex ratios of sea lampreys to illuminate how shifts in environmental variables and behavioral patterns of species contribute to the overall stability of the ecosystem. Our findings reveal that changes in the sex ratio of lampreys exert profound impacts on their predatory efficiency and, by extension, the equilibrium of the ecological system. These insights underscore the CMFR model’s efficacy in predicting the outcomes of diverse biological and environmental modifications on ecosystem responses.
In conclusion, this research extends beyond the mere advancement of the CMFR model as a pivotal tool for ecosystem analysis. It underscores the critical need to engage with the complex fabric of species interactions within ecological studies. The insights derived from our study enrich our understanding of the fundamental processes that govern ecosystem stability, offering valuable perspectives on the management of invasive species and the conservation of biodiversity. Through a detailed examination of predator-prey dynamics, facilitated by the CMFR model, this work contributes to a deeper and more nuanced comprehension of ecological balance, highlighting the significance of integrative approaches in ecological research.
2 Literature Review
The advancement in predictive methods across various fields, especially within the context of ecological and environmental studies, has significant implications for analyzing species relationships and ecosystem dynamics. This review integrates insights from five recent studies, demonstrating the diversity and applicability of predictive approaches in contexts closely related to the study of sea lampreys’ impacts on ecosystems like the Great Lakes.
Tedla et al. [1] underscored the utility of multi-source data integration for environmental predictions. This methodology can be crucial for forecasting ecosystem changes due to invasive species, offering parallels to understanding the ecological dynamics influenced by sea lampreys. Dai et al. [2] explored the application of enhanced vision transformers in health diagnostics, a computational model with potential utility in ecological research for species identification and behavioral analysis, relevant to monitoring invasive species. Dhamelincourt al. [3] aimed to protect young sea lampreys from predation and adverse environmental conditions by analyzing the habitats of their nests, which influence the surrounding ecological communities. Dai et al. [4] proposed an integrative approach for stroke prediction, combining machine learning algorithms. This model’s complexity and integrative nature could inspire methodologies for ecological modeling and prediction, especially in understanding multifaceted ecological interactions like those between sea lampreys and their prey. Wagner et al. [5] explored how migratory sea lampreys adjust their behavior in response to olfactory cues indicating predation risk, demonstrating their ability to reduce exposure to predators through threat-sensitive responses. Cui et.al [6] focused on improving the adsorption capacity of molecular sieves for heavy metal ions, which pose significant threats to human health and ecosystems. The study’s findings could contribute to better water purification methods, thereby protecting aquatic ecosystems. Allyn [7] evaluated species distribution models in the context of changing ecosystem conditions, particularly in the Northeast US Shelf Large Marine Ecosystem. The research projected the impact of environmental changes on ecosystems, emphasizing the need for resilient strategies. Barley [8] explored how climate change affects marine species and ecosystems on physiological, evolutionary, and ecological levels, highlighting significant spatial heterogeneity in responses.Ferreira et al. [9] provided much-needed taxonomic and evolutionary insights into the genus, contributing to a better understanding of rainforest biodiversity. Pańkowska [10] discussed the role of enterprise architecture modeling in ensuring a holistic view of business organizations within urban ecosystems. While primarily focused on urban planning and development, the study underscores the importance of considering ecosystems in designing sustainable cities.
Collectively, these studies highlight the versatility of predictive methods and their applicability to ecological research. From data integration and automated image analysis to advanced computational models and machine learning algorithms, these methodologies offer promising avenues for enhancing our understanding of ecosystem dynamics and the impact of invasive species like sea lampreys.
3 Model
3.1 Data sources
This paper used data measured by Margaret F. Docker in her book [11] and statistics provided by Euan D. Reavie in his literature [12]. The collated data consisted primarily of the calendar year plankton conditions in the waters of the Great Lakes of the United States and the calendar year sex ratios of sea lampreys in the region. We carefully combed through both documents and used data from 2001 to 2011. In addition, the corresponding websites are shown in Table 1.
Table 1. Data source collation
Dataset |
Website Source |
sex ratio of sea lampreys |
https://link.springer.com/book/10.1007/978-94-017-9306-3 |
phytoplankton in the Great Lakes |
https://www.pnas.org/content/suppl/2020/05/13/1909166117.DCSupplemental |
3.2 Data Processing
As described in the literature [11], larval sea lampreys are more likely to exhibit in food-poor growing environments, and females become more abundant when there is a lack of energy available, nearly always in the same numbers as males. In addition, since juvenile sea lampreys feed on zooplankton, zooplankton population density can be used to express the degree of food availability for larvae sea lamprey. We carefully referred to the data in [11] and [12], and finally chose the relevant data from North America’s Great Lakes-Lake Superior for the period from 2001 to 2011. After standardizing the data in different dimensions, we obtained scatter plots between the sex ratio of larvae sea lampreys and the density of zooplankton populations, which were expected to have a linear negative correlation, and obtained the corresponding equation, shown in Figure 1:
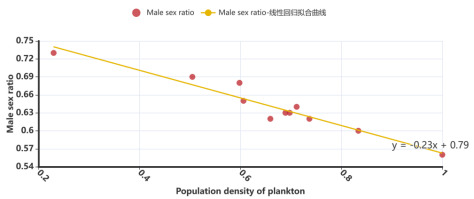
Figure 1. Scatter plot of male proportion - food richness and its linear regression
As described in the literature [13], the abundance of lake trout, as the usual host of adult sea lampreys, is closely related to the parasitic aggressiveness of sea lampreys, with higher abundance of lake trout implying higher aggressiveness of sea lampreys. To derive the effect of parasitism by sea lampreys on hosts, we verified the relationship between the relative abundance of trout and lampreys aggression rates and depicted a scatterplot of the relationship between them, as shown in the Figure 2. After normalizing the data in different dimensions, we obtained a scatterplot between lampreys attack rate and relative abundance of lake trout, which was expected to be positively correlated.
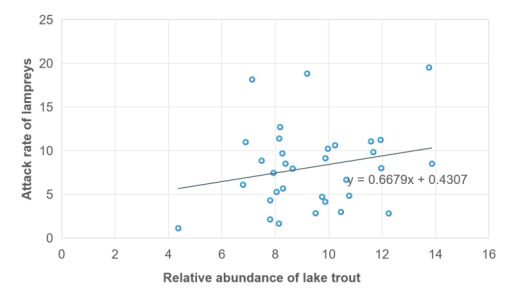
Figure 2. Scatter plot of male proportion - food richness and its linear regression
3.3 Predation Model for the Larval and Metamorphotic Phases of Lampreys
In this model, we investigate the predatory relationship between larval and metamorphic phases of lampreys and planktonic organisms under the premise of changes in sex ratio. Based on this premise, we obtain the dynamic variations of a larger ecosystem, including changes in the density of lamprey populations and planktonic organism populations. Furthermore, we summarize the advantages and potential disadvantages associated with the adaptive sex ratio changes in lamprey populations.
3.3.1 Model Establishment & Parameter Estimation. In this model, we applied CMFR to simulate the disturbance between phytoplankton and zooplankton, in order to describe the dynamic relationship of the whole ecosystem and its change with time more accurately, we introduced the variables P(t), Z(t) and F(t), which represent the population densities of phytoplankton, zooplankton, and lampreys at the moment of t and establish the population density differential equation, and our designed model is:
\( \begin{cases}\frac{dP}{dt}=sP(1-\frac{P}{K})-\frac{ωPZ}{(1+αP)(1+βZ)} \\\frac{dZ}{dt}=\frac{ω_{1}PZ}{(1+αP)(1+βZ)}-γZ-r_{1}ZF \\ \frac{dF}{dt}=rF(1-\frac{F}{K_{1}})+r_{2}ZF-\frac{qEF}{m_{1}E+m_{2}F} \end{cases}\ \ \ (1) \)
In an ecosystem, the population density of phytoplankton is related to its own growth rate, s, as well as to its rate of predation by predators, \( ω \) , and its handling time, a, for phytoplankton ( \( ω_{1} \) is the rate at which zooplankton capture phytoplankton, 0 < \( ω_{1} \) < ω), and is limited by the environmental holding capacity, K. The population density of phytoplankton in an ecosystem is determined by the rate of growth, s, as measured by the maximum rate of predation, w. Zooplankton feed on and compete with each other for food, as measured by B. In addition, the maximum rate at which zooplankton are taken ( \( r_{1} \) ) and the mortality rate, rr, also affect the population size. Meanwhile, the biomass conversion rate \( r_{2} \) , the harvestability coefficient q and the environmental holding capacity \( K_{1} \) of the lamprey population, as a higher trophic level predator, further affects its predation effect on zooplankton. Finally, the harvest coefficient E determines the efficiency of human resource extraction from the ecosystem. These parameters are interrelated and together determine the dynamic balance and stability of the ecosystem.
In the literature [14], we were able to obtain more informative values for the parameters, as shown in Table 2:
Table 2. Parameter list
Symble |
Value |
Symble |
Value |
Symble |
Value |
Symble |
Value |
\( s \) |
0.1 |
\( α \) |
0.01 |
\( r_{1} \) |
0.3 |
\( m_{1} \) |
1 |
\( K \) |
12 |
\( β \) |
0.05 |
\( r_{2} \) |
0.7 |
\( m_{2} \) |
0.4 |
\( ω \) |
0.28 |
\( γ \) |
0.2 |
\( q \) |
0.5029 |
||
\( ω_{1} \) |
0.18 |
\( K_{1} \) |
7 |
\( E \) |
2.9825 |
3.3.2 Predation Model under Sex Proportional Changes. Prior to adulthood, males consume energy more rapidly than females due to their higher resting metabolic rate and more frequent swimming activities, and this higher energy consumption leads to the need for males to feed more frequently to meet their energy requirements [19].
For adult lampreys, because the difference in body size between males and females is very small, and there is no significant difference in their growth rates, the feeding levels of the two species are similar [20]. Therefore, we can conclude that the sea lamprey population has a greater proportion of males, a higher predation intensity and a greater impact on the ecosystem.
Similarly, changes in the sex ratio of lampreys can also lead to changes in intraspecific relationships, for example, if the proportion of males is too high, it will lead to males previously fighting to seize females, instead of being detrimental to their own reproduction; if the proportion of females is greater, it will lead to a substantial increase in the density of the population of the offspring of the previous generation after reproduction, which is conducive to the expansion of its own population size, but the impact on the ecosystem is very drastic.
Therefore, we obtained the food abundance C based on the change in population density of zooplankton over time from formula (1), and brought it into the male ratio-food abundance equation:
\( C(t)=\frac{P(t)+Z(t)}{max{\{P(t)+Z(t)\}}} , R_{m}=-0.23C+0.79\ \ \ (2) \)
The population growth rate \( r \) is related to changes in the number of female lampreys, and here we simplify the equation to include the sex ratio of females in \( r \) for ease of calculation: \( r=0.326+(1-R_{m}) \) .
3.4 Lamprey Parasitic Model
In this model, we examined the parasitic relationship between juvenile and adult lampreys and Great Lakes trout (one of the hosts of the lampreys) under the assumption of a change in the sex ratio, and obtained the dynamics of a larger ecosystem, including changes in the density of the lampreys population and changes in the density of the Great Lakes trout population under the assumption of a change in the sex ratio.
We obtained a type II functional response model based on the existence of a type II functional response between lampreys and Great Lakes trout as mentioned in the literature [13]:
\( A=\frac{δD}{1+δεD}\ \ \ (3) \)
Among them, \( δ \) and \( ε \) are some related parameters. To illustrate the attack of lampreys on lake trout, we constructed:
\( A=\frac{MD}{L}\ \ \ (4) \)
A represents the annual attack rate of each lamprey on lake trout, M represents the probability of survival of lake trout after being attacked by lamprey, D represents the relative abundance of lake trout, and L represents the abundance of lake trout. If we assume that the abundance of lake trout is T, the population density of juvenile lampreys is F, and the probability of each lake trout being attacked is k, as shown in section 3.2:
\( k=0.6679+0.4307\frac{F(t)}{max{F(t)}}\ \ \ (5) \)
According to formula (3), we obtained the following formula:
\( \frac{kT}{F}=\frac{eT}{1+ehT}\ \ \ (6) \)
Among them, e is the probability that the lamprey can effectively search for its host, and h is the handling time. We observe formulas (4) and (5), so that:
\( \begin{cases}M=Sk \\D=QT \\L=pF \end{cases}\ \ \ (7) \)
Among them, S is the survival rate of lake trout attacked by adult lampreys, q is the catch coefficient of lake trout, and p is the survival rate of lampreys from juvenile to adult stage. After that, we can obtain the following formula:
\( \frac{MD}{L}=\frac{(\frac{Se}{p})D}{1+(\frac{eh}{Q})D}=\frac{(\frac{Se}{p})D}{1+(\frac{Se}{p})(\frac{ph}{SQ})D}\ \ \ (8) \)
From this, it can be concluded that \( δ=Se/p,ε=ph/(SQ). \)
In the literature [13], we were able to obtain more informative values for the parameters, as shown in Table 3:
Table 3. Parameter list
Symble |
Value |
Symble |
Value |
Symble |
Value |
Symble |
Value |
Symble |
Value |
\( S \) |
0.5 |
\( e \) |
0.37 |
\( p \) |
0.63 |
\( h \) |
0.3 |
\( Q \) |
0.4 |
For ease of study, we deform (8) as follows:
\( D=(\frac{Se}{p}\frac{M}{L}-1)\frac{Q}{eh}\ \ \ (9) \)
\( L=M∙\frac{1+(\frac{eh}{Q})D}{\frac{Se}{p}} \ \ \ (10) \)
\( M=\frac{\frac{Se}{p}}{1+(\frac{eh}{Q})L}D\ \ \ (11) \)
Where formula (9) represents the relationship between Great Lakes trout population abundance and the probability of survival of Great Lakes trout after being attacked by lampreys, given different lampreys population densities. Formula (10) represents the relationship between lamprey population abundance and Great Lakes trout population abundance, given different probabilities of survival after being attacked by lampreys. Formula (11) represents the relationship between probability of survival of Great Lakes trout after being attacked by lampreys and the abundance of lamprey population, given different Great Lakes trout population abundances.
3.5 Stability and Population Model
Calculating the overall stability of an ecosystem requires converting values of a specific ecosystem function (e.g., biomass production) or a stability component (e.g., resistance to temperature) into a common currency and then combining them [15]. Therefore, when considering how the sex ratio of lampreys affects the stability of the ecosystem, we need to take into account the differences in their growth process. For example, during the larval and metamorphosis stages, they affect phytoplankton and zooplankton, and in the parasitic stage, they impact other fish species, such as lake trout. Thus, the influence of changes in the sex ratio of lampreys on the ecosystem is complex.
Considering that the stability of biomass affects the stability of the ecosystem, we constructed the following equation based on the literature and the requirements of this question [16]:
\( CV(n_{1}+n_{2}+…+n_{m})=100\frac{σ(1+2ζ)}{G\sqrt[]{m[1-(1-r_{0})^{2}]}}\ \ \ (12) \)
In formula (12), CV represents the stability of biomass, \( σ \) represents the standard deviation of environmental disturbances, \( ζ \) represents the degree of niche overlap, G is the environmental carrying capacity, \( r_{0} \) is the intrinsic growth rate, and n denotes the species richness of different populations:
\( n=[\frac{\int_{0}^{t_{0}} P(t)}{t_{0}} \frac{\int_{0}^{t_{0}} Z(t)}{t_{0}} \frac{\int_{0}^{t_{0}} F(t)}{t_{0}} \frac{\int_{0}^{t_{0}} L(t)}{t_{0}} \frac{\int_{0}^{t_{0}} D(t)}{t_{0}}]\ \ \ (13) \)
In this model, we considered a total of five organisms: the lamprey population itself, phytoplankton and zooplankton that form predation relationships with lampreys, and lake trout that form a parasitic relationship with lampreys. Therefore, in formula (12), \( m=5 \) . Based on the actual situation, we have found more informative parameter values, as shown in Table 4:
Table 4. Parameter list
Symble |
Value |
Symble |
Value |
Symble |
Value |
Symble |
Value |
\( A \) |
0 |
\( G \) |
10 |
\( B \) |
1 |
\( v \) |
2 |
\( c \) |
1 |
\( R_{0} \) |
0.1 |
\( ζ \) |
0.2 |
\( δ \) |
0.5 |
From the literature [15], we know that ecosystem stability can be described by the following equation:
\( Y=A+\frac{G-A}{(c+Qe^{-Bx})^{\frac{1}{v}}}\ \ \ (14) \)
Formula (14) represents the generalized logistic equation, where Y is the stability indicator of the ecosystem, A is the lower asymptote parameter, c is a constant, Q is the position parameter related to initial conditions, x is the population quantity, B is the gradient, and v represents the value of Y(0). The parameter values are shown in Table 5:
Table 5. Parameter list
Symble |
Value |
Symble |
Value |
Symble |
Value |
Symble |
Value |
\( A \) |
-1 |
\( G \) |
100 |
\( B \) |
1 |
\( v \) |
2 |
\( c \) |
1 |
\( R_{0} \) |
0.1 |
\( Q \) |
1 |
\( δ \) |
1 |
4 Result Analysis
4.1 Result of Predation Model
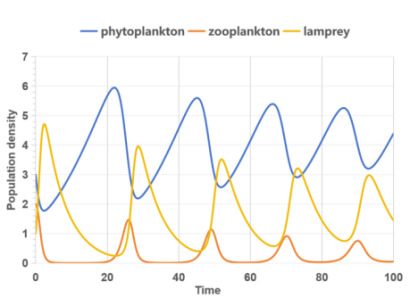
Figure 3 shows the population density-time curve of zooplankton and lampreys in this ecosystem without and with gender.
The relationship between lamprey and zooplankton population densities, without considering gender, is primarily a predator-prey dynamic. As local zooplankton density increases, lamprey populations rise accordingly, and vice versa, with lamprey predation affecting zooplankton numbers. However, this interaction is more complex when lamprey sex ratios fluctuate. Changes in these ratios can lead to a rapid increase in lamprey numbers, surpassing zooplankton densities and causing a sharp decline in zooplankton, which historically aligns with lampreys’ invasive behavior in various countries.
 |
 |
(a) Without sex proportion factor |
(b)With sex proportion factor |
Figure 3. Population density - time curve |
|
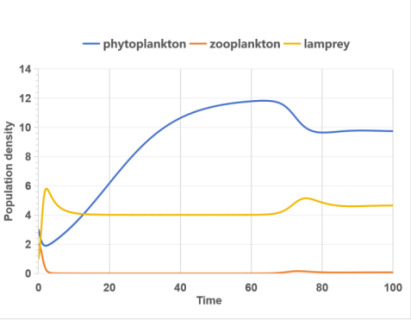
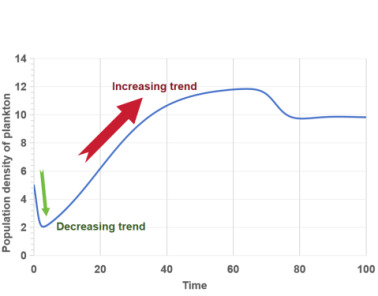
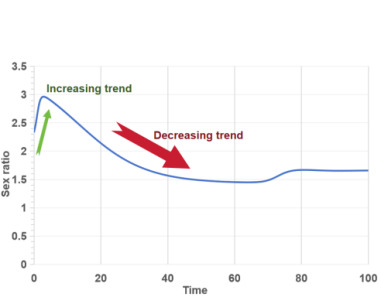
Figure 4 (a) illustrates that changes in the sex ratio of lampreys affect the combined population density of phytoplankton and zooplankton. A higher proportion of male lampreys enhances their predation capabilities, leading to increased consumption of zooplankton. As shown in Figures 3 (b) and 4 (b), the initial higher population density of zooplankton declines sharply with the rapid increase in the lamprey sex ratio, nearing zero. This indicates that lampreys’ ability to adapt their sex ratios significantly impacts the ecosystem, posing a risk of substantial population oscillations and potential extinction for the zooplankton they prey upon.
 |
 |
(a) Change in population density of planktonic organisms |
(b)The ratio of males to females |
Figure 4. The relationship between population density of plankton and gender ratio |
|
From Figure 5, as shown in the legend, it is phytoplankton population density: zooplankton population density: lamprey population density, and the curve is the change curve of the sex ratio of lampreys under the ecosystem environment simulating different food abundance. It can be seen that with the gradual increase in the number of phytoplankton, the male proportion shows a decreasing trend, and the female proportion shows an increasing trend, and finally tends to level off. In addition, it can be found that the degree of fluctuation of the curve is gradually decreasing with the increase of food abundance, and the time to recover to the approximate constant sex ratio is also gradually shortening, the ability to recover is also increasing.
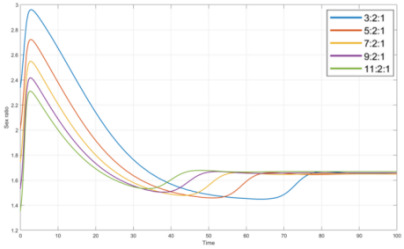
Figure 5. Sex ratio under changes in plankton proportion
Changes in an organism’s sex ratio significantly influence its population dynamics and ecological interactions. An increase in the number of females can boost a population’s reproductive capacity, leading to more successful mating and offspring production. Conversely, a decline in female numbers can reduce reproductive potential, potentially sparking male competition for the scarce females and favoring the reproduction of dominant males.
Sex ratio adjustments can also enhance population adaptation to challenging environments. For instance, in resource-poor conditions, fewer females might mean less reproduction, thereby allocating more resources to the current population and ensuring survival. These intraspecific dynamics are crucial for understanding how populations respond to environmental pressures and maintain ecological balance.
4.2 Result of Lamprey Parasitic Model
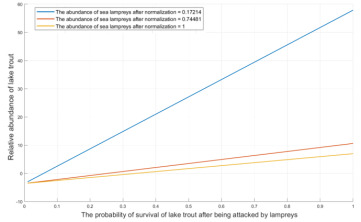
Figure 6. Relative Abundance of Lake Trout - Survival Probability Curve of Lake Trout
Figure 6 depicts how the survival probability of Great Lakes trout, following lamprey attacks, correlates with the trout’s relative abundance in relation to varying lamprey population sizes (L). High survival probabilities for the trout mean they are more likely to withstand lamprey parasitization, leading to higher relative abundance compared to situations with lower survival rates. Conversely, as lamprey numbers rise, the increased parasitization negatively affects the relative abundance of Great Lakes trout, causing it to decline progressively. This relationship highlights the delicate balance between predator and prey dynamics within the ecosystem.
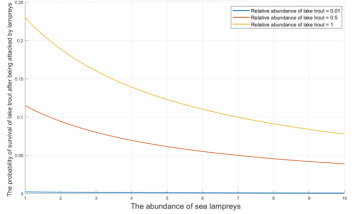
Figure 7. Survival probability of lake trout - abundance curve of lampreys
As shown in Figure 7, the survival probability of Great Lakes trout varies with the abundance of lampreys for different values of D, i.e., changes in the relative abundance of Great Lakes trout. For ecosystems with equal abundance of lampreys, the higher the relative abundance of Great Lakes trout, the higher their population resistance to parasitism by lampreys, and the higher their survival probability.
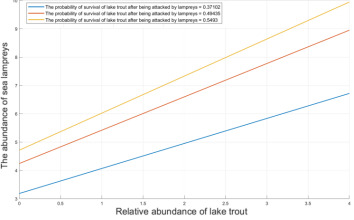
Figure 8. Abundance curve of sea lamprey and lake trout
As shown in Figure 8, the abundance of lampreys varies against the abundance of Great Lakes trout for different values of M, i.e., the survival probability of Great Lakes trout after being attacked by lampreys. For ecosystems of equal Great Lakes trout abundance, the higher the probability of survival of Great Lakes trout after attack, the higher the abundance of lampreys. If the probability of survival of Great Lakes trout after an attack is low, the Great Lakes trout population shrinks rapidly, and the lamprey is unable to feed adequately because of the inability to feed adequately, which in turn also leads to a decline in lamprey abundance. The more trout are parasitized by lampreys, the lower the probability of survival and the lower the relative abundance of trout.
4.3 Result of Stability and Population Model
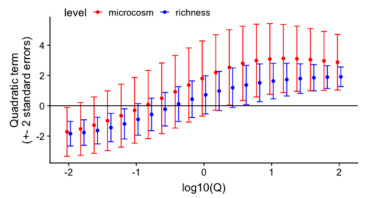
Figure 9. Ecosystem stability species richness curve[17]
According to the literature [15], Figure 9 shows that the difference in slope between the stability and species richness curves of the ecosystem is constant under different Q values.
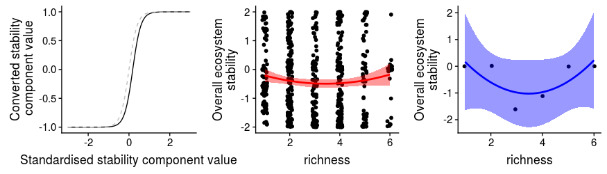
Figure 10. Ecosystem stability species richness curve
Figure 10 derived from a Q value of 0.4 in reference [18] reveals a U-shaped correlation between ecosystem stability in Lake Superior and species richness. This indicates that ecosystem stability is compromised when species richness is either too high or too low. The presence of lampreys can be beneficial, regulating local species populations. However, without proper management, lampreys can cause a drastic decrease in species abundance, particularly when the male-to-female ratio is imbalanced. A higher proportion of females boosts the natural reproduction rate, while an excess of males can lower it, pushing species richness to lower levels and reducing ecosystem stability. Thus, a balanced gender ratio in the seven-branch eel can contribute to a more stable local ecosystem.
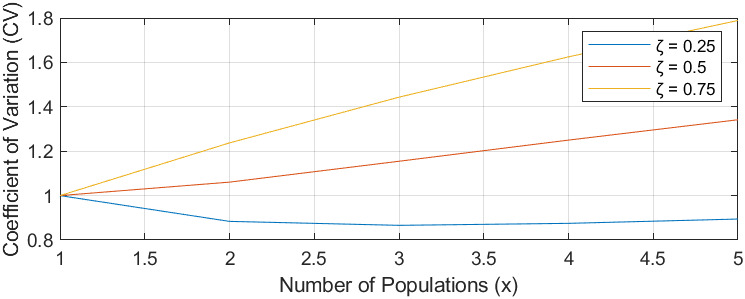
Figure 11. Ecosystem stability species richness curve
Figure 11, based on [16] and formula (12), demonstrates that the stability of an ecosystem’s biomass is linked to the ecological niche similarity ( \( ζ \) ) among species. A lower \( ζ \) value signifies less competition and a higher likelihood of species coexistence, leading to ecosystem stability. High \( ζ \) values suggest increased competition, potentially causing species extinction and destabilizing the ecosystem.
5 Conclusion
The conclusion of this study highlights the critical role of sex ratio variations in sea lampreys on their predation behavior and the subsequent impact on ecosystem stability in the Great Lakes. Utilizing the Composite Multi-Factor Relationship (CMFR) model, the research illustrates how changes in lamprey populations influence prey dynamics and ecosystem balance. Key findings demonstrate the model’s effectiveness in depicting complex ecological interactions and underscore the importance of considering diverse biological and environmental factors in ecosystem management. This study provides valuable insights for ecological research and the development of strategies to preserve biodiversity and maintain ecosystem health, advocating for the use of quantitative models like the CMFR to enhance our understanding of species relationships and ecosystem dynamics.
References
[1]. Tedla H Z, Bekele T W, Nigussie L, et al. Threshold-based flood early warning in an urbanizing catchment through multi-source data integration: Satellite and citizen science contribution[J]. Journal of Hydrology, 2024: 131076.
[2]. Dai W, Mou C, Wu J, et al. Diabetic retinopathy detection with enhanced vision transformers: The twins-pcpvt solution[C]//2023 IEEE 3rd International Conference on Electronic Technology, Communication and Information (ICETCI). IEEE, 2023: 403-407.
[3]. Dhamelincourt M. The use of sea lamprey (Petromyzon marinus L. 1758) nests for a better understanding of the ecology, behaviour and ecosystem interactions of the species during its spawning phase[D]. Université de Pau et des Pays de l’Adour; Universidad del País Vasco, 2022.
[4]. Dai W, Jiang Y, Mou C, et al. An integrative paradigm for enhanced stroke prediction: Synergizing xgboost and xdeepfm algorithms[C]//Proceedings of the 2023 6th International Conference on Big Data Technologies. 2023: 28-32.
[5]. Wagner C M, Bals J D, Byford G J, et al. Olfactory sensitivity and threat-sensitive responses to alarm cue in an invasive fish[J]. Biological Invasions, 2023, 25(10): 3083-3101.
[6]. Cui W, Tang K, Chen Y Q, et al. Regulating the particle sizes of NaA molecular sieves toward enhanced heavy metal adsorption[J]. New Journal of Chemistry, 2024.
[7]. Allyn A J. Assessing the Capacity of Species Distribution Models to Support Forward-Looking Decision-Making Processes[J]. 2024.
[8]. Barley J M. CLIMATE CHANGE EFFECTS ON MARINE SPECIES PHYSIOLOGY AND BIOGEOGRAPHY[J]. 2024.
[9]. Ferreira G E, Clark J L, Clavijo L, et al. Phylogenetics, character evolution, and historical biogeography of the Neotropical genus Besleria (Gesneriaceae)[J]. Botanical Journal of the Linnean Society, 2024: boae007.
[10]. Pańkowska M. Goal-Oriented Metropolis Ecosystem Development[J]. Managing Global Transitions, 2024, 22(1).
[11]. Lampreys: biology, conservation and control[M]. Dordrecht: Springer, 2015.
[12]. Reavie E D, Barbiero R P, Allinger L E, et al. Phytoplankton trends in the Great Lakes, 2001–2011[J]. Journal of Great Lakes Research, 2014, 40(3): 618-639.
[13]. Adams J V, Jones M L, Bence J R. Investigating apparent misalignment of predator-prey dynamics: Great Lakes lake trout and sea lampreys[J]. Fisheries Research, 2020, 232: 105734.
[14]. Kumari S, Upadhyay R K. Dynamics comparison between non-spatial and spatial systems of the plankton–fish interaction model[J]. Nonlinear Dynamics, 2020, 99(3): 2479-2503.
[15]. Pennekamp F, Pontarp M, Tabi A, et al. Biodiversity increases and decreases ecosystem stability[J]. Nature, 2018, 563(7729): 109-112.
[16]. Hughes J B, Roughgarden J. Species diversity and biomass stability[J]. The American Naturalist, 2000, 155(5): 618-627.
[17]. “Overall ecosystem stability?” url:https://frankpennekamp.shinyapps.io/ Overall_ecosystem_ stability_demo/
[18]. Lampreys: biology, conservation and control[M]. Dordrecht: Springer, 2015.
[19]. Quintella B R, Clemens B J, Sutton T M, et al. At-sea feeding ecology of parasitic lampreys[J]. Journal of Great Lakes Research, 2021, 47: S72-S89.
[20]. Ma Qinghua, et al. “Analysis of the Correlation between Morphological Traits and Body Mass of Lethenteron reissneri and the Differences in Morphological Traits between Male and Female.” Journal of Fisheries Science, 31.5 (2018): 10.
Cite this article
Ding,Y.;Xu,X.;Liang,K. (2024). Study of species relationship analysis based on the CMFR model. Theoretical and Natural Science,39,129-140.
Data availability
The datasets used and/or analyzed during the current study will be available from the authors upon reasonable request.
Disclaimer/Publisher's Note
The statements, opinions and data contained in all publications are solely those of the individual author(s) and contributor(s) and not of EWA Publishing and/or the editor(s). EWA Publishing and/or the editor(s) disclaim responsibility for any injury to people or property resulting from any ideas, methods, instructions or products referred to in the content.
About volume
Volume title: Proceedings of the 2nd International Conference on Mathematical Physics and Computational Simulation
© 2024 by the author(s). Licensee EWA Publishing, Oxford, UK. This article is an open access article distributed under the terms and
conditions of the Creative Commons Attribution (CC BY) license. Authors who
publish this series agree to the following terms:
1. Authors retain copyright and grant the series right of first publication with the work simultaneously licensed under a Creative Commons
Attribution License that allows others to share the work with an acknowledgment of the work's authorship and initial publication in this
series.
2. Authors are able to enter into separate, additional contractual arrangements for the non-exclusive distribution of the series's published
version of the work (e.g., post it to an institutional repository or publish it in a book), with an acknowledgment of its initial
publication in this series.
3. Authors are permitted and encouraged to post their work online (e.g., in institutional repositories or on their website) prior to and
during the submission process, as it can lead to productive exchanges, as well as earlier and greater citation of published work (See
Open access policy for details).
References
[1]. Tedla H Z, Bekele T W, Nigussie L, et al. Threshold-based flood early warning in an urbanizing catchment through multi-source data integration: Satellite and citizen science contribution[J]. Journal of Hydrology, 2024: 131076.
[2]. Dai W, Mou C, Wu J, et al. Diabetic retinopathy detection with enhanced vision transformers: The twins-pcpvt solution[C]//2023 IEEE 3rd International Conference on Electronic Technology, Communication and Information (ICETCI). IEEE, 2023: 403-407.
[3]. Dhamelincourt M. The use of sea lamprey (Petromyzon marinus L. 1758) nests for a better understanding of the ecology, behaviour and ecosystem interactions of the species during its spawning phase[D]. Université de Pau et des Pays de l’Adour; Universidad del País Vasco, 2022.
[4]. Dai W, Jiang Y, Mou C, et al. An integrative paradigm for enhanced stroke prediction: Synergizing xgboost and xdeepfm algorithms[C]//Proceedings of the 2023 6th International Conference on Big Data Technologies. 2023: 28-32.
[5]. Wagner C M, Bals J D, Byford G J, et al. Olfactory sensitivity and threat-sensitive responses to alarm cue in an invasive fish[J]. Biological Invasions, 2023, 25(10): 3083-3101.
[6]. Cui W, Tang K, Chen Y Q, et al. Regulating the particle sizes of NaA molecular sieves toward enhanced heavy metal adsorption[J]. New Journal of Chemistry, 2024.
[7]. Allyn A J. Assessing the Capacity of Species Distribution Models to Support Forward-Looking Decision-Making Processes[J]. 2024.
[8]. Barley J M. CLIMATE CHANGE EFFECTS ON MARINE SPECIES PHYSIOLOGY AND BIOGEOGRAPHY[J]. 2024.
[9]. Ferreira G E, Clark J L, Clavijo L, et al. Phylogenetics, character evolution, and historical biogeography of the Neotropical genus Besleria (Gesneriaceae)[J]. Botanical Journal of the Linnean Society, 2024: boae007.
[10]. Pańkowska M. Goal-Oriented Metropolis Ecosystem Development[J]. Managing Global Transitions, 2024, 22(1).
[11]. Lampreys: biology, conservation and control[M]. Dordrecht: Springer, 2015.
[12]. Reavie E D, Barbiero R P, Allinger L E, et al. Phytoplankton trends in the Great Lakes, 2001–2011[J]. Journal of Great Lakes Research, 2014, 40(3): 618-639.
[13]. Adams J V, Jones M L, Bence J R. Investigating apparent misalignment of predator-prey dynamics: Great Lakes lake trout and sea lampreys[J]. Fisheries Research, 2020, 232: 105734.
[14]. Kumari S, Upadhyay R K. Dynamics comparison between non-spatial and spatial systems of the plankton–fish interaction model[J]. Nonlinear Dynamics, 2020, 99(3): 2479-2503.
[15]. Pennekamp F, Pontarp M, Tabi A, et al. Biodiversity increases and decreases ecosystem stability[J]. Nature, 2018, 563(7729): 109-112.
[16]. Hughes J B, Roughgarden J. Species diversity and biomass stability[J]. The American Naturalist, 2000, 155(5): 618-627.
[17]. “Overall ecosystem stability?” url:https://frankpennekamp.shinyapps.io/ Overall_ecosystem_ stability_demo/
[18]. Lampreys: biology, conservation and control[M]. Dordrecht: Springer, 2015.
[19]. Quintella B R, Clemens B J, Sutton T M, et al. At-sea feeding ecology of parasitic lampreys[J]. Journal of Great Lakes Research, 2021, 47: S72-S89.
[20]. Ma Qinghua, et al. “Analysis of the Correlation between Morphological Traits and Body Mass of Lethenteron reissneri and the Differences in Morphological Traits between Male and Female.” Journal of Fisheries Science, 31.5 (2018): 10.