


1. Introduction
The process of predicting the popularity of songs on platforms such as Spotify has garnered significant attention from researchers, given the profound impact digital transformation has had on music consumption patterns. Platforms like Spotify have risen to the forefront of this transformation, offering vast datasets for analyzing song popularity through metrics like streaming counts and playlist inclusions. According to Gulmatico et al., predictive models employing machine learning algorithms have been increasingly utilized to forecast a song's success, drawing upon audio features, social media data, and other relevant metrics [1].
As highlighted by Ge et al., song popularity is influenced by a blend of acoustic properties-danceability, energy, and valence-and external factors such as social media engagement and the artist's existing fan base [2]. This comprehensive approach underscores the multifaceted nature of music popularity, moving beyond mere intrinsic musical qualities to include listener interactions and behaviors. To manage the high dimensionality of the data, these studies have applied sophisticated data science techniques, including Principal Component Analysis (PCA) and model blending, effectively isolating the most significant predictors of song popularity.
Moreover, Yee and Raheem underscore the importance of integrating various data sources to enhance the accuracy of predictions [3]. By combining Spotify's audio features with YouTube's social media metrics, researchers can gain a more holistic view of a song's potential appeal [4, 5]. This integrative approach acknowledges the role of listener engagement on social media platforms as a critical indicator of a song's likelihood to achieve popularity. Additionally, Saragih's exploration of the Indonesian streaming market further validates the predictive power of Spotify's music features, achieving a 69% accuracy rate in forecasting song popularity [6]. This finding underscores the potential of using linear regression to analyze music characteristics and predict their impact on popularity within the Indonesian context, laying a theoretical foundation for the broader application of this analytical approach.
While these studies provide a comprehensive overview, other research endeavors have also contributed significantly to the field. For instance, explorations into the temporal dynamics of music popularity, Monechi et al., offered insights into how songs' appeal evolves over time, suggesting that patterns of rapid growth in streaming numbers can signal emerging hits [7, 8]. Similarly, investigations into the role of collaborative filtering in music recommendation systems (Parkhomenko et al., 2019) shed light on how user behavior data can inform predictive models of song popularity, highlighting the importance of user-generated data in understanding music consumption trends [9, 10].
This investigation delves into Spotify's music popularity by leveraging common audio features as predictors in linear regression analysis. Focusing on variables such as "energy," "mode," "speechiness," "year," "duration minute," and "danceability," with "mode" distinguished as a categorical variable representing major and minor keys, this study builds upon the premise that certain musical features can significantly influence a song's popularity. The quest to accurately predict song popularity on Spotify involves an intricate interplay of musical, social, and technological factors. The assimilation of varied data sources and the application of cutting-edge analytical techniques forge new avenues for comprehending and forecasting music trends. This collective body of research not only deepens yje understanding of the music industry but also provides crucial insights for artists, producers, and marketers to strategize their releases more effectively.
2. Methodology
2.1. Data source
Kaggle provided hundreds of song music features in Spotify from 1986 to 2022. From CSV, this paper imported the data into R Studio. Clean the data after importing it. Remove missing data and irrelevant content from the study. The train model train model uses only 2013– 2023 data. Using 60% of the data to train the model and 40% for testing.
2.2. Data process
This paper performed exploratory data analysis to determine variable distribution after data cleaning. A preliminary model (model_1) is fitted and two conditions are checked. This paper looked for random diagonal scatter or non-linear trends in the Scatterplot of Response versus Fitted values. This meets the conditional mean response condition if observed. This paper then checked all predictor pairwise scatterplots for curves or other non-linear patterns. If observed, the conditional mean predictor condition is met.
This paper uses residual plots to test the “Uncorrelated Errors Assumption”, “Linearity Assumption”, “Constant Variance Assumption”, and “Normality Assumption”. Any systematic pattern like fanning pattern with increasing or decreasing spread in “residual vs. fitted value plot” violates “Constant Variance Assumption”; this paper corrects it with Variance Stabilising [11]. QQ plots with stark deviations from the diagonal line violate 'Normality Assumption'. The author can correct it with a Box-Cox transformation on the variable. Large clusters of many points in “residual vs. fitted value” violate the “Uncorrelated Error Assumption” and indicate a flawed model. Plots with systematic patterns like curves or predictor functions violate the “Linearity Assumption”.
2.3. Method introduction
After checking assumptions and transformation, this paper uses ANOVA Test to determine if at least one model predictor has a statistically significant linear relationship. Since the model consist of 10 predictors with corresponding coefficients \( {β_{1}},{β_{2}},…,{β_{10}} \) , this paper has \( {H_{0}}: {β_{1}}={β_{2}}=…={β_{10}}=0. {H_{a}}: at least one {β_{j}}≠0 \) when conducting ANOVA Test. This paper has \( {F^{*}}=\frac{S{S_{reg}}/p}{RSS/(n-p-1)}~F(p,n-p-1) \) . If P-value \( \lt α \) or \( {F^{*}} \gt {F_{(1-α),(p,n-p-1)}} \) then the author rejects null hypothesis and conclude a statistically significant linear relationship exists for at least one predictor. Otherwise, the model is invalid because there is no statistically significant linear relationship. This paper then tests the linear relationship between each predictor and response using \( t-test \) . Dropping predictors with no linear relationship to the response creates the reduced model \( (mode{l_{2}}) \) . Partial F Test determines whether to use \( mode{l_{1}} \) or \( mode{l_{2}} \) . Let \( {β_{2}} \) be the vector of \( k \) coefficients removed from \( mode{l_{1}} \) and conduct hypothesis test, \( {H_{0}}:{β_{2}}=0 v.s {H_{a}}:{β_{2}}≠0 \) , \( {F^{*}}=\frac{RS{S_{drop}}/k}{RS{S_{full}}/(n-p-1)}~F(k,n-p-1) \) . If \( {F^{*}} \gt {F_{(1-α),(p,n-p-1)}} \) , this paper rejects the null and conclude there exists a significant linear relationship between response variable and at least one of the \( k \) predictors, and this paper keeps those \( k \) predictors. Otherwise, the author removes those predictors and apply \( mode{l_{2}} \) . The residual plot is used to recheck the four assumptions for violations [12, 13]. If violations are found, the author adjusts as above.
After choosing the final model, \( mode{l_{f}} \) , the author checks its \( VIF \) for multicollinearity. The author detects severe multicollinearity with \( VIF \gt 5. \) If the model has severe multicollinearity, the author can add data and rebuild or respecify it. The author must also identify problematic observations. If \( {h_{ii}} \gt 2(\frac{p+1}{n}) \) then the author has a potential high leverage point. If the standardized residuals \( {r_{i}}∉[-4,4] \) for observation, then the author observed an outlier point. And for influence observation, there are cutoff \( {D_{i}} \gt median of F(p+1,n-p-1), |DFFIT{S_{i}}| \gt 2\sqrt[]{\frac{(p+1)}{n}}, |DFBETA{S_{j(i)}}| \gt \frac{2}{\sqrt[]{n}} \) for three measures to identify influence observations. If there are any problematic observations observed, this paper should include it in the scope of the limitation of the study.
Using testing data, the author verifies \( mode{l_{f}} \) validity, including minimal differences in estimated coefficients, significant relationships between predictors, and similar \( R_{adj}^{2}and etc \) . The author will discuss causes of significant differences in the discussion.
3. Results and discussion
3.1. Condition 1 and Condition 2 Evaluation
Upon examining a pair plot (as shown in Figure 1) constructed using the training dataset, it is observed that the variable popularity exhibits a certain degree of linear relationship with the following variables: danceability, energy, speechiness, year, and duration_min. In addition, the variable mode, which is binary (categorical), is included among those variables for potential prediction. Therefore, these variables satisfy the first condition that requires a linear relationship with the response variable (y).
Examination of scatter plots between potential predictor variables indicates certain linear relationships. Of particular note is the linear association between danceability and speechiness and between danceability and energy. Therefore, the model has dropped danceability to avoid possible multicollinearity problems at the subsequent modeling stage. This decision relates to Condition 2, which pertains to minimizing the chance of multicollinearity among predictor variables. Such an approach is more integrity-preserving and substantive because the variables that display higher linearity to other measures are left out.
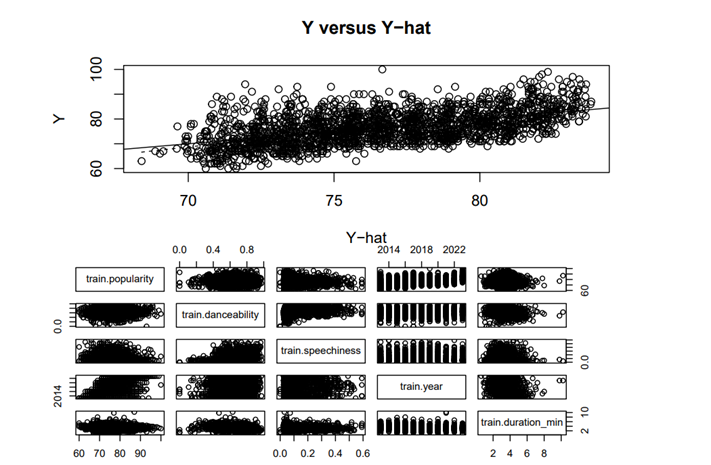
Figure 1. Scatterplot of Response versus Fitted Values and Pairwise Scatterplot of Predictors
3.2. Descriptive statistics
Descriptive statistics on 1,947 training tracks reveal interesting trends. Recent music from 2013–2023 dominates the dataset. Popularity averages 76.44 with a standard deviation of 6.693, indicating high appeal. Energy levels average 0.612, indicating moderate intensity with variation. Mode shows 63.9% of tracks are in major keys. Low speechiness (0.104) suggests melody over speech. Average track length is 3.41 minutes but varies. Danceability averages 0.638 and ranges from 0 to 0. 973 (Table 1).
Table 1. Descriptive Statistics Table
Variables | Mean | 1st Qu. | 3rd Qu. | Median | Min | Max |
Popularity | 76.64 | 72.00 | 81.00 | 76.00 | 60.00 | 100.00 |
Energy | 0.61 | 0.48 | 0.74 | 0.62 | 0.00 | 1.00 |
Mode | 0.64 | 1.00 | 1.00 | 1.00 | 0.00 | 1.00 |
Speechiness | 0.10 | 0.13 | 0.13 | 0.05 | 0.00 | 0.59 |
Year | 2018 | 2021 | 2021 | 2018 | 2013 | 2023 |
Duration | 3.41 | 3.86 | 3.86 | 3.38 | 0.60 | 10.22 |
Danceability | 0.64 | 0.75 | 0.75 | 0.65 | 0.00 | 0.97 |
3.3. Model results
In the initial model, popularity is the dependent variable and energy, danceability, speechiness, mode, duration_min, and year are independent variables. Both duration_min and speechiness skewness suggested by pair plot analysis should be transformed to strengthen the model.
Energy is insignificant at 10% in this initial model's regression results, Table 2 Column (1). Excluding energy, the study estimates Model 2. Table 2, Column (2), shows Model 2 results. All variables are significant at the 10% level with an increase in Adjusted R-squared and a decrease in Akaike information criterion.
The study also uses the F partial test to question the relevance of excluding energy. The F partial test p-value is above 0.1, so the author cannot reject this energy null hypothesis at a 10% level and recommend Model 2 for this study.
Model 2 was also used to train the data to test its ability to capture variable relationships and avoid overfitting. As shown in Table 2, Column (3), most of these coefficients remain statistically significant and have no significant magnitude/direction changes. This supports Model 2 for this analysis.
Table 2. Model results
Variables | All Variable Model | Optimal Train Model | Optimal Test Model |
log(speechiness+1) | -7.872 | -8.034 | -8.179 |
log(duration_min) | 1.455 | 1.333 | 0.987 |
Mode | -1.102 | -1.101 | -1.441 |
Energy | 0.812 | - | - |
Year | 1.109 | 1.100 | 1.130 |
Danceability | 2.254 | 1.736 | 1.273 |
Constant | 2164 | -2165 | -2203 |
RSE | 5.616 | 5.613 | 5.601 |
AIC | 6731.576 | 6723.752 | 4482.336 |
AICc | 6731.764 | 6723.81 | 4482.422 |
BIC | 6798.464 | 6757.196 | 4513.352 |
Adjusted Rsq | 0.281 | 0.282 | 0.308 |
R-squared | 0.285 | 0.284 | 0.311 |
As shown in Table 2, Model 2's variable coefficients reveal their relationship to popularity. The Log (speechiness) coefficient is negative, indicating a strong inverse relationship with popularity. Increasing speechiness may hurt a song's popularity. Positive Log (Duration) coefficient. This implies that longer songs are more popular. The positive correlation shows that track duration increases popularity. Mode coefficient is negative. This suggests that major-key (mode=1) songs are less popular than minor-key ones. This reveals listeners' music tonality preferences. Positive year coefficients indicate that newer music is more popular. This trend emphasis the importance of newness or relevance in track popularity. Finally, the Danceability coefficient is positive, meaning that music that dance is more appealing to audiences.
3.4. Model diagnostic
The inspection of the plot of residuals versus independent variables, as depicted in Figure 2, reveals a lack of discernible patterns, suggesting that the relationships in the model are linear. This is a critical validation of one of the fundamental assumptions of linear regression.
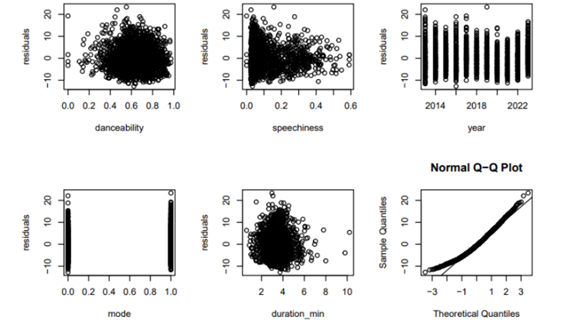
Figure 2. Scatterplot of Residuals versus Predictors and Normal QQ Plot
Figure 3 presents the scatter plot of residuals against fitted values. The absence of any distinct pattern or systematic structure in the scatter plot supports the assumption of homoscedasticity, meaning that the variances across the range of predicted values are consistent.
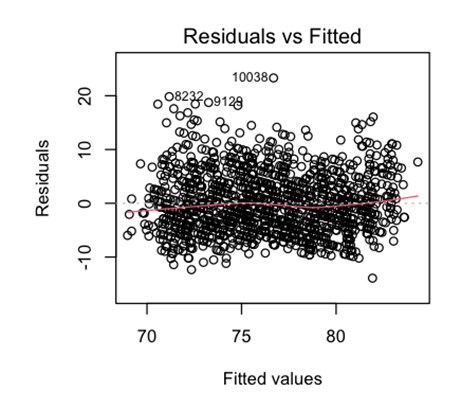
Figure 3. Scatterplot of Residuals versus Fitted values
Figure 3 shows that the scatter plot of residuals and fitting values does not show significant clustering, indicating that the model does not violate the assumption of error independence.
As evidenced in Table 3, the Variance Inflation Factors (VIF) for each independent variable in the model fall below the threshold of 10. This indicates that multicollinearity is not a concern within the model, allowing for more reliable interpretations of the regression coefficients.
Table 3. VIF for Predictors
log(Speechiness) | log(duration_min) | Mode | year | dnceability | |
VIF | 1.106 | 1.062 | 1.023 | 1.041 | 1.137 |
Figure 4 illustrates the relationship between leverage and standardized residuals. It can be observed that there are no data points with both high leverage and high residuals. Consequently, the author can infer that no abnormal values are exerting undue influence on the results of Model 2.
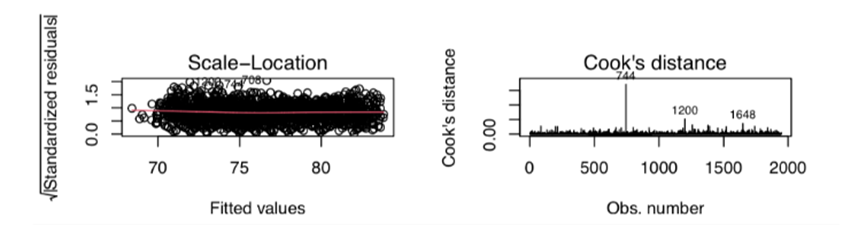
Figure 4. Scale Location Plot and Cook’s Distance Plot
Key regression analysis determinants for Spotify song popularity in this study. Instrumental music is preferred over speech if log(speechiness+1) is negative [10]. However, a positive log(duration_min) coefficient indicates a preference for longer, more elaborate music.
Major-mode songs are less popular than minor-mode ones, defying the belief that major modes bring happiness. That suggests a cultural shift towards more complex songs [11]. A positive coefficient on year indicates a taste for contemporary music from streaming platforms and shows how important recency is in hit music [12].
The positive Danceability coefficient suggests rhythmically engaging tracks are more appealing. This trend emphasises the importance of rhythm in music composition and suggests a shift towards more dynamic and interactive listening experiences.
4. Conclusion
Model 2's findings have important implications for the music industry. Ambient music may revitalise instrumental tracks due to the inverse relationship between speechiness and popularity. This may indicate that consumers are moving away from streaming-optimized songs and towards longer tracks. Spotify and other platforms may switch moods due to fans of new and minor modes. Danceability also boosts popularity, benefiting artists and platforms that can get listeners dancing.
This study was limited by using data from less than ten years and only 2,000 observations for training and test sets. Such a small population may not reflect the trend over time or show listener behaviour. There might exists a more advanced model composed of variables out of the scope of the study.
The ethics surrounding data-driven approaches in the music industry should be considered when analyzing music popularity. Quantitative research has much to say about trends and preferences, but it might also be detrimental to the distinct and original character of the musical works.
Music becoming formulaic is a major concern. Heavy data-driven strategies may homogenise artists because they will focus on what is statistically popular rather than creativity. This approach can reduce musical creativity and diversity, and artists may not feel compelled to follow data trends to sell. In addition, music creation is not like molecular cuisine, where moving music can be reproduced in bulk if you get the recipe right.
In other words, overemphasis on quantifiable traits such as speechiness, length, and mode may prevent music from conveying emotional tone, social meaning, and artistic originality to the listener. An excessive focus on quantitative data can rob music of its emotional value. Correct personal data management is also important. Industry datasets on listening habits and choices are large. This information must be protected from privacy breaches and misuse. Data use must be fair, ethical, and considerate of listeners' privacy.
Lastly, Data can identify industry trends, but it shouldn't control art and creativity. The industry should allow artists to develop their ideas and explore their potential without being limited by popularity. This balanced approach lets data guide music industry strategies while preserving music's diversity and creative freedom.
References
[1]. Al-Beitawi Z, Salehan M and Zhang S 2020 What Makes a Song Trend? Cluster Analysis of Musical Attributes for Spotify Top Trending Songs. Journal of Marketing Development and Competitiveness, 14(3), 79-91.
[2]. Araujo C V S, Cristo M A P and Giusti R 2019 Predicting Music Popularity Using Music Charts. 2019 18th IEEE International Conference on Machine Learning and Applications (ICMLA), 859-864.
[3]. Ge Y, Wu J and Sun Y 2020 Popularity prediction of music based on factor extraction and model blending. 2020 2nd International Conference on Economic Management and Model Engineering (ICEMME), 1062-1065.
[4]. Gulmatico J S, et al. 2022 SpotiPred: A Machine Learning Approach Prediction of Spotify Music Popularity by Audio Features. 2022 Second International Conference on Power, Control and Computing Technologies (ICPC2T), 1-5.
[5]. Guo B 2021 A Model for Predicting Pop Music Popularity and Its Different Characteristics Based on Multiple Linear Regression. Academic Journal of Computing & Information Science, 4(5), 58-70.
[6]. Kaye D B V 2022 Please Duet This: Collaborative Music Making in Lockdown on TikTok. Networking Knowledge: Journal of the MeCCSA Postgraduate Network, 15(1).
[7]. Lee J and Lee J S 2018 Music popularity: Metrics, characteristics, and audio-based prediction. IEEE Transactions on Multimedia, 20(11), 3173-3182.
[8]. Monechi B, et al. 2017 Significance and popularity in music production. IEEE Transactions on Multimedia.
[9]. Parkhomenko I and Berezovska K 2022 Popularity Strategies of a Modern Music Artist. Socio-Cultural Management Journal, 5(2), 126-141.
[10]. Ren J and Kauffman R J 2017 Understanding music track popularity in a social network. 25th European Conference on Information Systems (ECIS), 374-388.
[11]. Saragih H S 2023 Predicting song popularity based on spotify’s audio features: insights from the Indonesian streaming users. Journal of Management Analytics.
[12]. Sciandra M and Spera I C 2022 A model-based approach to Spotify data analysis: a Beta GLMM. Journal of Applied Statistics, 49(1), 214–229.
[13]. Yee Y K and Raheem M 2022 Predicting Music Popularity Using Spotify and YouTube Features. Indian Journal of Science and Technology 15(36): 1786-1799.
Cite this article
Li,K. (2024). Predicting song popularity in the digital age through Spotify’s data. Theoretical and Natural Science,39,68-75.
Data availability
The datasets used and/or analyzed during the current study will be available from the authors upon reasonable request.
Disclaimer/Publisher's Note
The statements, opinions and data contained in all publications are solely those of the individual author(s) and contributor(s) and not of EWA Publishing and/or the editor(s). EWA Publishing and/or the editor(s) disclaim responsibility for any injury to people or property resulting from any ideas, methods, instructions or products referred to in the content.
About volume
Volume title: Proceedings of the 2nd International Conference on Mathematical Physics and Computational Simulation
© 2024 by the author(s). Licensee EWA Publishing, Oxford, UK. This article is an open access article distributed under the terms and
conditions of the Creative Commons Attribution (CC BY) license. Authors who
publish this series agree to the following terms:
1. Authors retain copyright and grant the series right of first publication with the work simultaneously licensed under a Creative Commons
Attribution License that allows others to share the work with an acknowledgment of the work's authorship and initial publication in this
series.
2. Authors are able to enter into separate, additional contractual arrangements for the non-exclusive distribution of the series's published
version of the work (e.g., post it to an institutional repository or publish it in a book), with an acknowledgment of its initial
publication in this series.
3. Authors are permitted and encouraged to post their work online (e.g., in institutional repositories or on their website) prior to and
during the submission process, as it can lead to productive exchanges, as well as earlier and greater citation of published work (See
Open access policy for details).
References
[1]. Al-Beitawi Z, Salehan M and Zhang S 2020 What Makes a Song Trend? Cluster Analysis of Musical Attributes for Spotify Top Trending Songs. Journal of Marketing Development and Competitiveness, 14(3), 79-91.
[2]. Araujo C V S, Cristo M A P and Giusti R 2019 Predicting Music Popularity Using Music Charts. 2019 18th IEEE International Conference on Machine Learning and Applications (ICMLA), 859-864.
[3]. Ge Y, Wu J and Sun Y 2020 Popularity prediction of music based on factor extraction and model blending. 2020 2nd International Conference on Economic Management and Model Engineering (ICEMME), 1062-1065.
[4]. Gulmatico J S, et al. 2022 SpotiPred: A Machine Learning Approach Prediction of Spotify Music Popularity by Audio Features. 2022 Second International Conference on Power, Control and Computing Technologies (ICPC2T), 1-5.
[5]. Guo B 2021 A Model for Predicting Pop Music Popularity and Its Different Characteristics Based on Multiple Linear Regression. Academic Journal of Computing & Information Science, 4(5), 58-70.
[6]. Kaye D B V 2022 Please Duet This: Collaborative Music Making in Lockdown on TikTok. Networking Knowledge: Journal of the MeCCSA Postgraduate Network, 15(1).
[7]. Lee J and Lee J S 2018 Music popularity: Metrics, characteristics, and audio-based prediction. IEEE Transactions on Multimedia, 20(11), 3173-3182.
[8]. Monechi B, et al. 2017 Significance and popularity in music production. IEEE Transactions on Multimedia.
[9]. Parkhomenko I and Berezovska K 2022 Popularity Strategies of a Modern Music Artist. Socio-Cultural Management Journal, 5(2), 126-141.
[10]. Ren J and Kauffman R J 2017 Understanding music track popularity in a social network. 25th European Conference on Information Systems (ECIS), 374-388.
[11]. Saragih H S 2023 Predicting song popularity based on spotify’s audio features: insights from the Indonesian streaming users. Journal of Management Analytics.
[12]. Sciandra M and Spera I C 2022 A model-based approach to Spotify data analysis: a Beta GLMM. Journal of Applied Statistics, 49(1), 214–229.
[13]. Yee Y K and Raheem M 2022 Predicting Music Popularity Using Spotify and YouTube Features. Indian Journal of Science and Technology 15(36): 1786-1799.