


1 Introduction
Sleep is a complex and essential biological process characterized by distinct stages, each associated with specific patterns of brain activity. Understanding the dynamics of these stages and their underlying neural mechanisms is crucial for comprehending normal and pathological sleep. Electroencephalography (EEG) provides a powerful tool for studying brain oscillations during sleep, revealing how different frequency bands and their interactions contribute to sleep architecture. Light sleep (stages 1 and 2), deep sleep (stages 3 and 4), and rapid eye movement (REM) sleep each exhibit unique oscillatory characteristics that reflect the brain's functional state. Quantitative analysis of EEG data, such as power spectral density (PSD), coherence, and phase synchronization, offers detailed insights into the spectral and functional properties of sleep stages. These analyses can identify dominant oscillatory components, measure the synchronization between brain regions, and track the temporal coordination of neuronal activity. Furthermore, mathematical models like the Ising and Kuramoto models provide theoretical frameworks to simulate and predict the behavior of neuronal populations during sleep. These models can capture the bistable nature of neuronal activity, describe phase dynamics, and elucidate the neural circuits involved in sleep regulation. This study aims to integrate quantitative EEG analysis with mathematical modeling to explore the relationship between sleep stages and brain oscillations. We investigate how these techniques can enhance our understanding of sleep disorders, such as insomnia, sleep apnea, and narcolepsy, by revealing disruptions in oscillatory activity and functional connectivity [1]. By leveraging both empirical data and computational simulations, we seek to develop novel therapeutic strategies to improve sleep quality and treat sleep-related conditions.
2 EEG Characteristics of Sleep Stages
2.1 Light Sleep (Stages 1 and 2)
Light sleep, encompassing stages 1 and 2, is characterized by a transition from wakefulness to deeper sleep. Stage 1 is marked by the presence of theta waves (4-7 Hz) and a reduction in alpha activity (8-12 Hz). This stage represents the initial drowsiness and the onset of sleep, where the brain begins to disengage from external stimuli. EEG recordings during stage 1 show a decrease in high-frequency beta waves (13-30 Hz) and an increase in low-frequency activity, indicating a shift towards a more synchronized neuronal state [2]. As sleep progresses to stage 2, sleep spindles (11-16 Hz) and K-complexes emerge, reflecting bursts of oscillatory activity and cortical synchrony that play a role in sensory processing and memory consolidation. The frequency and amplitude of these oscillations can be quantitatively analyzed to assess the stability and quality of sleep.
2.2 Deep Sleep (Stages 3 and 4)
Deep sleep, also known as slow-wave sleep (SWS), comprises stages 3 and 4 and is dominated by delta waves (0.5-4 Hz). This stage is crucial for restorative processes, including tissue repair, immune function, and energy conservation. The EEG pattern in deep sleep is characterized by high-amplitude, low-frequency delta oscillations that indicate a high degree of neuronal synchrony. Quantitative analysis of delta power reveals a significant increase compared to lighter sleep stages, suggesting enhanced cortical inhibition and reduced cortical arousal. The depth and continuity of delta waves are essential markers of sleep quality and are often disrupted in sleep disorders such as insomnia and sleep apnea [3]. Mathematical models, such as the Ising model, can simulate the synchronization dynamics of neuronal populations during deep sleep, providing insights into the regulatory mechanisms of sleep homeostasis.
2.3 REM Sleep
REM sleep is distinguished by a unique EEG pattern that resembles wakefulness, with mixed frequency low-amplitude waves and prominent theta activity. This stage is associated with vivid dreaming, increased brain metabolism, and heightened cortical activity. The oscillatory dynamics during REM sleep involve rapid eye movements, muscle atonia, and a shift towards desynchronized EEG patterns. The predominance of theta oscillations (4-8 Hz) in the hippocampus and neocortex during REM sleep is linked to memory consolidation and emotional processing. Quantitative EEG analysis can measure the coherence and phase synchronization of theta waves, revealing the intricate neural networks involved in REM sleep. Mathematical models, such as the Kuramoto model, can describe the phase relationships between oscillatory components, shedding light on the neural mechanisms of REM sleep regulation [4].
3 Quantitative Analysis of Sleep Oscillations
3.1 Power Spectral Density (PSD)
Power spectral density (PSD) analysis is a fundamental tool for quantifying the power of different frequency bands in EEG signals. By calculating the PSD, researchers can identify the dominant oscillatory components in each sleep stage and assess their relative power. In light sleep, PSD analysis reveals an increase in theta and spindle activity, whereas deep sleep shows a marked elevation in delta power. REM sleep is characterized by mixed frequency oscillations with prominent theta power. These quantitative measurements provide a detailed understanding of the spectral characteristics of sleep and can be used to compare normal and pathological sleep patterns. The integration of PSD analysis with machine learning algorithms can enhance the diagnostic accuracy of sleep disorders. Table 1 presents the quantitative analysis of power spectral density (PSD) for different sleep stages. Table 2 summarizes the power of different frequency bands across various sleep stages, highlighting the variations in oscillatory activity characteristic of each stage.
Table 1. PSD Analysis of Sleep Stages
Sleep Stage |
Theta Power (4-7 Hz) |
Spindle Power (11-16 Hz) |
Delta Power (0.5-4 Hz) |
Mixed Frequency Power |
Light Sleep (Stage 1) |
31.73501923 |
21.88941899 |
36.79454712 |
17.41243025 |
Light Sleep (Stage 2) |
36.23210067 |
21.23818723 |
46.99057398 |
29.61727119 |
Deep Sleep (Stage 3) |
28.51971742 |
17.93257602 |
39.43587625 |
25.1816136 |
Deep Sleep (Stage 4) |
27.50356559 |
23.45284279 |
39.56830286 |
21.85223697 |
REM Sleep |
22.9444953 |
17.59934576 |
42.05885006 |
25.08027299 |
Table 2. Power of Different Frequency Bands Across Various Sleep Stages
Sleep Stage |
Theta Power (4-7 Hz) |
Spindle Power (11-16 Hz) |
Delta Power (0.5-4 Hz) |
Mixed Frequency Power |
Light Sleep (Stage 1) |
31.74 |
21.89 |
36.79 |
17.41 |
Light Sleep (Stage 2) |
36.23 |
21.24 |
46.99 |
29.62 |
Deep Sleep (Stage 3) |
28.52 |
17.93 |
39.44 |
25.18 |
Deep Sleep (Stage 4) |
27.50 |
23.45 |
39.57 |
21.85 |
REM Sleep |
22.94 |
17.60 |
42.06 |
25.08 |
3.2 Coherence Analysis
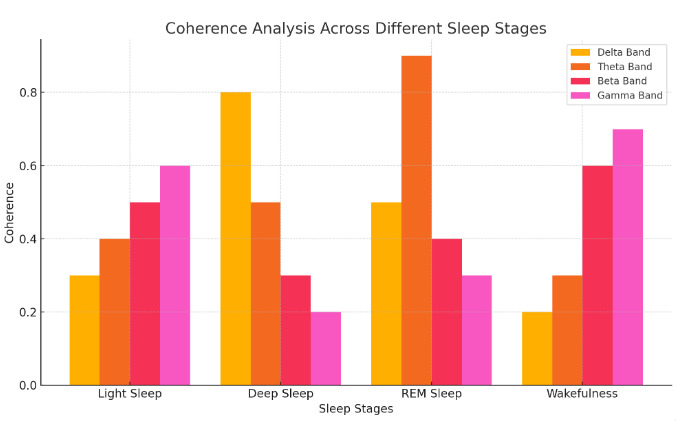
Figure 1. Coherence Analysis Across Different Sleep Stages
Coherence analysis measures the degree of synchronization between EEG signals from different brain regions, providing insights into functional connectivity during sleep [5]. High coherence in delta and theta bands is observed during deep and REM sleep, respectively, indicating strong network interactions. In contrast, reduced coherence in beta and gamma bands is associated with light sleep and wakefulness. Quantitative coherence metrics can reveal disruptions in functional connectivity that may underlie sleep disorders such as insomnia and narcolepsy, as shown in Figure 1. By analyzing coherence patterns, researchers can identify specific neural circuits involved in sleep regulation and develop targeted interventions to restore normal connectivity.
3.3 Phase Synchronization
Phase synchronization analysis examines the alignment of oscillatory phases across different brain regions, offering insights into the temporal coordination of neuronal activity. During deep sleep, high phase synchronization in the delta band reflects the synchronous firing of large neuronal populations, promoting restorative processes. REM sleep, on the other hand, shows high phase synchronization in the theta band, supporting memory consolidation and emotional regulation. Quantitative phase synchronization metrics can be used to track the progression of sleep stages and detect abnormalities in sleep architecture [6]. Mathematical models, such as the Kuramoto model, can simulate phase synchronization dynamics, providing a theoretical framework for understanding the neural basis of sleep.
4 Mathematical Modeling of Sleep Oscillations
4.1 The Ising Model
The Ising model is a mathematical framework used to describe the synchronization dynamics of neuronal populations. The Ising model describes a system of spins on a lattice, where each spin σi can take a value of either +1 (active) or -1 (inactive). The energy E of a given configuration of spins is given by:
\( E=-J\sum_{(i,j)}^{} σ_{i}σ_{j}-h\sum_{i}^{} σ_{i}\ \ \ (1) \)
where \( σ_{i} \) represents the state of the i-th neuron (active or inactive). J is the coupling constant that describes the interaction strength between neighboring neurons. \( \sum_{(i,j)}^{} σ_{i}σ_{j} \) denotes the sum over all pairs of neighboring neurons. h is an external magnetic field representing external influences or stimuli.
In the context of sleep, the Ising model can simulate the transition between different sleep stages by modeling the interactions between excitatory and inhibitory neurons. The model captures the bistable nature of neuronal activity, where neurons can switch between active and inactive states, corresponding to different sleep stages [7]. By fitting the Ising model to empirical EEG data, researchers can predict the onset and duration of each sleep stage and identify factors that influence sleep stability. This approach provides a quantitative understanding of the mechanisms underlying sleep transitions and offers potential targets for therapeutic interventions.
4.2 The Kuramoto Model
The Kuramoto model describes the phase dynamics of coupled oscillators, making it a valuable tool for studying the synchronization of brain oscillations during sleep. This model accounts for the natural frequency of each oscillator and the coupling strength between oscillators, which determine the degree of phase synchronization. By applying the Kuramoto model to EEG data, researchers can simulate the phase relationships between different brain regions and predict the emergence of synchronized oscillatory patterns in different sleep stages. The model provides insights into the temporal coordination of neuronal activity and helps identify the neural mechanisms that support sleep-dependent processes such as memory consolidation and emotional regulation [8].
4.3 Computational Simulations
Computational simulations of brain oscillations during sleep provide a powerful method for testing hypotheses about the neural mechanisms of sleep. By integrating empirical EEG data with mathematical models, researchers can create virtual representations of the brain's oscillatory dynamics and explore the effects of different variables on sleep architecture. These simulations can reveal how changes in neuronal excitability, synaptic plasticity, and network connectivity influence sleep stages and transitions [9]. Computational models also offer a platform for developing and testing novel therapeutic strategies, such as neurostimulation techniques, to enhance sleep quality and treat sleep disorders.
5 Implications for Sleep Disorders
5.1 Insomnia
Insomnia is characterized by difficulty initiating or maintaining sleep, often resulting from hyperarousal and disrupted sleep architecture. Quantitative EEG analysis of insomnia patients reveals reduced power in delta and theta bands, indicating impaired deep and REM sleep. Coherence and phase synchronization analyses show decreased connectivity in sleep-related networks, contributing to fragmented sleep. Mathematical models, such as the Ising model, can simulate the hyperarousal state and predict the impact of therapeutic interventions on sleep stability. These findings highlight the importance of targeting neural mechanisms underlying hyperarousal to improve sleep quality in insomnia patients.
5.2 Sleep Apnea
Sleep apnea is characterized by repeated interruptions in breathing during sleep, leading to frequent arousals and disrupted sleep architecture. EEG analysis of sleep apnea patients shows a reduction in delta power during deep sleep and increased alpha and beta activity, reflecting frequent transitions to lighter sleep stages [10]. Coherence analysis reveals weakened connectivity in respiratory-related networks, while phase synchronization analysis shows disrupted coordination of oscillatory phases. Mathematical models can simulate the impact of apnea events on sleep oscillations and predict the effectiveness of treatments such as continuous positive airway pressure (CPAP) therapy. These insights can guide the development of targeted interventions to restore normal sleep patterns in sleep apnea patients.
5.3 Multi-angle coverage
Narcolepsy is a sleep disorder characterized by excessive daytime sleepiness and sudden transitions into REM sleep. EEG analysis of narcolepsy patients reveals distinct abnormalities compared to healthy individuals. During wakefulness, narcolepsy patients exhibit increased theta and alpha activity, indicating a persistent drowsiness and a failure to maintain typical wakeful states. The abnormal theta activity is particularly pronounced, often leading to microsleeps that can intrude into wakeful periods. These microsleeps are brief, involuntary episodes of sleep that can disrupt cognitive and motor functions, contributing to the daytime sleepiness experienced by narcolepsy patients. One of the hallmark features of narcolepsy is the rapid onset of REM sleep, often occurring within minutes of falling asleep. This contrasts sharply with the typical sleep architecture, where REM sleep is usually reached after 90 minutes of non-REM sleep. In narcolepsy, the rapid transition into REM sleep is accompanied by heightened theta power, which is a signature of REM sleep in general. This phenomenon is believed to result from dysregulation in the hypothalamus, specifically involving the loss of hypocretin-producing neurons. Hypocretin, also known as orexin, is crucial for maintaining wakefulness and regulating REM sleep onset. The deficiency of hypocretin leads to an inability to sustain non-REM sleep, causing frequent and abrupt REM intrusions. Coherence and phase synchronization analyses are advanced methods used to investigate the connectivity and communication between different brain regions during sleep. In narcolepsy patients, these analyses reveal significant disruptions in sleep-wake regulatory networks.
6 Conclusion
Our comprehensive analysis of sleep stages and brain oscillations, through quantitative EEG methods and mathematical models, provides significant insights into the neural mechanisms regulating sleep. The distinct oscillatory patterns observed across different sleep stages highlight the complex interplay of excitatory and inhibitory neuronal interactions. The Ising and Kuramoto models effectively simulate these dynamics, offering predictive capabilities for sleep transitions and stability. The application of coherence and phase synchronization analyses further enhances our understanding of functional connectivity and its disruptions in sleep disorders. These findings underscore the potential of combining empirical and computational approaches to develop targeted interventions for improving sleep quality and treating sleep disorders. Future research should continue to refine these models and explore their applicability in clinical settings to optimize therapeutic outcomes.
References
[1]. Smyth, Clay, et al. "Adaptive Deep Brain Stimulation for sleep stage targeting in Parkinson’s disease." Brain stimulation 16.5 (2023): 1292-1296.
[2]. Lambert, Isabelle, and Laure Peter-Derex. "Spotlight on sleep stage classification based on EEG." Nature and Science of Sleep (2023): 479-490.
[3]. Bakker, Jessie P., et al. "Scoring sleep with artificial intelligence enables quantification of sleep stage ambiguity: hypnodensity based on multiple expert scorers and auto-scoring." Sleep 46.2 (2023): zsac154.
[4]. Abdulla, Shahab, et al. "An intelligent model involving multi-channels spectrum patterns based features for automatic sleep stage classification." International Journal of Medical Informatics 171 (2023): 105001.
[5]. Watanabe, Tatsunori, et al. "Observation of respiration-entrained brain oscillations with scalp EEG." Neuroscience Letters 797 (2023): 137079.
[6]. Ojha, Pooja, and Samhita Panda. "Resting-state quantitative EEG spectral patterns in migraine during ictal phase reveal deviant brain oscillations: Potential role of density spectral array." Clinical EEG and Neuroscience 55.3 (2024): 362-370.
[7]. Acconito, Carlotta, Laura Angioletti, and Michela Balconi. "Visually impaired people and grocery shopping in store: First evidence from brain oscillations electroencephalogram." Human Factors and Ergonomics in Manufacturing & Service Industries 33.3 (2023): 246-258.
[8]. Ingendoh, Ruth Maria, Ella S. Posny, and Angela Heine. "Binaural beats to entrain the brain? A systematic review of the effects of binaural beat stimulation on brain oscillatory activity, and the implications for psychological research and intervention." Plos one 18.5 (2023): e0286023.
[9]. Tatti, Elisa, and Alberto Cacciola. "The role of brain oscillatory activity in human sensorimotor control and learning: bridging theory and practice." Frontiers in Systems Neuroscience 17 (2023): 1211763.
[10]. Trajkovic, Jelena, Alexander T. Sack, and Vincenzo Romei. "EEG-based biomarkers predict individual differences in TMS-induced entrainment of intrinsic brain rhythms." Brain Stimulation (2024).
Cite this article
Wang,D. (2024). Sleep stages and brain oscillations: An in-depth analysis using quantitative and mathematical models. Theoretical and Natural Science,37,15-20.
Data availability
The datasets used and/or analyzed during the current study will be available from the authors upon reasonable request.
Disclaimer/Publisher's Note
The statements, opinions and data contained in all publications are solely those of the individual author(s) and contributor(s) and not of EWA Publishing and/or the editor(s). EWA Publishing and/or the editor(s) disclaim responsibility for any injury to people or property resulting from any ideas, methods, instructions or products referred to in the content.
About volume
Volume title: Proceedings of the 2nd International Conference on Environmental Geoscience and Earth Ecology
© 2024 by the author(s). Licensee EWA Publishing, Oxford, UK. This article is an open access article distributed under the terms and
conditions of the Creative Commons Attribution (CC BY) license. Authors who
publish this series agree to the following terms:
1. Authors retain copyright and grant the series right of first publication with the work simultaneously licensed under a Creative Commons
Attribution License that allows others to share the work with an acknowledgment of the work's authorship and initial publication in this
series.
2. Authors are able to enter into separate, additional contractual arrangements for the non-exclusive distribution of the series's published
version of the work (e.g., post it to an institutional repository or publish it in a book), with an acknowledgment of its initial
publication in this series.
3. Authors are permitted and encouraged to post their work online (e.g., in institutional repositories or on their website) prior to and
during the submission process, as it can lead to productive exchanges, as well as earlier and greater citation of published work (See
Open access policy for details).
References
[1]. Smyth, Clay, et al. "Adaptive Deep Brain Stimulation for sleep stage targeting in Parkinson’s disease." Brain stimulation 16.5 (2023): 1292-1296.
[2]. Lambert, Isabelle, and Laure Peter-Derex. "Spotlight on sleep stage classification based on EEG." Nature and Science of Sleep (2023): 479-490.
[3]. Bakker, Jessie P., et al. "Scoring sleep with artificial intelligence enables quantification of sleep stage ambiguity: hypnodensity based on multiple expert scorers and auto-scoring." Sleep 46.2 (2023): zsac154.
[4]. Abdulla, Shahab, et al. "An intelligent model involving multi-channels spectrum patterns based features for automatic sleep stage classification." International Journal of Medical Informatics 171 (2023): 105001.
[5]. Watanabe, Tatsunori, et al. "Observation of respiration-entrained brain oscillations with scalp EEG." Neuroscience Letters 797 (2023): 137079.
[6]. Ojha, Pooja, and Samhita Panda. "Resting-state quantitative EEG spectral patterns in migraine during ictal phase reveal deviant brain oscillations: Potential role of density spectral array." Clinical EEG and Neuroscience 55.3 (2024): 362-370.
[7]. Acconito, Carlotta, Laura Angioletti, and Michela Balconi. "Visually impaired people and grocery shopping in store: First evidence from brain oscillations electroencephalogram." Human Factors and Ergonomics in Manufacturing & Service Industries 33.3 (2023): 246-258.
[8]. Ingendoh, Ruth Maria, Ella S. Posny, and Angela Heine. "Binaural beats to entrain the brain? A systematic review of the effects of binaural beat stimulation on brain oscillatory activity, and the implications for psychological research and intervention." Plos one 18.5 (2023): e0286023.
[9]. Tatti, Elisa, and Alberto Cacciola. "The role of brain oscillatory activity in human sensorimotor control and learning: bridging theory and practice." Frontiers in Systems Neuroscience 17 (2023): 1211763.
[10]. Trajkovic, Jelena, Alexander T. Sack, and Vincenzo Romei. "EEG-based biomarkers predict individual differences in TMS-induced entrainment of intrinsic brain rhythms." Brain Stimulation (2024).