


1. Introduction
Heart disease is a disease that afflicts many individuals and families. As technology develops and living standards improve, more and more people are paying more attention to their health. In recent years, the incidence of heart disease in many regions has been on the rise, and the loss of life caused by heart disease is also rising year by year. The World Health Organization estimates that 12 million people die of heart disease each year globally. For example, in some developed countries, such as the United States, more than half of the inhabitants die because they suffer from cardiovascular diseases. To reduce the incidence of heart disease and the mortality rate of the population due to heart disease, further targeted interventions should be used to study the factors of heart disease.
First, many researchers believe that reducing the incidence of acute postoperative lung injury in neonates with heart disease can significantly improve child survival [1]. Among adults, many bad lifestyle habits may also be a major factor in the predisposition to heart disease. For example, it has been suggested that the incidence of cardiovascular disease due to smoking is higher in China than in the non-smoking population [2]. Metabolic diseases such as high fasting plasma glucose (HFPG) are significant and risky factors that lead to cardiovascular disease in humans [3, 4]. In China, with the gradual development of the economy, the lifestyle and nutritional structure of the population have changed dramatically, and lifestyle habits such as excessive sugar intake and lack of exercise have led to an increasing prevalence of HFPG [5].
The disease burden of ischemic heart disease (IHD) attributable to HFPG in Chinese residents has obvious gender and age group characteristics. From a gender perspective, all the disease burden indicators of the female population are lower than those of the male group, and the trend of disease burden in the total population is more susceptible to the male group, which may be related to the structure of the female organism [6]. The main reasons for lower life expectancy in men also include behavioral factors such as smoking and alcohol consumption, genetic and physiological factors, and higher rates of injury mortality [7, 8]. However, some findings are contrary to popular belief, that light drinkers are less likely to develop aortic stenosis than never-drinkers [9, 10]. For example, if a person drinks 60 grams of alcohol per day, he may have a lower risk of developing the disease than someone who drinks 10 grams of alcohol per day [9, 10].
Wang et al. have shown in their studies that heart disease is often closely related to disability in the elderly [11]. When older adults were selected for the study, the results showed that the risk of the disease increased twofold for every 10 years of age [12]. In terms of education level, Ni concluded that the risk of developing activity of daily living (ADL) limitations in elderly cardiac patients with elementary school or higher education was 0.666 times higher than that of elderly cardiac patients who had never attended school [13]. Married, cohabiting and educated urban elderly cardiac patients had a lower risk of ADL limitation [13].
In summary, it was initially determined that the prevalence of heart disease is related to several factors such as age, gender, genetic factors, amount of smoking, amount of alcohol consumption, level of education, marital status, and current status of social development. The study will predict which type of patients are most likely to develop heart disease in the future by analyzing given characteristics, comparing differences between patients, and making predictions about future trends, with the ultimate goal of expecting to provide a basis for reducing the incidence of heart disease.
2. Methods
2.1. Data source and description
This study utilizes a dataset provided by the Kaggle platform, which is derived from an ongoing cardiovascular study of residents in the town of Framingham, Massachusetts. The dataset has a total of 4,239 samples, each with 16 variables. Fifteen of the variables are independent, with each variables attribute being a potential risk factor. The last variable “TenYearCHD” is the dependent variable, indicating whether the patient is at risk of having coronary heart disease (CHD) in the next ten years.
2.2. Selection and description of indicators
Among all the variables, both quantitative variables such as “Age”, “CigsPerDay” and categorical variables such as “Male”, “Education” are included. Due to the different types of variables, in this paper, the variables involved in the data will be interpreted according to the type of data. Each quantitative variable is shown in Table 1 and each categorical variable is shown in Table 2.
Table 1. Overview of quantitative variables.
Variable | Description | Range |
Age | Age of the patient | 32-70 |
CigsPerDay | Average number of cigarettes smoked per person per day | 0-70 |
TotChol | Total cholesterol level | 107-696 |
SysBP | Systolic blood pressure | 83.5-295 |
DiaBP | Diastolic blood pressure | 48-142.5 |
BMI | Body Mass Index | 15.54-56.8 |
HeartRate | Heart rate | 44-143 |
Glucose | Gucose level | 40-394 |
Table 2. Overview of categorical variables.
Variable | Description | Range |
Male | Male or Female | Male=1, Female=0 |
Education | Educational situation | Less than high school=1, High school grads=2, College grads=3, Post-college grads=4 |
CurrentSmoker | Currently smoking or not | Yes=1,No=0 |
BPMeds | On blood pressure medication or not | Yes=1,No=0 |
PrevalentStroke | Had a previous stroke or not | Yes=1,No=0 |
PrevalentHyp | Hypertensive or not | Yes=1,No=0 |
Diabetes | Diabetes or not | Yes=1,No=0 |
TenYearCHD | 10 year risk of coronary heart disease | Yes=1,No=0 |
2.3. Method introduction
There are many ways to predict whether or not a patient will suffer from heart disease. However, the predicted results are sometimes very different from the real situation, which is related to whether or not the patient can get timely treatment or even the patient's life, so it is crucial for the patient to make a correct prediction or judgment [14]. Logistic regression belongs to the probabilistic regression model, is a kind of generalized linear model, widely used in probabilistic prediction and classification, has the characteristics of simple, efficient and strong interpretability [15, 16]. In this study, the samples in the above dataset were processed accordingly by using logistic regression, and the results obtained from the processing were further analyzed by observing the results of model fitting, etc., to obtain the main factors influencing the diagnosis of heart disease.
Logistic regression is a type of regression analysis in statistics that is applied to predict the outcome of the dependent variable from predictors or independent variables, where the dependent variable usually refers to categorical dependent variables. Also, in logistic regression, the dependent variable is always binary. Below is the logistic regression equation:
\( P(Y|X)=\frac{{e^{{(β_{0}}+{β_{1}}{X_{1}}+{β_{2}}{X_{2}}+...+{β_{n}}{X_{n}})}}}{1+{e^{({β_{0}}+{β_{1}}{X_{1}}+{β_{2}}{X_{2}}+...+{β_{n}}{X_{n}})}}} \) (1)
\( \frac{P(Y|X)}{1-P(Y|X)}={e^{({β_{0}}+{β_{1}}{X_{1}}+{β_{2}}{X_{2}}+...+{β_{n}}{X_{n}})}} \) (2)
After inserting all the variables, the author gets the following equation:
\( ln(\frac{P(Y|X)}{1-P(Y|X)}={β_{0}}+{β_{1}}Sex+{β_{2}}Age+...+{β_{n}}Glucose \) (3)
Where \( Y \) denotes the explanatory variable, which in the logistic regression model denotes whether or not heart disease is diagnosed. \( X \) denotes the explanatory variable, which in the model is specified as the factors influencing whether or not one has heart disease. \( {β_{i}} \) is the parameter to be estimated.
3. Results and discussion
3.1. Correlation analysis
Figure 1 demonstrates the heat map that can reflect the relationship between the features, through which the correlation between the features can be directly observed. The heat map shows the correlation between every two data, and the value range chosen in this paper is between -1 and 1, i.e., greater than 0 indicates that the two selected data are positively correlated, less than 0 indicates that the two selected data are negatively correlated and equal to 0 indicates that the two selected data are not correlated. The larger the absolute value of the value indicates that the stronger the correlation and vice versa the weaker the correlation. As can be seen from Figure 1, the four variables diaBP, SysBP, PrevalentStroke, and age show positive correlation and larger coefficients than the other variables with TenYearCHD, indicating that they are more intimately related to whether or not the disease is present.
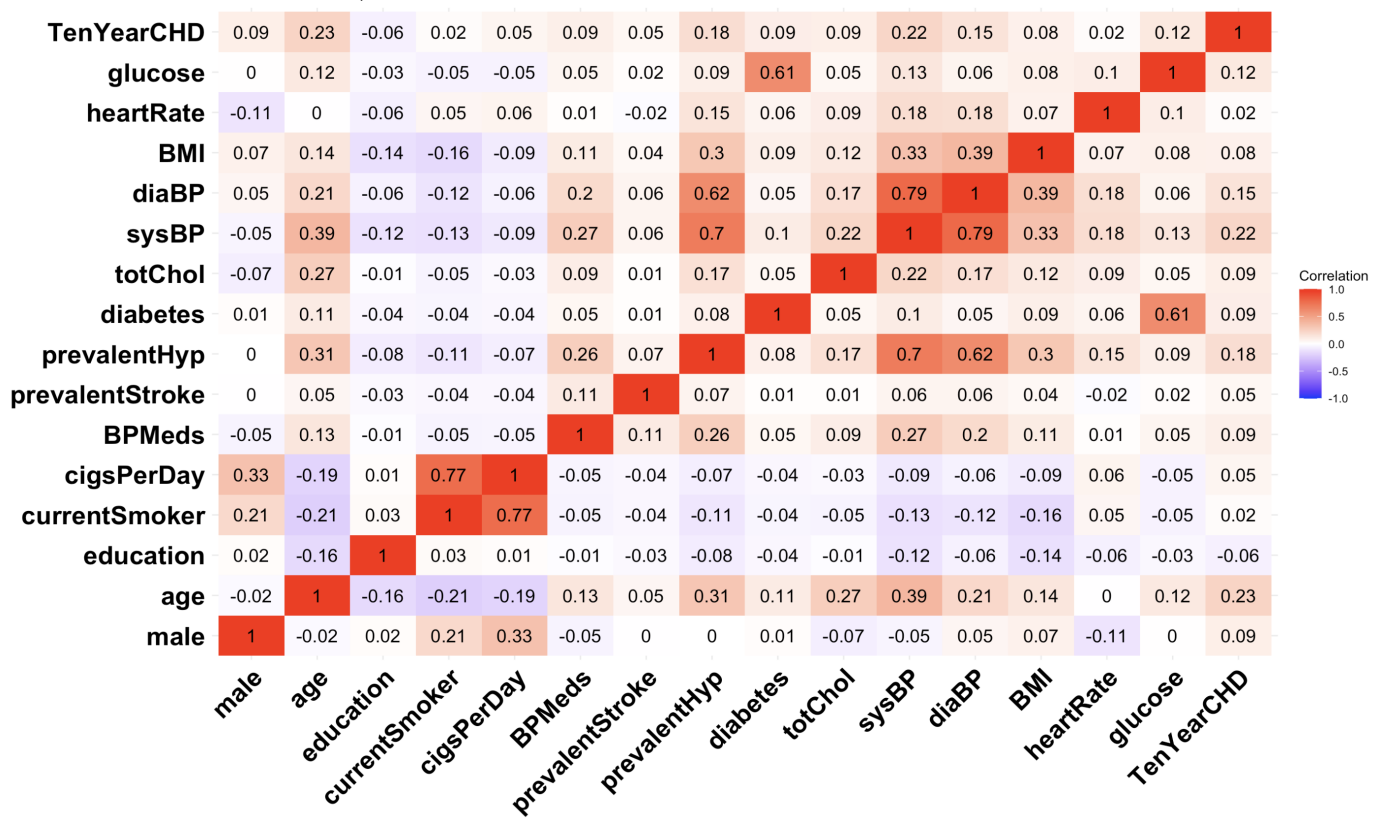
Figure 1. Related heat map.
3.2. Comparison of different models
In this paper, the effectiveness of the logistic regression model is derived by comparing the logistic regression model with two commonly used models named random forest and decision tree. The various models were compared in terms of four indicators: accuracy, precision, recall and F1 value. The results are shown in Table 3. The comparative ROC curves of the three models are plotted in Figure 2.
Table 3. Comparison of three models.
Model | Accuracy | Precision | Recall | F1 |
Logistic regression | 0.835 | 0.538 | 0.057 | 0.104 |
Random forest | 0.831 | 0.438 | 0.057 | 0.101 |
Decision tree | 0.736 | 0.229 | 0.246 | 0.237 |
According to the results of the above three models, no model excels in all aspects, i.e., no model outperforms the other models in all indicators. However, on a comprehensive consideration, the accuracy (0.835) and precision (0.538) of the logistic regression model are in the first place. The recall and F1 values are in second place. According to the ROC curve, the area under the curve (AUC) of this regression is 0.65, which is not the highest, but it's only different from the random forest model by 0.02. This result indicates that the logistic regression model has a good predictive effect on the heart disease data used in the present study, and it is also of great significance for the subsequent prediction of heart disease data used for similar purposes.
It is important to choose the model with better results, and after a comprehensive evaluation, this paper decides to use the logistic regression model for the subsequent research.
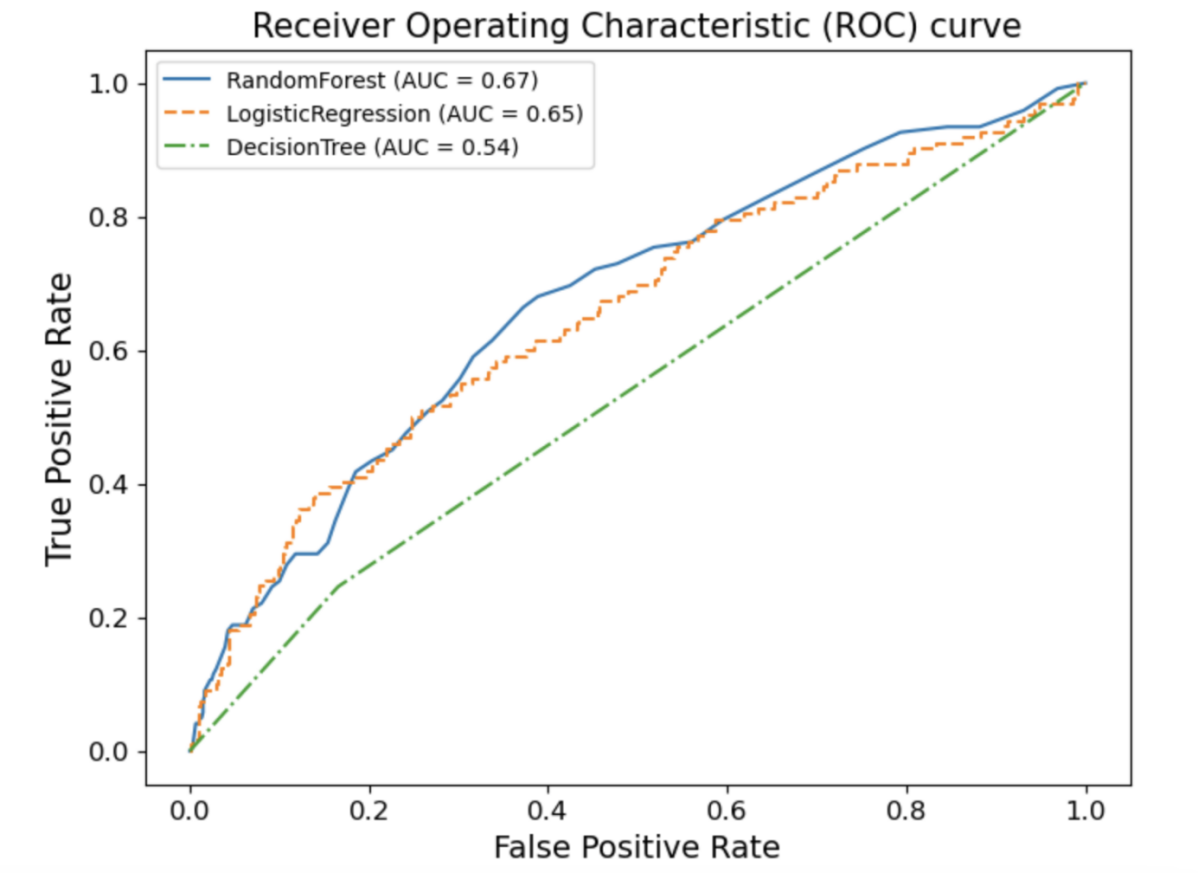
Figure 2. ROC curve of three models.
3.3. Logistic regression results
Before performing the logistic regression, the study requires some data preprocessing steps. Firstly, the missing values are processed, which is done by removing the null values, with the aim of ensuring that the data is clean and usable. The study then divides the processed dataset into two parts: a training set and a test set, where the training set is used to train the logistic regression model, and the test set is used to evaluate the performance of the model (Table 4).
Table 4. Logistic regression results.
Variable | \( β \) | SE | P | OR |
Male | 0.4067 | 0.127 | 0.001 | 1.502 |
Age | 0.0301 | 0.007 | 0.000 | 1.031 |
Education | -0.1665 | 0.057 | 0.004 | 0.847 |
CurrentSmoker | -0.1314 | 0.184 | 0.475 | 0.877 |
CigsPerDay | 0.0226 | 0.007 | 0.002 | 1.023 |
BPMeds | 0.4812 | 0.283 | 0.090 | 1.618 |
PrevalentStroke | 1.5126 | 0.613 | 0.014 | 4.538 |
PrevalentHyp | 0.8944 | 0.151 | 0.000 | 2.446 |
Diabetes | 0.8820 | 0.344 | 0.010 | 2.416 |
TotChol | -0.0003 | 0.001 | 0.835 | 1.000 |
SysBP | 0.0138 | 0.005 | 0.003 | 1.014 |
DiaBP | -0.0242 | 0.008 | 0.001 | 0.976 |
BMI | -0.0531 | 0.015 | 0.000 | 0.948 |
HeartRate | -0.0292 | 0.005 | 0.000 | 0.971 |
Glucose | 0.0011 | 0.003 | 0.673 | 1.001 |
In this study, 15 factors affecting the determination of heart disease were used as independent variables and then performed the binomial logistic regression. The regression results were organized as shown in Table 4. Table 4 gives the estimated values of the parameters, and the mean square error corresponding to the values, in addition to the p-value and OR. Where it is considered significant when p is less than 0.05; the OR value means the result of comparing the probability of a particular probability occurring with the probability of it not occurring, which in this paper is expressed as the ratio of having a heart attack to not having a heart attack in the condition of that independent variable.
3.4. Discussion
From the regression results in Table 4, it can be seen that: male, age, education, cigsPerDay, prevalentStroke, prevalentHyp, diabetes, sysBP, diaBP, BMI and heartRate have a statistically significant (p<0.05) effect on having heart disease, which is inextricably associated with heart disease disease were inextricably linked. On the contrary, currentSmoker, BPMeds, totChol, and glucose did not have a significant effect on the presence of heart disease (p>0.05), they were not the main influencing factors for the final confirmation of heart disease.
According to the positive and negative regression coefficients, there is a negative correlation between the level of education and the ten-year risk of heart attack, indicating that a higher level of education may reduce the risk, which can also be seen in Figure 2. The coefficients for diaBP, BMI, and heartRate are also negative, indicating that these variables have a negative effect on the diagnosis of heart disease. The results also show that gender has a significant effect on the final diagnosis of heart disease, i.e., men may have a higher 10-year risk of heart attack than women, which may be related to the different lifestyles of men and women, for example, far more men than women choose to smoke or drink alcohol in their lives. In addition, the rest of the influencing factors have a positive effect on the ten-year risk of heart attack, with the slopes of age, cigsPerDay, and sysBP being relatively flat, and the slopes of prevalentStroke, prevalentHyp and diabetes being larger, indicating that the above variables affect the final diagnosis of heart disease to varying degrees.
4. Conclusion
Heart disease is an important problem that threatens human health with various factors and it is not easy to cure. To further analyze the causative factors of heart disease, this paper compares multiple models and finally uses logistic regression to model 15 variables that affect heart disease. The model aims to predict the probability of developing coronary heart disease over a ten-year period based on demographics, lifestyle and health-related factors. The results show that male, age, education, cigsPerDay, prevalentStroke, prevalentHyp, diabetes, sysBP, diaBP, BMI and heartRate are important factors in the diagnosis of heart disease. Finally, based on the ROC curve and AUC, it can be seen that the logistic regression model performs well for the prediction of heart disease. It is hoped that the conclusions drawn from this study will be helpful in the field of cardiology, provide reference for both doctors and patients, and gain valuable time to save patients' lives.
References
[1]. Jiang L, Ding S, Zhang L P, et al. 2017 Changes in plasma neutrophil gelatinase-associated lipid transport protein (NGAL) in relation to acute postoperative lung injury in infants and children with congenital heart disease. Advances in Modern Biomedicine, 17(8), 1570-1573.
[2]. Kondo T, Nakano Y, Adachi S, et al. 2019 Efects of tobacco smoking on cardiovascular disease. Circ J, 83(10), 1980-1985.
[3]. Wu S, Xu W, Guan C, et al. 2023 Global burden of cardiovascular disease attributable to metabolic risk factors,1990 -2019: an analysis of observational data from a 2019 Global Burden of Disease study. BMJ Open, 13(5).
[4]. Chia C W, Egan J M, Ferrucci L 2018 Age-related changes in glucose metabolism, hyperglycemia, and cardiovascular risk. Circ Res, 123(7), 886-904.
[5]. Jin Y, So H, Cerin E, et al. 2023 The temporal trend of disease burden at-tributable to metabolic risk factors in China, 1990-2019: an analysis of the Global Burden of Disease study. Front Nutr.
[6]. Huang Y, Li Y L, Yan W T, Wang G, Wang B W, Xie P 2024 Trend Analysis and Future Trend Forecast of Ischemic Heart Disease Burden Attributable to Fasting Hyperglycemia in China, 1990-2019. Chronic Disease Prevention and Control in China, 32(3), 176-182.
[7]. Janssen F, Bardoutsos A, Ei Gewily S, et al. 2021 Future life expectancy in europe taking into account the impact of smoking, obesity and alcohol. ELife.
[8]. Li FW, Wen SJ, Tang QX, et al. 2020 Impact of injury-related deaths on life expectancy in China. Cadernos de saude publica, 36(11).
[9]. Larsson S C, Wolk A, Beck M 2017 Alcohol consumption, cigarete smoking and incidence of aortic valve stenosis. J Intern Med, 282(4).
[10]. Markus M R, Lieb W, Stritzke J, et al. 2015 Light to moderat alcohol consumption is asociated with lower risk of aortic valve sclerosis: the study of health in pomerania (SHIP). Arterioscler Thromb Vasc Biol, 35(5).
[11]. Wang R F, Luo Y, Chen Z S, et al. 2021 Relationship between cardiometabolic co-morbidities and disability in Chinese middle-aged and elderly people. Journal of Jilin University (Medical Edition). 47(3), 761-769.
[12]. Ji H T, Zhao Y X, Yu X Q, Zhang C C, Liu Z D and Chai Q 2023 Effect of smoking and low-density lipoprotein cholesterol interaction on valvular heart disease. Preventive Medicine Forum, 29(1), 46-49.
[13]. Ni Z H 2023 Construction of a predictive model for the risk of limited ability to perform activities of daily living in elderly cardiac patients. Geriatrics research, 4(6), 33-38.
[14]. Zhang X H 2023 Factor Analysis of Heart Disease Diagnosis Based on Logistic Regression and Decision Tree. Modern information technology, 7(7), 117-123.
[15]. Zhang Y Y, Ge R G and Sun G 2020 A study of patients' perceptions of excessive medical examinations and influencing factors based on binary logistics regression. China Health Care Management, 37(12), 893-895+899.
[16]. Yan J J, Wu H, and Han B D 2020 Multifactorial Logistics Regression Analysis of Risk Factors for Residual Cavity Formation after Tuberculous Septic Thorax Surgery. Medical Innovation in China, 17(18), 128-131.
Cite this article
Zhang,Z. (2024). Prediction of heart disease based on logistic regression. Theoretical and Natural Science,41,25-31.
Data availability
The datasets used and/or analyzed during the current study will be available from the authors upon reasonable request.
Disclaimer/Publisher's Note
The statements, opinions and data contained in all publications are solely those of the individual author(s) and contributor(s) and not of EWA Publishing and/or the editor(s). EWA Publishing and/or the editor(s) disclaim responsibility for any injury to people or property resulting from any ideas, methods, instructions or products referred to in the content.
About volume
Volume title: Proceedings of the 2nd International Conference on Mathematical Physics and Computational Simulation
© 2024 by the author(s). Licensee EWA Publishing, Oxford, UK. This article is an open access article distributed under the terms and
conditions of the Creative Commons Attribution (CC BY) license. Authors who
publish this series agree to the following terms:
1. Authors retain copyright and grant the series right of first publication with the work simultaneously licensed under a Creative Commons
Attribution License that allows others to share the work with an acknowledgment of the work's authorship and initial publication in this
series.
2. Authors are able to enter into separate, additional contractual arrangements for the non-exclusive distribution of the series's published
version of the work (e.g., post it to an institutional repository or publish it in a book), with an acknowledgment of its initial
publication in this series.
3. Authors are permitted and encouraged to post their work online (e.g., in institutional repositories or on their website) prior to and
during the submission process, as it can lead to productive exchanges, as well as earlier and greater citation of published work (See
Open access policy for details).
References
[1]. Jiang L, Ding S, Zhang L P, et al. 2017 Changes in plasma neutrophil gelatinase-associated lipid transport protein (NGAL) in relation to acute postoperative lung injury in infants and children with congenital heart disease. Advances in Modern Biomedicine, 17(8), 1570-1573.
[2]. Kondo T, Nakano Y, Adachi S, et al. 2019 Efects of tobacco smoking on cardiovascular disease. Circ J, 83(10), 1980-1985.
[3]. Wu S, Xu W, Guan C, et al. 2023 Global burden of cardiovascular disease attributable to metabolic risk factors,1990 -2019: an analysis of observational data from a 2019 Global Burden of Disease study. BMJ Open, 13(5).
[4]. Chia C W, Egan J M, Ferrucci L 2018 Age-related changes in glucose metabolism, hyperglycemia, and cardiovascular risk. Circ Res, 123(7), 886-904.
[5]. Jin Y, So H, Cerin E, et al. 2023 The temporal trend of disease burden at-tributable to metabolic risk factors in China, 1990-2019: an analysis of the Global Burden of Disease study. Front Nutr.
[6]. Huang Y, Li Y L, Yan W T, Wang G, Wang B W, Xie P 2024 Trend Analysis and Future Trend Forecast of Ischemic Heart Disease Burden Attributable to Fasting Hyperglycemia in China, 1990-2019. Chronic Disease Prevention and Control in China, 32(3), 176-182.
[7]. Janssen F, Bardoutsos A, Ei Gewily S, et al. 2021 Future life expectancy in europe taking into account the impact of smoking, obesity and alcohol. ELife.
[8]. Li FW, Wen SJ, Tang QX, et al. 2020 Impact of injury-related deaths on life expectancy in China. Cadernos de saude publica, 36(11).
[9]. Larsson S C, Wolk A, Beck M 2017 Alcohol consumption, cigarete smoking and incidence of aortic valve stenosis. J Intern Med, 282(4).
[10]. Markus M R, Lieb W, Stritzke J, et al. 2015 Light to moderat alcohol consumption is asociated with lower risk of aortic valve sclerosis: the study of health in pomerania (SHIP). Arterioscler Thromb Vasc Biol, 35(5).
[11]. Wang R F, Luo Y, Chen Z S, et al. 2021 Relationship between cardiometabolic co-morbidities and disability in Chinese middle-aged and elderly people. Journal of Jilin University (Medical Edition). 47(3), 761-769.
[12]. Ji H T, Zhao Y X, Yu X Q, Zhang C C, Liu Z D and Chai Q 2023 Effect of smoking and low-density lipoprotein cholesterol interaction on valvular heart disease. Preventive Medicine Forum, 29(1), 46-49.
[13]. Ni Z H 2023 Construction of a predictive model for the risk of limited ability to perform activities of daily living in elderly cardiac patients. Geriatrics research, 4(6), 33-38.
[14]. Zhang X H 2023 Factor Analysis of Heart Disease Diagnosis Based on Logistic Regression and Decision Tree. Modern information technology, 7(7), 117-123.
[15]. Zhang Y Y, Ge R G and Sun G 2020 A study of patients' perceptions of excessive medical examinations and influencing factors based on binary logistics regression. China Health Care Management, 37(12), 893-895+899.
[16]. Yan J J, Wu H, and Han B D 2020 Multifactorial Logistics Regression Analysis of Risk Factors for Residual Cavity Formation after Tuberculous Septic Thorax Surgery. Medical Innovation in China, 17(18), 128-131.