


1. Introduction
With the increasing environmental awareness, there is growing concern about environmental quality, and people are eager to know whether their surroundings are safe and healthy. Therefore, designing a system capable of real-time environmental quality monitoring is essential. Sensor technology is now highly advanced, enabling precise measurement of various environmental parameters such as temperature, humidity, CO, and PM2.5, providing a solid foundation for designing an environmental monitoring system[1].
In many settings, such as homes, industries, healthcare, and public spaces, monitoring environmental quality is necessary to ensure health and safety. Thus, designing an environmental monitoring system is of practical necessity. Given these essential needs, creating a system capable of real-time environmental quality monitoring is meaningful, providing significant protection and convenience to people and promoting environmental protection efforts.
The environmental monitoring system based on the STM32 platform can monitor multiple environmental parameters in real-time, such as temperature, humidity, air pressure, and light intensity, and further analyze and display the results on an OLED screen. This system is characterized by high precision, strong real-time performance, fast response speed, ease of use, and high reliability, making it applicable across fields such as meteorology, environment, agriculture, and industry, helping people better understand and manage their environment[2]. In summary, this system is an efficient and practical environmental monitoring device that provides timely and accurate environmental data, thereby promoting environmental protection and sustainable development. The system's specific functions include:
CO Monitoring: CO is a toxic and harmful gas, and high concentrations of CO can severely impact human health. The CO monitoring function can track the CO concentration in the environment in real-time, promptly identifying CO pollution and taking action to safeguard human health.
PM2.5 Monitoring: PM2.5 refers to particulate matter in the air with a diameter of 2.5 microns or less, which can penetrate the respiratory system and pose significant health risks. The PM2.5 monitoring function can track PM2.5 concentrations in real-time, enabling timely detection of pollution and intervention to protect human health.
Temperature and Humidity Monitoring: Temperature and humidity are crucial parameters affecting indoor comfort and human health. This function monitors environmental temperature and humidity changes in real-time, helping users adjust indoor conditions to enhance comfort and health levels.
Light Intensity Monitoring: Light intensity is an important parameter affecting indoor lighting and human circadian rhythms. This function monitors changes in environmental light intensity in real-time, helping users adjust indoor lighting conditions to improve comfort and biological rhythms.
By monitoring these four environmental parameters, the system provides real-time insights into indoor environmental changes, assisting users in adjusting indoor conditions to improve comfort and health levels. Additionally, this data can be utilized in environmental pollution monitoring, meteorological research, agricultural production, and other areas, offering broad application prospects[3].
2. Overall System Design (Principle Diagram, Preliminary Sensor Selection)
2.1. Preliminary Sensor Selection
Sensors used in practical applications mainly fall into two categories: analog sensors and digital sensors. Traditional analog sensors offer the advantages of fast measurement conversion speed and a wide temperature measurement range. However, the analog signal processing of analog sensors is complex, and during transmission, these signals are prone to electromagnetic interference, leading to errors. In scenarios requiring multi-point temperature and humidity detection, differences in the wiring distances from the measurement points to the testing device, as well as inconsistencies in the parameters of various sensitive elements, can introduce errors that are difficult to eliminate. Additionally, the accuracy of analog-to-digital conversion systems is inherently limited, exhibiting some non-linearity and poor interchangeability. Using sensors with direct digital output can avoid these issues. Digital sensors can convert the measured analog quantity directly into a digital output, which can be directly interfaced with digital devices (such as computers or digital display systems) and processed by DSPs or computers. These sensors possess high anti-interference capabilities, along with high measurement accuracy and resolution, good stability, easy signal processing, transmission, and automatic control. They are also conducive to dynamic and multi-channel measurement, offering intuitive reading, convenient installation, simple maintenance, and high reliability. Despite the slower response speed and narrower temperature measurement range, digital sensor technology has garnered increasing attention[4].
Considering the system's economic viability and the advantages and disadvantages of sensors, this study opts for four integrated digital sensors.
2.2. Controller Selection
In the design of this environmental monitoring system, the STM32 series microcontroller was chosen as the controller. The STM32 series microcontrollers are well-suited for IoT and embedded systems due to their high performance, low power consumption, extensive peripherals, and excellent scalability[5]. In this design, the STM32 microcontroller serves as the main controller, handling data acquisition and processing via serial communication with various sensors. The processed data is then transmitted to the upper computer through a module, enabling real-time monitoring and remote control of environmental parameters. Additionally, the STM32 microcontroller can control other peripherals, such as an external OLED display screen, which is used for displaying environmental parameter information and other indicators.
2.3. Schematic Diagram
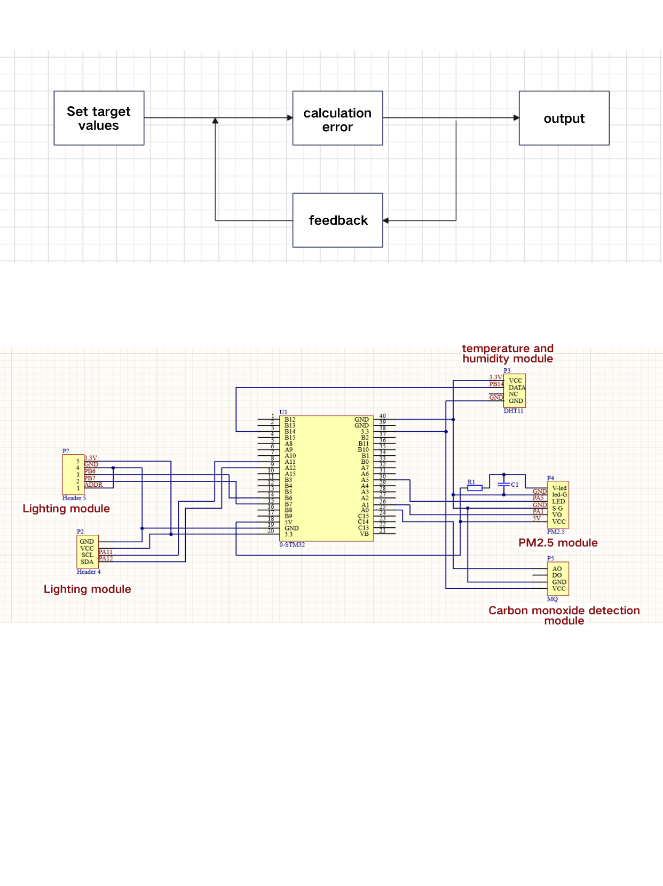
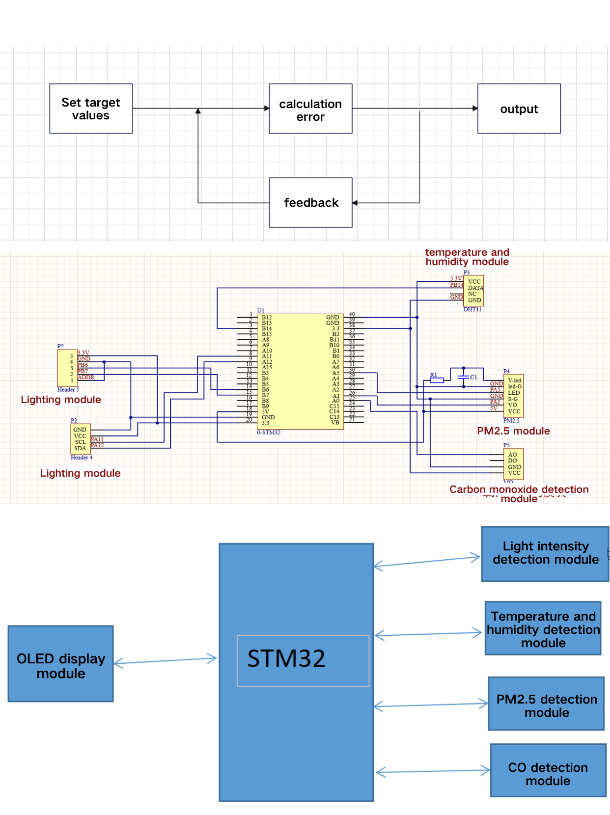
Figure 1. Overall Design Diagram Figure 2. Schematic Diagram
3. Sensor Working Principles, Measurement Algorithms, Circuits, and Installation Methods
3.1. Sensor Module Working Principles
3.1.1. DHT11 Digital Temperature and Humidity Sensor
The DHT11 sensor integrates a resistive humidity sensor and an NTC thermistor-based temperature sensor. When powered, the internal circuits of the DHT11 sensor become operational. Communication between the sensor and an external MCU occurs via a single-wire communication protocol. The external MCU initiates the process by sending a start signal to the sensor, prompting it to begin collecting environmental temperature and humidity data. The humidity and temperature sensors inside the DHT11 then simultaneously measure the environmental humidity and temperature values. The sensor's internal digital signal processing module converts these measurements into digital signals, which are sent to the external MCU through the single-wire protocol. The external MCU decodes and calculates the received digital signals, ultimately outputting the environmental temperature and humidity values. It should be noted that the measurement accuracy of the DHT11 sensor is generally low, with temperature measurement errors reaching up to ±2℃ and humidity measurement errors up to ±5%RH. Additionally, the sensor requires some time for stabilization and response, so calibration and delay handling may be necessary in practical applications. This sensor can be used in HVAC, dehumidifiers, test and measurement equipment, consumer goods, automotive, automatic control, data loggers, weather stations, home appliances for temperature and humidity regulation, medical, and other related humidity detection and control applications.
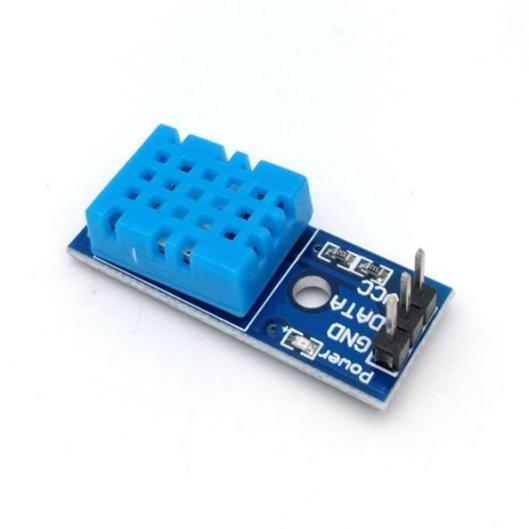
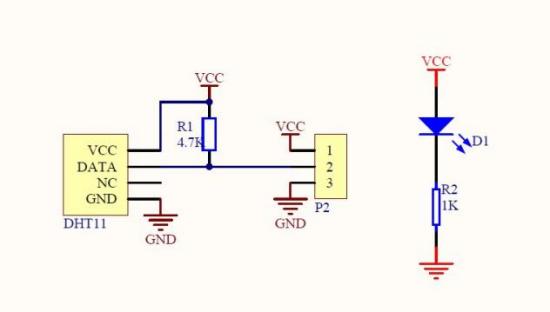
Figure 3. Internal Schematic and Physical Diagram of the DHT11 Digital Temperature and Humidity Sensor
Table 1. Functional Parameters of the DHT11 Temperature and Humidity Module
Product Feature | Detects ambient humidity and temperature |
Sensor | DHT11 |
Humidity Measurement Range | 20%-95% (0℃-50℃ range) with ±5% error |
Temperature Measurement Range | 0℃-50℃ with ±2℃ error |
Operating Voltage | 3.3V-5V |
Output Type | Digital output |
Mounting Bolt Hole | Yes (Hole diameter 3.1mm, 10mm from edge) |
PCB Size | 32mm x 14mm |
Power Indicator Light | Red |
Weight per Set | Approximately 8g |
3.1.2. BH1750FV Light Sensor
The BH1750FV sensor integrates a photodiode and a digital signal processing chip internally. The photodiode converts external light into an electrical signal, which is then amplified and filtered by the digital signal processing chip before being converted into a digital signal. The BH1750FV sensor supports various measurement modes and accuracy settings, allowing users to configure it according to their needs. The sensor can operate in both continuous measurement and single measurement modes, with mode and accuracy settings adjustable via the I2C interface. The measured light intensity values are output to an external MCU through the I2C interface. The external MCU decodes and calculates the digital signals received from the sensor to determine the environmental light intensity. It is important to note that the BH1750FV sensor offers high measurement accuracy, with a resolution of up to 0.5 lx. Additionally, the sensor has a rapid response time, providing stable light intensity measurements within a short period.
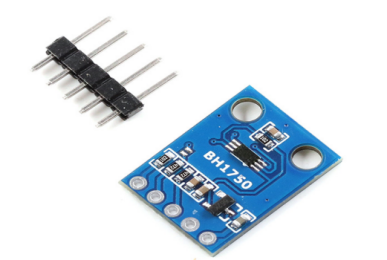
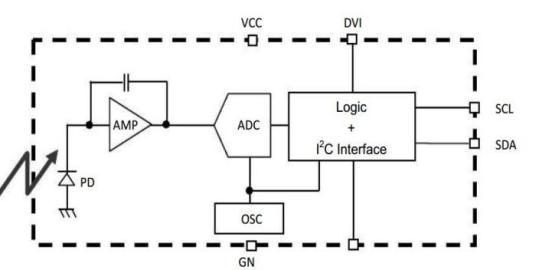
Figure 4. Internal Schematic and Actual Image of the BH1750FV Light Sensor
Table 2. Basic Parameters of the BH1750 Light Intensity Sensor
| |
| |
| |
| |
| |
| |
|
3.1.3. Optical Dust Sensor (GP2Y1010AUOF)
The GP2Y1010AUOF is an infrared optical dust sensor that measures the concentration of dust in the air and outputs an analog signal. The sensor integrates a pair of transmitter and receiver internally. The transmitter emits infrared light, which passes through the airflow in front of the sensor, bringing dust particles into the sensor. When dust enters the sensor, it scatters the infrared light, and some of the scattered light is received by the internal receiver. The receiver then converts the received light signal into an electrical signal, which is processed and amplified before being output.
The output signal of the GP2Y1010AUOF sensor has a linear relationship with the dust concentration, allowing it to be converted into a dust concentration value after calibration and processing. Since the sensor outputs an analog signal, it requires an ADC (Analog-to-Digital Converter) to convert it into a digital signal for further processing and analysis.
It is important to note that the GP2Y1010AUOF sensor has specific performance requirements for measuring dust particles, including its measurement range, sensitivity, and response time. In practical applications, the sensor needs to be selected and calibrated based on the specific use case. The GP2Y1014AU0F variant of this sensor is capable of detecting reflected light from dust particles, including very fine particles such as tobacco smoke. It is commonly used in air purification systems and can measure particles as small as 0.8 micrometers, detecting smoke from tobacco, pollen, and household dust.
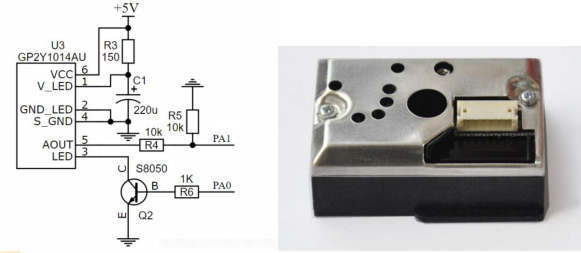
Figure 5. Internal Schematic and Physical Diagram of the BH1750FV and GP2Y1010AUOF Sensors
Table 3. Basic Parameters of the GP2Y1014AU Dust Sensor
Power Supply Voltage: 5-7V |
Operating Temperature: -10 to 65°C Current Consumption: 20mA (Maximum)Small Particle Detection Threshold: 0.8µmSensitivity: 0.5V/(0.1mg/m³) |
Voltage in Clean Air: 0.9V (Typical)Operating Temperature: -10 to 65°CStorage Temperature: -20 to 80°CLifespan: 5 years |
Dimensions: 46mm × 30mm × 17.6mm |
3.1.4. CO (MQ-7) Detection Sensor
The MQ-7 is a carbon monoxide (CO) gas sensor based on the principle of thermal conductivity, capable of measuring the concentration of CO gas in the air and outputting an analog signal. Inside the MQ-7 sensor, there is a heating electrode that heats the surrounding air. The heated air creates convection, making it easier for the CO gas to be absorbed by the sensor.
Additionally, the MQ-7 sensor contains a CO-sensitive electrode, which is coated with a catalyst layer that can adsorb CO gas. When CO gas is adsorbed onto the surface of the sensitive electrode, it causes a change in the electrode's resistance. The internal circuitry of the sensor uses specific algorithms to calculate the concentration of CO gas and converts it into an analog output signal. The output signal voltage is directly proportional to the CO gas concentration.
The sensor's output signal needs to be converted into a digital signal via an AD converter, and then processed and analyzed by a microcontroller or similar control device. Typically, calibration and adjustment of the sensor are necessary to ensure the accuracy and stability of its output signal. It is important to note that the MQ-7 sensor operates within a temperature range of 0℃ to 50℃ and under a relative humidity below 95% RH. In practical applications, it is crucial to select the appropriate sensor and implement necessary environmental controls and calibration based on specific application scenarios.
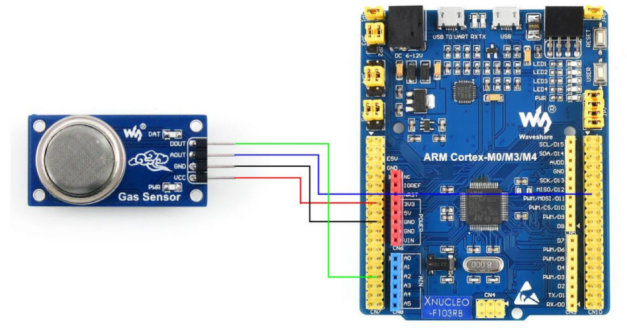
Figure 6. CO Sensor Wiring Diagram
Table 4. MQ-7 Basic Parameters
Functionality Achieved: Testing program included with this versionChip Used: AT89S52Crystal Oscillator: 11.0592 MHzBaud Rate: 9600 |
Electrical Performance: |
Input Voltage: DC 5V |
Power Consumption (Current): 150mA |
DO Output: TTL digital signal 0 and 1 (0.1V and 5V) |
AO Output: 0.1-0.3V (no pollution) high concentration voltage approximately 4V Standard Testing Conditions: |
Temperature: 20°C ± 2°C Humidity: 65% ± 5% RH |
Standard Testing Circuit: Vc:5.0V士0.1V;VH:5.0V 士0.1V |
3.2. Sensor Module Measurement Algorithms
3.2.1. MQ-7 CO Sensor Measurement Algorithm
The MQ-7 CO sensor detects CO concentration through thermal conductivity. The measurement principle of this sensor is based on the chemical reaction between combustible gases and oxygen. By measuring the magnitude of the current generated after the reaction, the CO concentration is determined. The measurement algorithm for this sensor typically uses linear interpolation to convert the sensor's output voltage into CO concentration values, achieving accurate CO concentration measurements.
3.2.2. BH1750FV Light Sensor Measurement Algorithm
The BH1750FV light sensor employs a specialized optical sensing technology to accurately measure ambient light intensity. The measurement algorithm for this sensor usually involves calibration methods, converting the sensor's ADC output values into light intensity values. During calibration, external light sources and photodiodes are used to determine the sensor's sensitivity and calibration parameters, thereby improving measurement accuracy.
3.2.3. DHT11 Digital Temperature and Humidity Sensor Measurement Algorithm
The DHT11 digital temperature and humidity sensor uses a humidity-sensitive element and a temperature sensor to measure environmental temperature and humidity. The measurement algorithm typically involves CRC checking, verifying and processing the sensor's output data to enhance data reliability and accuracy. During the verification process, raw humidity and temperature data are converted into actual humidity and temperature values for precise measurement of environmental conditions.
3.2.4. Optical Dust Sensor GP2Y1010AUOF Measurement Algorithm
The GP2Y1010AUOF optical dust sensor utilizes a scattering optical principle to measure environmental dust concentration. The measurement algorithm commonly employs pulse counting methods, converting the sensor's output pulse signal into dust concentration values. During the conversion process, numerical transformation and calibration are performed based on the sensor's characteristics and calibration parameters to enhance measurement precision and reliability.
4. Control System Design (Simple Software and Hardware Block Diagram)
Microcontroller: The system uses an STM32 series microcontroller to achieve sensor data collection, processing, and storage through programmed software. Timer interrupts are used for periodic data collection, and the ADC module converts analog signals to digital form for data processing and storage. The STM32F103C8T6 microcontroller, based on a 32-bit ARM core, features 64 or 128K bytes of flash memory, USB, CAN, seven timers, two ADCs, and nine communication interfaces. Its key characteristics include strong anti-interference capabilities, making it widely applicable in household appliances, industrial control, instrumentation, security alarms, and peripheral computer devices. The STM32 microcontroller, known for its robust arithmetic processing capabilities, flexible software programming, low power consumption, compact size, low cost, and mature technology, is extensively used in various fields. Given our familiarity with this chip, we have chosen the STM32 for the system control section.
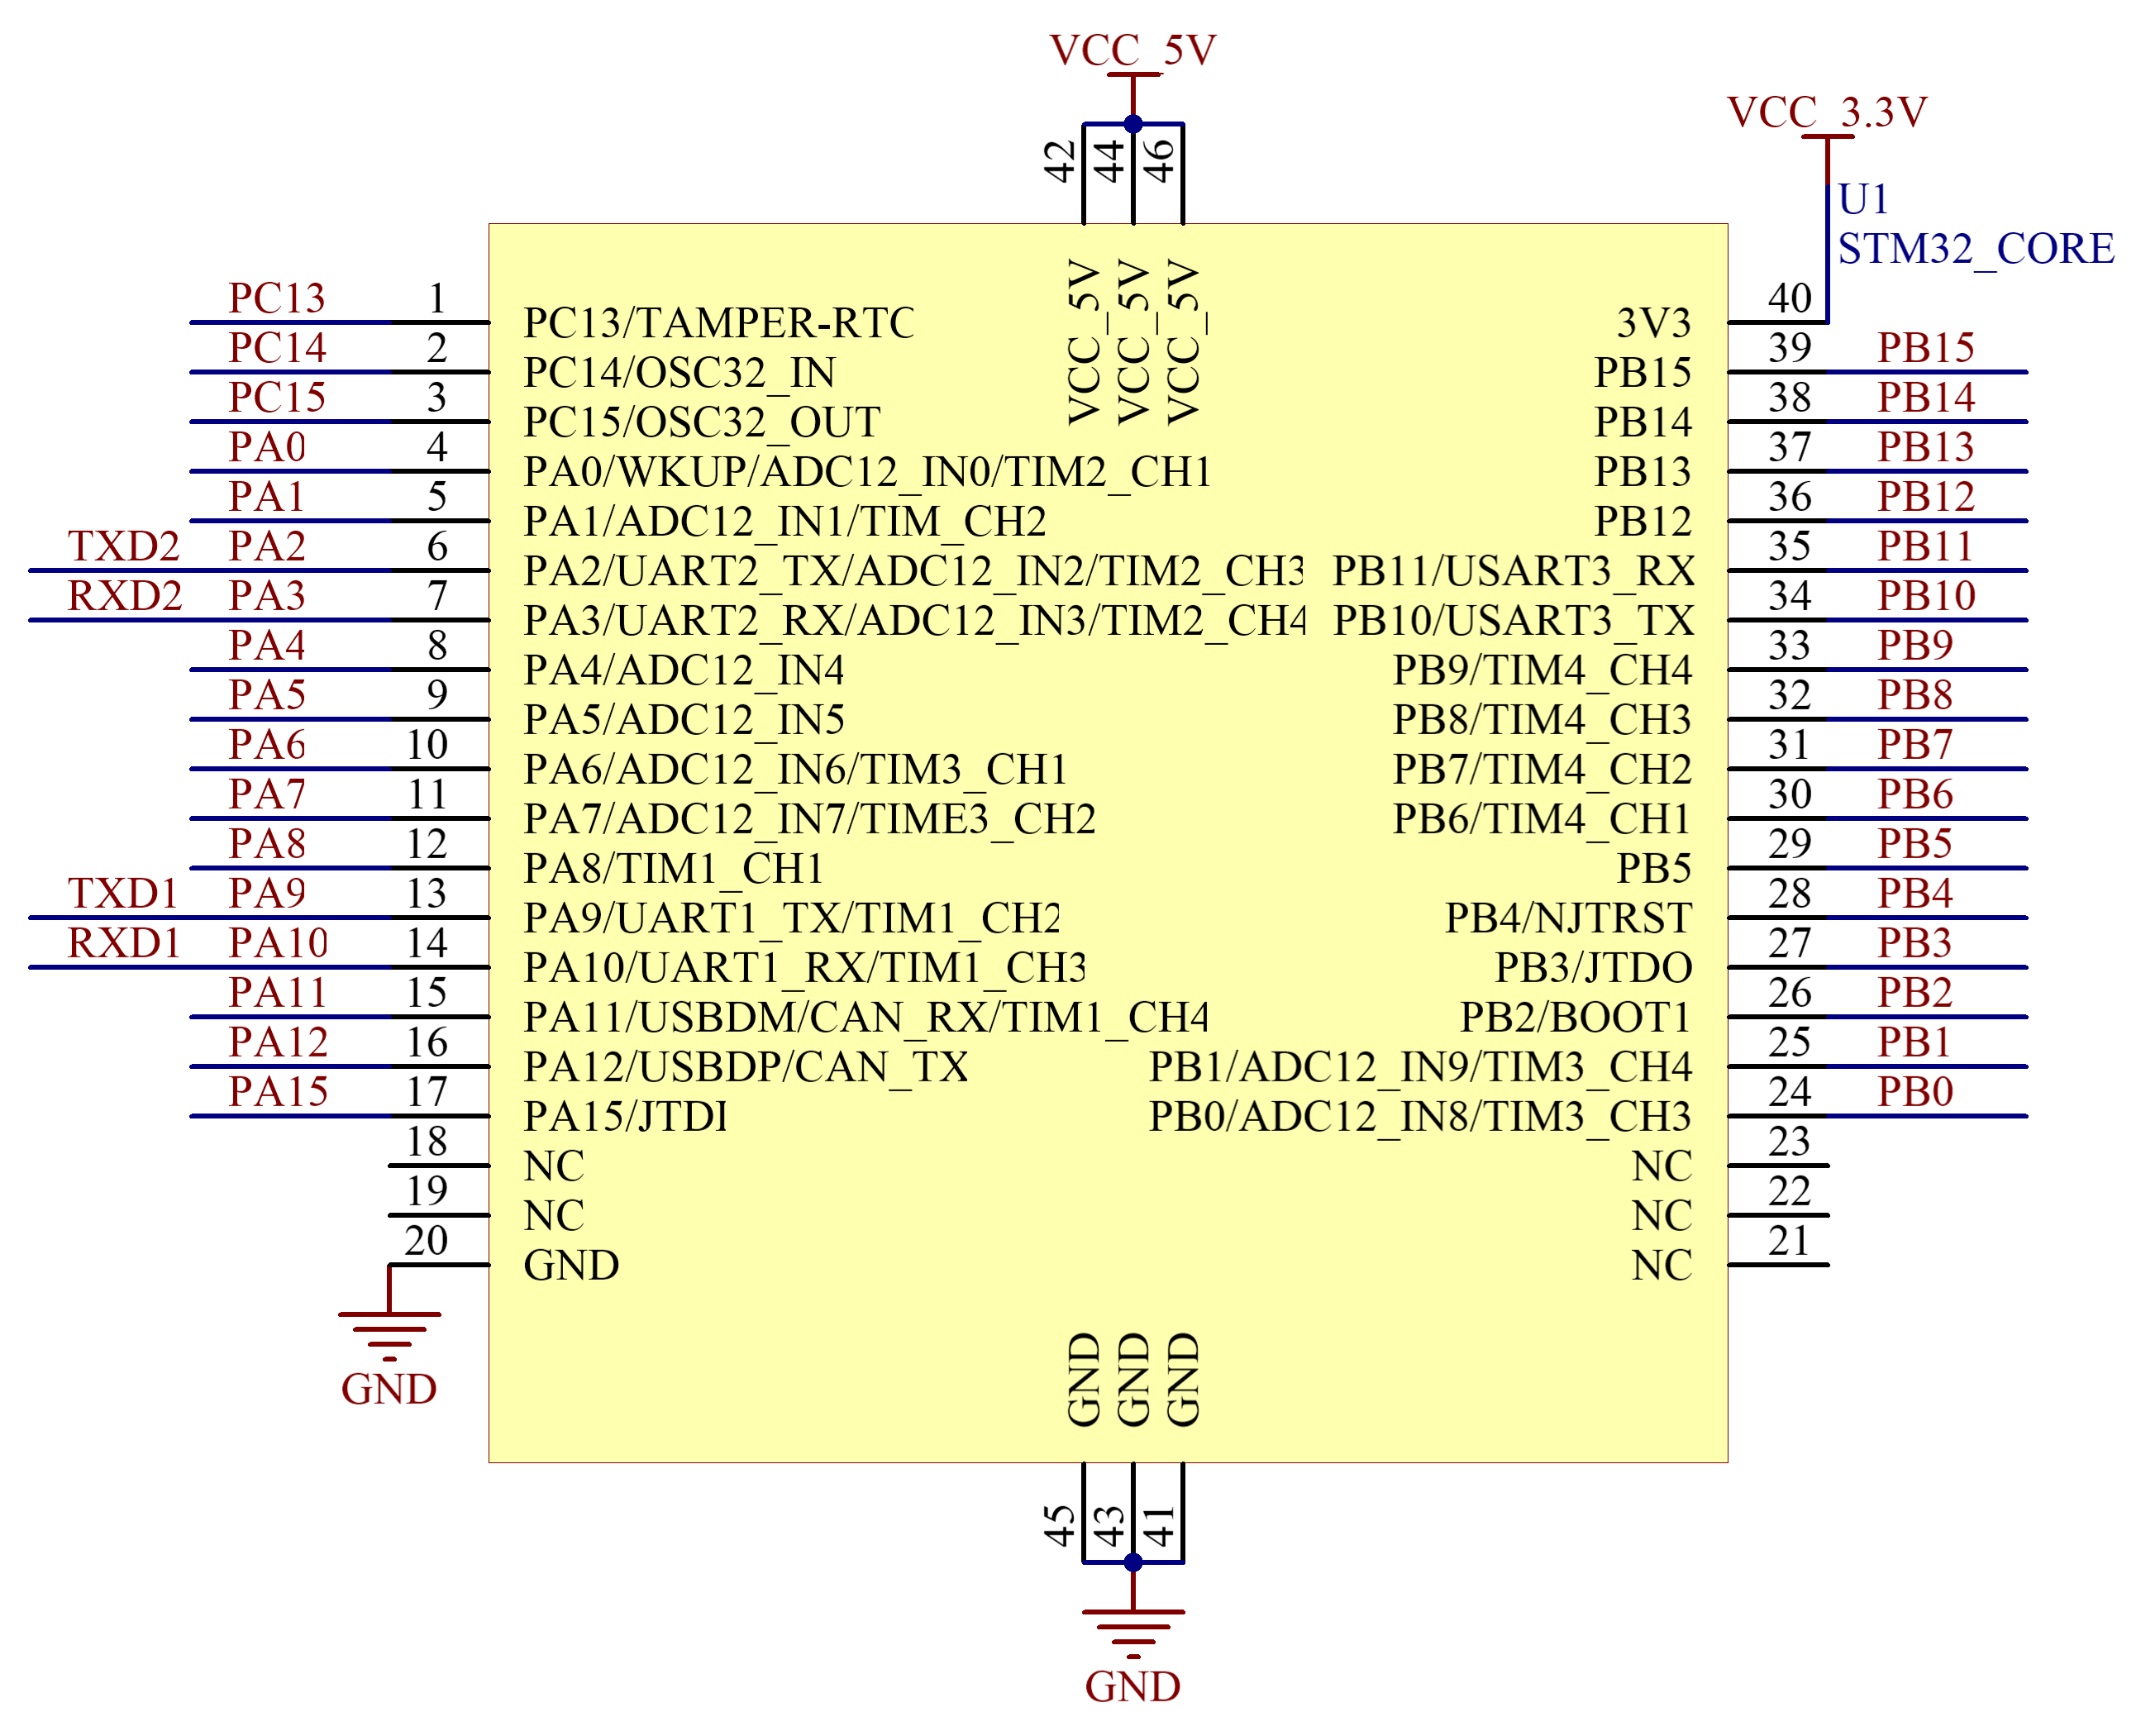
Figure 7. STM32 Pinout Diagram
User Interface: The system employs an OLED screen to display monitored environmental data, allowing users to intuitively view environmental monitoring data and trends.
Sensor Connection Method: The system utilizes the DHT11 digital temperature and humidity sensor, BH1750FV light sensor, GP2Y1010AUOF optical dust sensor, and MQ-7 CO sensor for environmental monitoring. The DHT11 and GP2Y1010AUOF sensors are directly connected to the GPIO ports of the STM32 microcontroller. The BH1750FV sensor is connected via the I2C interface, and the MQ-7 sensor is connected through the analog input port.
Power Supply: The system uses a 5V voltage regulator and an external power adapter to ensure stability and reliability.
Overall, the control system design of this environmental monitoring system has thoroughly considered various factors, enabling efficient and stable operation and accurate and reliable data collection and processing.
The control system of the environmental monitoring system is designed for efficient and stable operation, ensuring that the system operates reliably through proper circuit design and programming, while guaranteeing the accuracy and reliability of monitoring data. Data collection is achieved with appropriate sensor measurement algorithms to ensure accurate and reliable environmental monitoring data, providing a solid foundation for subsequent data analysis and applications. Monitoring data is displayed on the OLED screen, allowing users to clearly understand environmental data and trends. In summary, the control system of this environmental monitoring system is aimed at efficient and stable operation, ensuring the accurate and reliable collection and processing of environmental monitoring data, and presenting it in a user-friendly manner to meet various data transmission needs.
5. Conclusion
This environmental monitoring system, based on the STM32 platform, integrates monitoring functions for CO, PM2.5, temperature and humidity, and light intensity. It employs high-precision sensors and optimized measurement algorithms to ensure accurate and reliable data collection and processing. The control system uses an STM32 microcontroller, equipped with an OLED screen and various data transmission methods, to provide an intuitive user interface and diverse data transmission options. Experimental validation confirms the system's advantages in real-time performance, high precision, and low power consumption, demonstrating its broad application and promotional value. Future improvements will focus on enhancing design and performance, increasing system flexibility and scalability, and providing more comprehensive technical support for the environmental monitoring field. The system can be widely applied in households, industrial settings, medical environments, and public spaces to help monitor and improve indoor and workplace environments, thus enhancing quality of life and health levels.
Future Prospects: Consider incorporating additional environmental parameters such as noise and vibration to meet diverse monitoring needs. Further optimization of the control system design could enhance scalability and reliability, enabling additional functions and application scenarios. Integration with IoT technology for remote monitoring and control can be explored to offer more application scenarios in smart cities and smart homes.
Improvements: While the system currently collects and stores various environmental parameter data, future development will focus on data processing and analysis to extract valuable information and patterns. Incorporating technologies such as artificial intelligence and big data to build models and algorithms for analyzing and predicting environmental data can increase the application value of monitoring data.
System Reliability and Maintenance: The reliability and maintenance of the environmental monitoring system are crucial for future development. Technologies such as automatic calibration and fault diagnosis can be introduced to enhance system reliability and stability. Maintenance can be streamlined through remote upgrades and automatic fault alarms, reducing manpower and time costs.
Application Scenarios and Market Prospects: The current application scenarios of environmental monitoring systems include smart homes, industrial production, and urban environmental protection. There is a broader market potential for future applications. Market research and technological innovation can uncover new application scenarios and business models, expanding the system's market prospects.
System Security: Given the sensitivity of the data collected by the environmental monitoring system, ensuring system security is essential. Measures such as encryption and access control can be implemented to protect data confidentiality and integrity, preventing data leaks and tampering.
In conclusion, continuous technological innovation and application expansion are necessary for the future development of this environmental monitoring system. Enhancing system performance and reliability while addressing market trends and application scenarios will contribute significantly to the advancement of the environmental monitoring field.
Yuhe Tie and Peiming Chen: Conceptualization, Methodology, Software, Resources, Writing- Original draft preparation, Visualization, Investigation.
References
[1]. Sengupta, A., & Sharma, P. (2020). Design and Development of Environmental Monitoring System Using IoT Technology. International Journal of Engineering Research & Technology, 13(2), 45-50. https://www.ijert.org/
[2]. Khan, M. M., & Qureshi, I. A. (2018). STM32 Microcontroller for Industrial Applications. International Journal of Computer Applications, 182(29), 26-32. https://www.researchgate.net/
[3]. Zhang, Z., Liu, X., & Xu, L. (2019). A Review of Environmental Monitoring Technologies for IoT Applications. Sensors, 19(24), 5411. https://www.mdpi.com/
[4]. Wang, Y., & Xie, M. (2021). Smart Environmental Monitoring Systems Using Sensor Networks: A Survey. Sensors, 21(10), 3401. https://www.mdpi.com/
[5]. Kang, S., Kim, Y., & Park, S. (2021). “Design and Implementation of an IoT-Based Temperature and Humidity Monitoring System Using STM32 Microcontroller.” Sensors, 21(1), 141.
Cite this article
Tie,Y.;Chen,P. (2024). Environmental monitoring system design based on STM32 platform. Theoretical and Natural Science,41,145-153.
Data availability
The datasets used and/or analyzed during the current study will be available from the authors upon reasonable request.
Disclaimer/Publisher's Note
The statements, opinions and data contained in all publications are solely those of the individual author(s) and contributor(s) and not of EWA Publishing and/or the editor(s). EWA Publishing and/or the editor(s) disclaim responsibility for any injury to people or property resulting from any ideas, methods, instructions or products referred to in the content.
About volume
Volume title: Proceedings of the 2nd International Conference on Mathematical Physics and Computational Simulation
© 2024 by the author(s). Licensee EWA Publishing, Oxford, UK. This article is an open access article distributed under the terms and
conditions of the Creative Commons Attribution (CC BY) license. Authors who
publish this series agree to the following terms:
1. Authors retain copyright and grant the series right of first publication with the work simultaneously licensed under a Creative Commons
Attribution License that allows others to share the work with an acknowledgment of the work's authorship and initial publication in this
series.
2. Authors are able to enter into separate, additional contractual arrangements for the non-exclusive distribution of the series's published
version of the work (e.g., post it to an institutional repository or publish it in a book), with an acknowledgment of its initial
publication in this series.
3. Authors are permitted and encouraged to post their work online (e.g., in institutional repositories or on their website) prior to and
during the submission process, as it can lead to productive exchanges, as well as earlier and greater citation of published work (See
Open access policy for details).
References
[1]. Sengupta, A., & Sharma, P. (2020). Design and Development of Environmental Monitoring System Using IoT Technology. International Journal of Engineering Research & Technology, 13(2), 45-50. https://www.ijert.org/
[2]. Khan, M. M., & Qureshi, I. A. (2018). STM32 Microcontroller for Industrial Applications. International Journal of Computer Applications, 182(29), 26-32. https://www.researchgate.net/
[3]. Zhang, Z., Liu, X., & Xu, L. (2019). A Review of Environmental Monitoring Technologies for IoT Applications. Sensors, 19(24), 5411. https://www.mdpi.com/
[4]. Wang, Y., & Xie, M. (2021). Smart Environmental Monitoring Systems Using Sensor Networks: A Survey. Sensors, 21(10), 3401. https://www.mdpi.com/
[5]. Kang, S., Kim, Y., & Park, S. (2021). “Design and Implementation of an IoT-Based Temperature and Humidity Monitoring System Using STM32 Microcontroller.” Sensors, 21(1), 141.