


1. Introduction
As the central of the financial market, the volatility of stock market can reflect a country's economic situation, and investors' confidence in the economic outlook. It has a great impact on residents' savings, investment and consumption behaviors under that the economic development trend is stabilizing. Forecasting the changes in the stock market implies the transform in the business cycle to a certain extent. Since the business cycle has significant effects on stock market performance, a cycle has an expected sequence of phases: recovery, expansion, slowdown and contraction [1]. In recovery phase, prices of risky assets will be the first to rise, market participants expect companies to achieve higher profit levels in the future, where stock markets bottom out before the business cycle, so the stock market is considered a leading indicator of the economy. With the unprecedented stimulus measures taken by the U.S. government and the Federal Reserve, American is entering a period of recovery phase. Thus, how to grasp and analyze the trend on stock market has become a focus for all economists and investors.
Stock market, as a forerunner react before the business cycle. The connection between the business cycle and performance of stock market is a topic of unquestionable relevance in the economic literature, Bouri et al. pointed the stock market is a potential predictor of the business cycle proxies [2]. While Si et al. indicated that before slowdown phase the stock market leading the business cycle [3]. Therefore, forecasting the stock market can predict the economic cycle to some extent, and thus seize the opportunity in the market, profit during recovery and expansion phase.
To reduce potential market risks and accurately obtain profits, it was, is and always will be important to predict stocks. Nabipour et al. predicted used tree-based models and neural networks combined with ensemble learning methods to predict four stock market groups [4]. More than that, Ding and Qin proposed a multi-value associated network model of Long Short-Term Memory (LSTM)-based deep-recurrent neural network, which can predict the stock market at an average 95% accuracy level [5]. Besides, Rouf et al. provided more optimized decisions by machine learning to predict the stock market, via big data analysis and deep learning [6]. However, Bustos and Pomares-Quimbaya concluded that deep learning models, in general, have not outperformed traditional models, it is essential to find the type of modeling techniques that are proper for each stock market in developed markets [7].
Dhyani et.al tried to use Autoregressive Integrated Moving Average Model (ARIMA) to analyze the stock market, and successfully predicted the future stock price [8]. To be more specific, ARIMA is a model for applied mathematics analysis, to be used to predict the future trend [9]. Simultaneously, the technology industry became relevant in the financial markets in the past few years, given that the digital trail of individuals’ action of daily lives is recorded by the technology giants, the importance of the markets for data and technology giants have gained [10].
Under such background, the ARIMA model will be used in this paper to predict the American technology stock market according to the daily open price of Apple, Microsoft and Netflix. Thus, it indicates the phase of American business cycle, and provide corresponding suggestions to the market participants, policymakers and academicians.
2. Methods
2.1. Data Source and Description
The data used in this paper is from the Kaggle website (Apple Stock Price, Microsoft Stock Price Dataset, Netflix Stock Price), which consists by historical stock price data for Apple (AAPL), Microsoft (MSFT) and Netflix (NFLX). For this research, choosing the daily open price with 357 observations for each company as the parameter to process the ARIMA model. The open price of Apple, Microsoft and Netflix, which are the highly weighted technology companies in the entire industry, can be served as the indicator to forecast the movement of the technology stock market. It assists in tracking the current trend of the indicator and reflects the daily performance of the technology stock market to some extent.
2.2. Method Introduction
This paper will use ARIMA model to process the time series parameters. This model is from applied mathematics analysis used to make the prediction of the future trend. To process the ARIMA model, the first step is to determine by visual inspection the time series graph is stable. Then, process the ADF test to verifies the time series is stable mathematically. If the parameters are not stationary, take the parameters into first order difference form(d=1), if it is still not stationary taking the parameters into second order difference form(d=2), until the parameters become stationary. After that, process the partial autocorrelation by observed the PACF and ACF graph to determine the ARMA order where the PACF and ACF graph is truncated. Finally, use the ARIMA (p, d, q) model to analyze the trend of the parameters, and output the prediction value via the analyze. For the ARIMA model, the AR(p) can be calculated as:
\( y(t)=c+{ϕ_{1}}*y(t-1)+{ϕ_{2}}*y(t-2)+…+{ϕ_{p}}*y(t-p)+ε(t)\ \ \ (1) \)
The MA(q) can be calculated as:
\( y(t)=c+{θ_{1}}*ε(t-1)+{θ_{2}}*ε(t-2)+…+{θ_{q}}*ε(t-q)+ε(t)\ \ \ (2) \)
Where the \( {ϕ_{1}} \) , \( {ϕ_{2}} \) ,…, \( {ϕ_{p}} \) is autoregressive order, \( {θ_{1}} \) , \( {θ_{2}} \) ,…, \( {θ_{q}} \) is moving average order, c is constant, \( ε(t) \) is the white noise error.
3. Results and Discussion
3.1. Descriptive Analysis
In Table 1, the descriptive statistics of the open price of Apple (AAPL), Microsoft (MSFT) and Netflix (NFLX) from 2022/7/1 to 2023/11/30 stated, which provide the summary of the dataset.
Table 1. Descriptive Statistics.
Description | AAPL(Open) | MSFT(Open) | NFLX(Open) |
Mean | 163.066 | 288.477 | 335.545 |
Standard error | 0.949 | 2.259 | 4.173 |
Median | 163.210 | 282.080 | 331.760 |
Standard deviation | 17.933 | 42.675 | 78.843 |
Variance | 321.587 | 1821.128 | 6216.252 |
Kurtosis | -1.059 | -1.218 | -1.019 |
Skewness | -0.0106 | 0.239 | -0.106 |
Maximum | 196.240 | 383.760 | 479.030 |
Minimum | 126.010 | 217.550 | 170.500 |
The data can be used in ARIMA model only if it is stable, the next step is to analyze through the time series graph to ensure stability of the data.
3.2. Time Series Analyze
Time series graphs are used to view data trends over time, if the series values fluctuate randomly around a constant and the range of fluctuations is bounded, then the series can be determined as stationary. A stationary series is unlikely to have an obvious trend or periodicity.
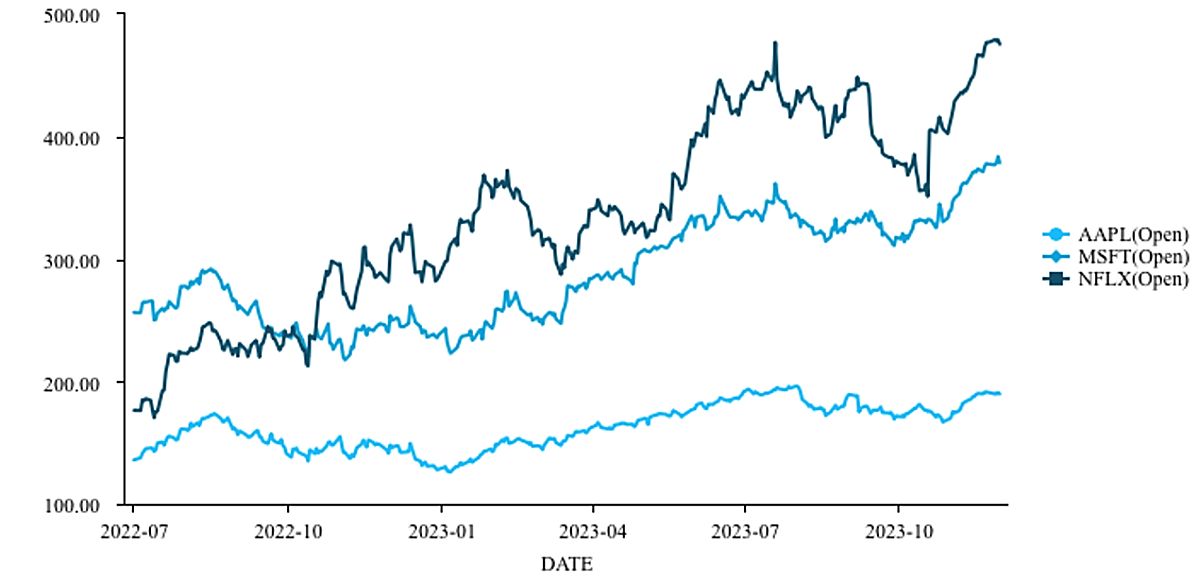
Figure 1. Time series graph with date(x-axis) and prices(y-axis).
In Figure 1, the series of have significant trend goes up, which means for the parameters used in this research are not statable and it cannot be considered as the ARIMA model parameters. Thus, processing the ADF test until the series become statable.
3.3. ADF Test
The ADF test examines the stability of the time series. Theoretically, the null hypothesis is rejected if the p value less than 0.1, which means sequence stationary. If the sequence is unstable, first or second order differences can be performed, and then the ADF test can be conducted until it becomes stable.
Table 2. Original data ADF test Table.
| t | p | critical value | ||
1% | 5% | 10% | |||
AAPL(Open) | -2.008 | 0.597 | -3.984 | -3.423 | -3.134 |
MSFT(Open) | -2.011 | 0.595 | -3.984 | -3.423 | -3.134 |
NFLX(Open) | -2.744 | 0.218 | -3.984 | -3.423 | -3.134 |
Table 2 reveals that the p value of AAPL, MSFT, NFLX are greater than 0.1, the sequence is not stable. In order to make the sequence stable, doing the first order difference ADF test shown in table 3.
Table 3. First order ADF test Table.
| t | p | critical value | ||
1% | 5% | 10% | |||
AAPL(Open) | -19.782 | 0.000 | -3.985 | -3.423 | -3.134 |
MSFT(Open) | -20.244 | 0.000 | -3.985 | -3.423 | -3.134 |
NFLX(Open) | -18.561 | 0.000 | -3.985 | -3.423 | -3.134 |
In Table 3, after the first-order difference, the ADF test results reveal that the p value of AAPL, MSFT, NFLX is equal to 0.000 which is less than 0.01, and the null hypothesis is rejected with over 99% certainty, the sequence is stable. The first order ADF test eliminates the influence of trend item and season item, makes the originally non-stable data become stable, is convenient for subsequent analysis and prediction. This result can be more intuitively presented in Figure 2.
Based on the first order ADF test, the first order time series figures can be easily determined. In Figure 2. It can be observed that the AAPL, MSFT, ELX curves fluctuate roughly up and down a horizontal line, fluctuation amplitude changes little before and after, can be considered as stable over this period.

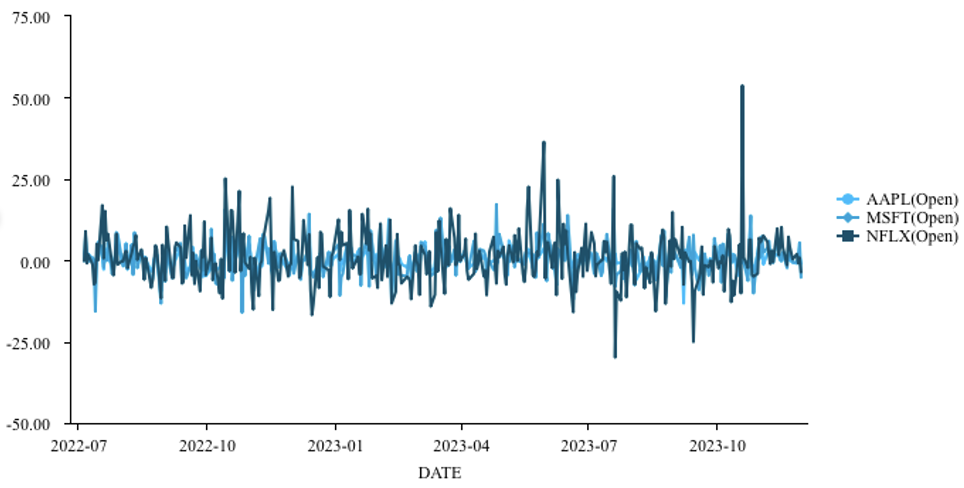
Figure 2. First order Time Series Figures with date(x-axis) and prices(y-axis)
The results reveal the order of the difference(d). Then, doing the partial autocorrelation to determine the AR(p) and the MA(q) used in the ARIMA model.
3.4. ARIMA Model Prediction
Through the partial autocorrelation, the AR(p) of the parameter can be determined by the PACF, which is shown in figure 3.
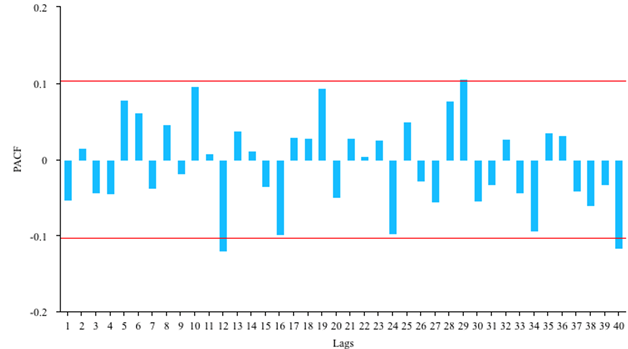
Figure 3. PACF graph of AAPL(Open).
By observed figure 3, the PACF graph of AAPL(Open) truncation at order 12, which indicates that the AR(p) of AAPL(Open) is 12. Similarly, the ACF graph is used to determine the MA(q), shown in figure 4.
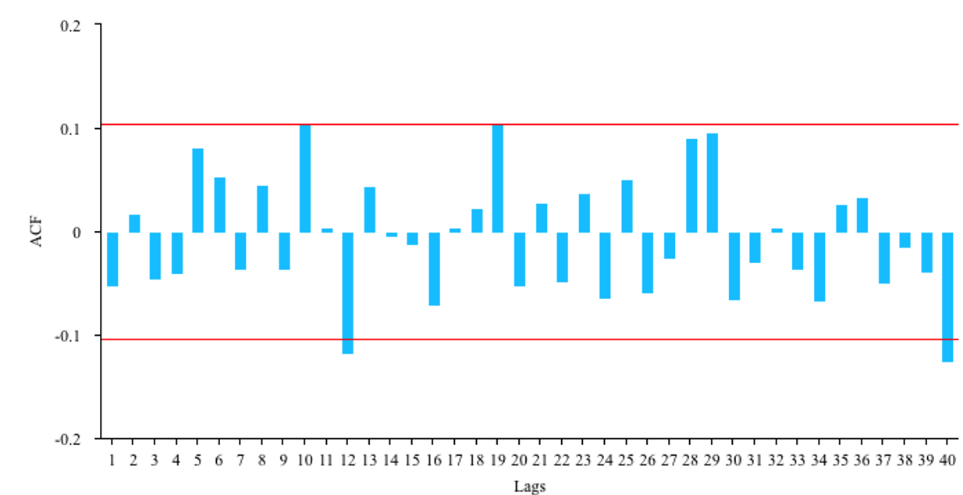
Figure 4. ACF graph of AAPL(Open).
By observed figure 4, the ACF graph of AAPL(Open) truncation at order 12, which indicates that the MA(q) of AAPL(Open) is 12. Thus, the (12,1,12) ARIMA is best fitted for this parameter (Table 4).
Table 4. ARIMA model performance for AAPL(Open).
Model | RMSE | MSE | MAE | MAPE |
ARIMA (8,1,8) | 2.9391 | 8.6386 | 2.382 | 0.0157 |
ARIMA (9,1,9) | 2.5628 | 6.5678 | 1.9635 | 0.0124 |
ARIMA (10,1,10) | 2.5626 | 6.5671 | 1.95 | 0.0123 |
ARIMA (11,1,11) | 2.537 | 6.4364 | 1.9628 | 0.0124 |
ARIMA (12,1,12) | 2.5302 | 6.4019 | 1.9184 | 0.0121 |
Table 4 reveal that the RMSE (root mean square error), MSE (mean square error), MAE (Mean Absolute Deviation) and the MAPE (Mean Absolute Percentage Error), proved that the ARIMA (12,1,12) model is best fitted. According to ARIMA (12,1,12) model parameter table, the model can be calculated as:
\( y(t)=0.051+0.094*y(t-1)-0.082*y(t-2)+…-0.139*ε(t-1)+…\ \ \ (3) \)
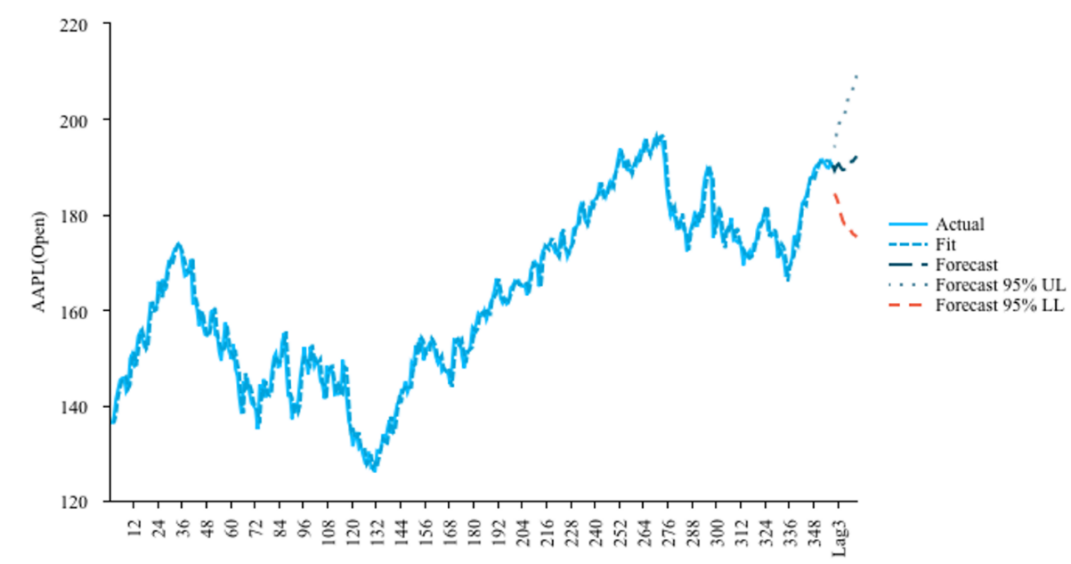
Figure 5. AAPL(Open) ARIMA Model Fit and Forecast with days(x-axis) and prices(y-axis).
Figure 5 illustrates that the actual and the fit line of the AAPL open price(dollar), following by Figure 5. there is a forecast line reveal that the future trend of the AAPL open price, which is a steady upward growth trend. Similarly, for the MSFT(Open), ARIMA (1,1,1) is the best fitted model and the model can be calculated as:
\( y(t)=0.195+0.432*y(t-1)-0.523*ε(t-1)\ \ \ (4) \)
Where the fit and forecast function is shown in Figure 6.
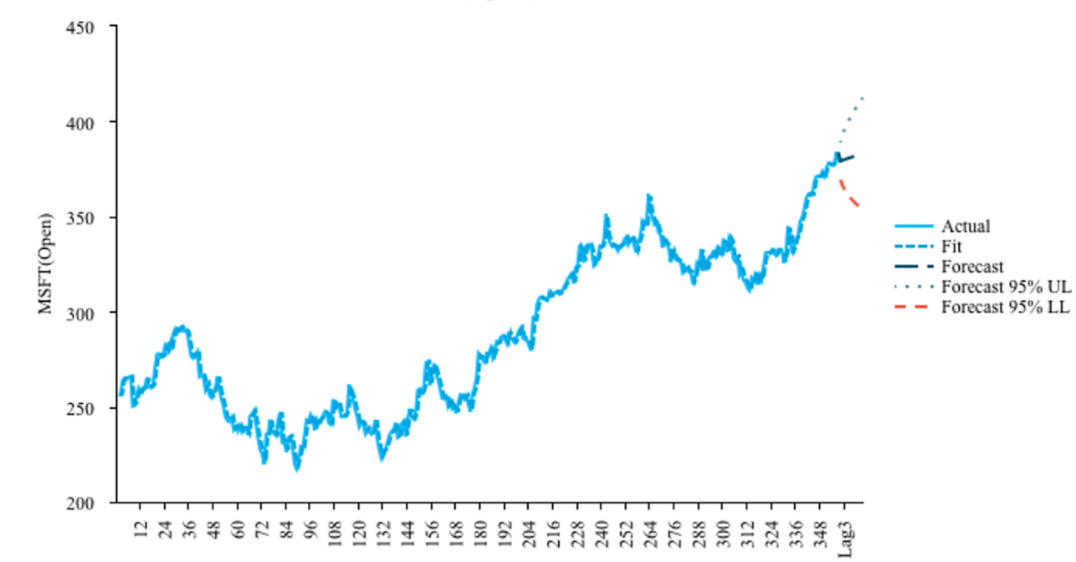
Figure 6. MSFT(Open) ARIMA Model Fit and Forecast with days(x-axis) and prices(y-axis).
Figure 6 illustrates that the actual and the fit line of the AAPL open price(dollar), following by Figure 6, there is a forecast line reveal that the future trend of the MSFT open price, which is a steady upward growth trend. Same with the NFLX(Open), the best model for this parameter is AMIMA (7,1,7), and the model can be calculated as:
\( y(t)=0.433+0.111*y(t-1)+0.629*y(t-2)+…-0.075*ε(t-1)-…\ \ \ (5) \)
Where the fit and forecast function is shown in Figure 7.
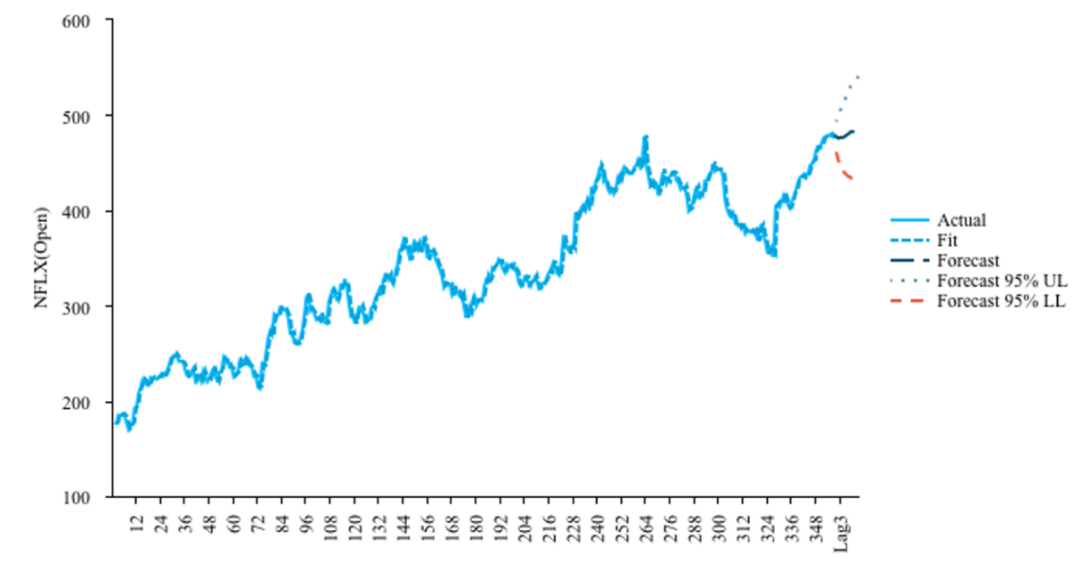
Figure 7. NFLX(Open) ARIMA Model Fit and Forecast with days(x-axis) and prices(y-axis).
Figure 7 illustrates that the actual and the fit line of the AAPL open price(dollar), following by Figure 7. there is a forecast line reveal that the future trend of the NFLX open price, which is a steady upward growth trend.
Based on the ARIMA model, the future stock prices can be predicted, following the forecast line in the figures, where the predicted value for 12 periods is shown in Table 5.
Table 5. Prediction Table (US dollar).
Period | AAPL(Open) | MSFT(Open) | NFLX(Open) |
Lag 1 | 189.241 | 379.079 | 477.234 |
Lag 2 | 190.189 | 379.528 | 475.645 |
Lag 3 | 190.613 | 379.916 | 476.522 |
Lag 4 | 189.850 | 380.279 | 476.404 |
Lag 5 | 189.343 | 380.630 | 477.117 |
Lag 6 | 189.495 | 380.977 | 478.93 |
Lag 7 | 190.645 | 381.321 | 480.154 |
Lag 8 | 191.103 | 381.664 | 482.373 |
Lag 9 | 191.088 | 382.007 | 482.405 |
Lag 10 | 191.135 | 382.350 | 483.588 |
Lag 11 | 191.741 | 382.693 | 483.146 |
Lag 12 | 192.218 | 383.036 | 483.963 |
Table 5 predicts the open price of AAPL, MSFT and NFLX in the future 12 period, which is 12 days after the parameters used in this research. The results have been followed by the forecast in the ARIMA model, the price goes up stably.
3.5. Discussion
Since the parameters (First order difference of AAPL, MSFT and NFLX open price) used in the ARIMA model have passed the ADF test, the AR(p) and the MA(q) have passed the partial autocorrelation, the prediction has a certain degree of credibility. By analyzing the three parameters, there is a highly overlapped trend have shown by the ARIMA model, all of those three models shows that the trend of the stock market goes up. While these three companies occupy a large weight of technology sector, the trend of the three companies stock market can present the entire technology stock market’s trend to some extent. Thus, according to the above conclusion made in this research, the technology stock market is an upward trend, the stock market started recovery.
4. Conclusion
This paper aims to forecast the technology stock market in American by investigated the trend of the technology stock market. More precisely, this research used the ARIMA model based on the Apple, Microsoft and Netflix stock market, although the stock market is not stable, this paper conducts the first order difference to all parameters which made the parameters became stable. Since the predicted stock market performance on the given dates is a close match to the actual price using the ARIMA model, which implies the ARIMA model used in this research is implement successfully and reliably. The overall evidence shows that the trend is going up slowly but stabilize. Market participants and economist could use the results to predict the stock price in the future. Moreover, this paper indicated that American business cycle is undergoing a transition from contraction phase to recovery phase, since stock market is considered a leading indicator of the economy which indicates the investors' confidence in the economic outlook.
This research has both theoretical and practical relevance and the implications derived from this paper's findings are significant. Policymakers and academicians could give considerable attention to formulate policy based on the transition of the business cycle, while investors can profit from predicting stock market trends. Federal Reserve could give the market some positive guidance to accelerate economic recovery. However, this study has several limitations that need to be addressed in the future research. This study has considered only the performance of a few representative stocks to forecast the entire technology stock market’ trend through the ARIMA model, which could not cover all the observations under this study. Thus, it is suggested to consider more macroeconomic variables and more observations in future studies to accurately predict stock prices.
References
[1]. Joseph, A.S. (1939) Business cycles: A theoretical, historical, and statistical analysis of the capitalist process. McGraw-Hill, New York.
[2]. Bouri, E., Demirer, R., Gupta, R. and Sun, X. (2020) The predictability of stock market volatility in emerging economies: Relative roles of local, regional, and global busi- ness cycles. Journal of Forecasting, 39, 957–965.
[3]. Si, D.K. Liu, X.H. and Kong, X.L. (2019) The comovement and causality between stock market cycle and business cycle in China: Evidence from a wavelet analysis, Economic Modelling, 83, 17-30.
[4]. Nabipour, M., Nayyeri, P., Jabani, H., Mosavi, A. and Salwana, E.S.S. (2020) Deep Learning for Stock Market Prediction. Entropy. 22(8), 840.
[5]. Ding, G. and Qin, L. (2020) Study on the prediction of stock price based on the associated network model of LSTM. Int. J. Mach. Learn. & Cyber. 11, 1307–1317.
[6]. Rouf, N., Malik, M.B., Arif, T., Sharma, S., Singh, S., Aich, S., Kim, H.C. (2021) Stock Market Prediction Using Machine Learning Techniques: A Decade Survey on Methodologies, Recent Developments, and Future Directions. Electronics, 10, 2717.
[7]. Bustos, O. and Pomares-Quimbaya, A. (2020) Stock market movement forecast: A Systematic review, Expert Systems with Applications, 156, 113464.
[8]. Dhyani, B., Kumar, M., Verma, P. and Jain, A. (2020) Stock market forecasting technique using arima model. International Journal of Recent Technology and Engineering. 8(6), 2694.
[9]. Pai, P.F. and Lin, C.S. (2005) A hybrid ARIMA and support vector machines model available in stock price forecasting. Omega,33(6), 497-505.
[10]. Koski, H. and, Pantzar, M. (2019) Data Markets in Making: The Role of Technology Giants, ETLA Working Papers, The Research Institute of the Finnish Economy (ETLA), Helsinki.
Cite this article
Liu,C. (2024). Prediction of the Technology Stock Market in American: based on Apple, Microsoft and Netflix. Theoretical and Natural Science,51,26-33.
Data availability
The datasets used and/or analyzed during the current study will be available from the authors upon reasonable request.
Disclaimer/Publisher's Note
The statements, opinions and data contained in all publications are solely those of the individual author(s) and contributor(s) and not of EWA Publishing and/or the editor(s). EWA Publishing and/or the editor(s) disclaim responsibility for any injury to people or property resulting from any ideas, methods, instructions or products referred to in the content.
About volume
Volume title: Proceedings of CONF-MPCS 2024 Workshop: Quantum Machine Learning: Bridging Quantum Physics and Computational Simulations
© 2024 by the author(s). Licensee EWA Publishing, Oxford, UK. This article is an open access article distributed under the terms and
conditions of the Creative Commons Attribution (CC BY) license. Authors who
publish this series agree to the following terms:
1. Authors retain copyright and grant the series right of first publication with the work simultaneously licensed under a Creative Commons
Attribution License that allows others to share the work with an acknowledgment of the work's authorship and initial publication in this
series.
2. Authors are able to enter into separate, additional contractual arrangements for the non-exclusive distribution of the series's published
version of the work (e.g., post it to an institutional repository or publish it in a book), with an acknowledgment of its initial
publication in this series.
3. Authors are permitted and encouraged to post their work online (e.g., in institutional repositories or on their website) prior to and
during the submission process, as it can lead to productive exchanges, as well as earlier and greater citation of published work (See
Open access policy for details).
References
[1]. Joseph, A.S. (1939) Business cycles: A theoretical, historical, and statistical analysis of the capitalist process. McGraw-Hill, New York.
[2]. Bouri, E., Demirer, R., Gupta, R. and Sun, X. (2020) The predictability of stock market volatility in emerging economies: Relative roles of local, regional, and global busi- ness cycles. Journal of Forecasting, 39, 957–965.
[3]. Si, D.K. Liu, X.H. and Kong, X.L. (2019) The comovement and causality between stock market cycle and business cycle in China: Evidence from a wavelet analysis, Economic Modelling, 83, 17-30.
[4]. Nabipour, M., Nayyeri, P., Jabani, H., Mosavi, A. and Salwana, E.S.S. (2020) Deep Learning for Stock Market Prediction. Entropy. 22(8), 840.
[5]. Ding, G. and Qin, L. (2020) Study on the prediction of stock price based on the associated network model of LSTM. Int. J. Mach. Learn. & Cyber. 11, 1307–1317.
[6]. Rouf, N., Malik, M.B., Arif, T., Sharma, S., Singh, S., Aich, S., Kim, H.C. (2021) Stock Market Prediction Using Machine Learning Techniques: A Decade Survey on Methodologies, Recent Developments, and Future Directions. Electronics, 10, 2717.
[7]. Bustos, O. and Pomares-Quimbaya, A. (2020) Stock market movement forecast: A Systematic review, Expert Systems with Applications, 156, 113464.
[8]. Dhyani, B., Kumar, M., Verma, P. and Jain, A. (2020) Stock market forecasting technique using arima model. International Journal of Recent Technology and Engineering. 8(6), 2694.
[9]. Pai, P.F. and Lin, C.S. (2005) A hybrid ARIMA and support vector machines model available in stock price forecasting. Omega,33(6), 497-505.
[10]. Koski, H. and, Pantzar, M. (2019) Data Markets in Making: The Role of Technology Giants, ETLA Working Papers, The Research Institute of the Finnish Economy (ETLA), Helsinki.