


1. Introduction
The infant mortality has long been recognized as a significant marker of a society’s overall health and well-being reflecting both medical care quality and broader social conditions [1]. One of the principal objectives of the United Nations' Sustainable Development Goals is to decrease infant mortality. Goal 3, in particular, which aims to reduce the global neonatal mortality- defined as infants die within the first 28 days after birth-to below 12 per 1,000 live births by 2030 [2]. United States remains the far higher infant mortality rate and other pregnancy related death rates than that of other high-income nations, which indicates possible persistent health disparities in the US [3]. Despite progress made in many parts of the world, according to CDC, though there have been a few minor increases, 2022 marked the first statistically significant rise since 2002 [4]. Different possible socioeconomic factors might also contribute to disparities in infant death rates, in addition to particular medical issues that have an important effect (such as congenital malformations, a medical acronym for birth defects). For instance, in contrast to non-Hispanic White women, African American women experience a three to four times greater danger of dying during childbirth or from complications associated with childbirth [5]. There is also study shows that there was a rising trend in overall term infant mortality as rurality increased, primarily due to higher post-neonatal mortality rates in more rural areas [6].
According to research published in BMC Public Health, more than 60% of deaths in the first week is preventable [7]. To better quantify and diminish risks, many scholars have employed a variety of methods to analyze the factors influencing infant mortality rates. Nasejje used random forest approach tracking socioeconomic factors of under-5 mortality rate(U5MR) in sub-Saharan Africa with a mean C-index value greater than 0.5, suggesting well performing in determining factors of U5MR [8]. Similarly, Jennifer Lee applied random forest model to predict mortality risk for preterm infants with high accuracy of 88% [9]. Okelue utilized CDC Wonder database to analyze the trends and factors associated with infant death [10]. CDC Wonder, created by the Centers for Disease Control and Prevention (CDC), is a comprehensive information and communication platform designed for public health purpose [11]. Inspired by these scholars, in this study, the author will utilize data from the CDC Wonder database, along with a Random Forest model, to identify and quantify the socioeconomic factors influencing infant mortality rates. The importance of these factors will be ranked based on their impact.
2. Methodology
2.1. Data source
The CDC Wide-Ranging Web Data for Epidemiologic Research (CDC WONDER) database, an extensive public health information platform, served as the study's data source. Data encompassed from 2017-2022 years, offering a robust and recent sample for analyzing trends in infant mortality.
2.2. Variable selection
This study aims to rank the importance of various socioeconomic factors, and therefore multiple independent variables have been selected, including the mother's education level, race, and age; the father's education level, race, and age; urbanization status; birthplace; Census Region; Source of Payment for Delivery; and Medical Attendant, among others. Dependent Variable is Infant Mortality Rate. According to CDC, the term “infant mortality” refers to an infant passing away before turning one year old (0-364 days).
2.3. Model selection
In this study, a Random Forest model was chosen for its effectiveness in handling high-dimensional datasets, especially ranking the importance of different socioeconomic factors. The Random Forest ensembles machine learning technique is employed to generate multiple decision trees, and the forecasts are subsequently combined in order to minimize over-fitting and increase precision. Its ability to handle categorical variables allows it to effectively rank the factors based on their contribution to infant mortality.
However, due to the model's limitations, only five factors can be compared at a time. Therefore, the Random Forest model was applied multiple times in this study to analyze various factors. Cross-comparisons were conducted on the higher-weighted factors to further determine their significance.
3. Results and discussion
3.1. Model results
There are three rounds of use of random forest model. Here are the results in Figure 1. In the first round of Random Forest analysis, five economic factors were selected: mother's education level, father's education level, mother's single race, father's single race, and mother's age. The feature importance plot (Figure 1) reveals that mother's education emerged as the most significant factor, with a feature importance score of 0.4, indicating a strong correlation between the mother's education background and infant mortality. Father’s single race ranks the second place with moderate score of 0.25, indicating an important correlation as well.
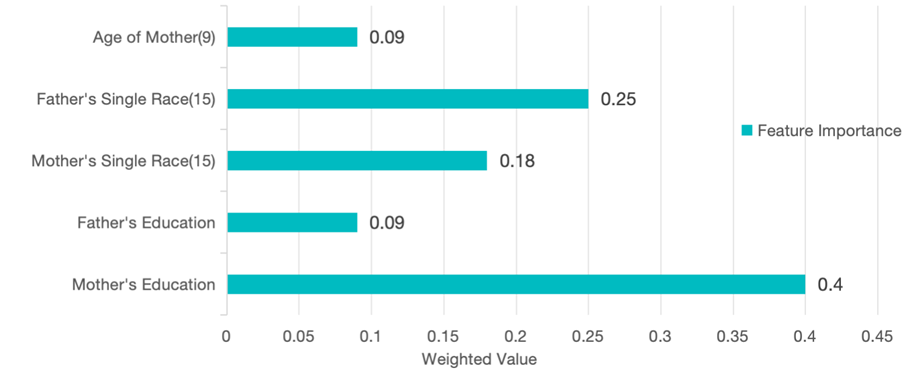
Figure 1. First round: Feature Importance of Five Factors.
As shown in Figure 2 and Table 1, mother’s education level is defined as the most important factor in the first round, this variable was further analyzed to understand its relationship with infant mortality rates. The trend in Figure 2 shows a clear inverse relationship between the mother’s level of education and the infant mortality rate. This result aligns with existing study that higher maternal education is often associated with better access to healthcare, resulting in better child health outcomes.
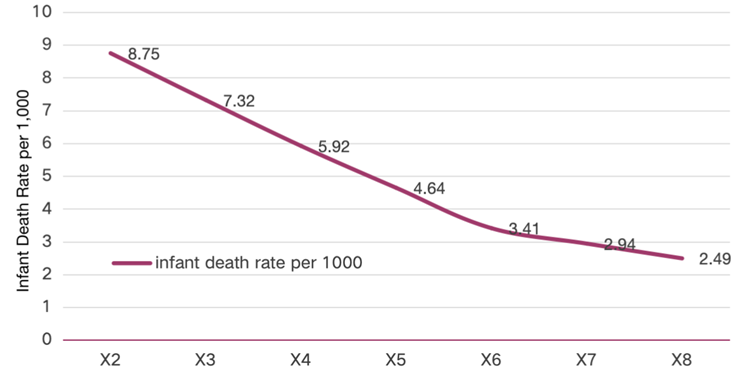
Figure 2. Infant death rate associated with mothers’ education levels
Table 1. Variable explanation
Variable | Description | X1 | 8th grade or less | X2 | 9th through 12th grade with no diploma | X3 | High school graduate or GED completed | X4 | Some college credit, but not a degree | X5 | Associate degree (AA, AS) | X6 | Bachelor’s degree (BA, AB, BS) | X7 | Master’s degree (MA, MS, MEng, MEd, MSW, MBA) | X8 | Doctorate (PhD, EdD) or Professional Degree (MD, DDS, DVM, LLB, JD) |
The result of second round is as below:
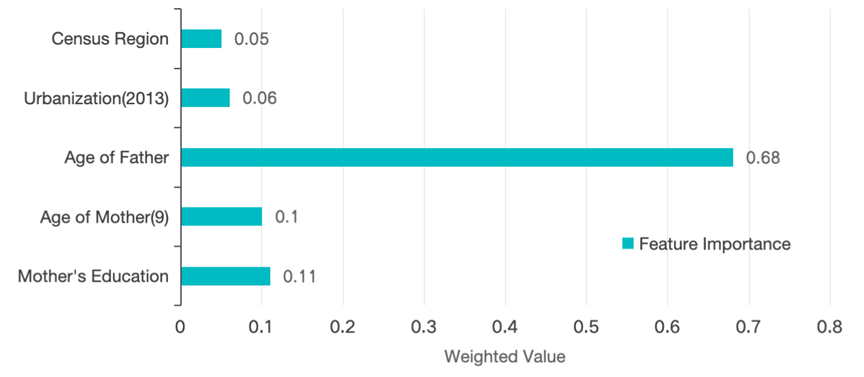
Figure 3. Round 2: Feature Importance of Five Factors
The second round of Random forest analysis, as shown in Figure 3, highlights a significant shift in the influence on infant mortality. Father’s age stands out as the most critical factor, with a feature importance score of 0.68. This finding shows that Infant mortality is significantly influenced by the father's age, with this effect substantially outweighing that of other factors.
In comparison, mother's education level and mother's age both show moderate importance, with scores of 0.11 and 0.10, respectively. While maternal factors are still relevant, the relatively lower importance scores indicate that paternal age has a stronger impact in this model run.
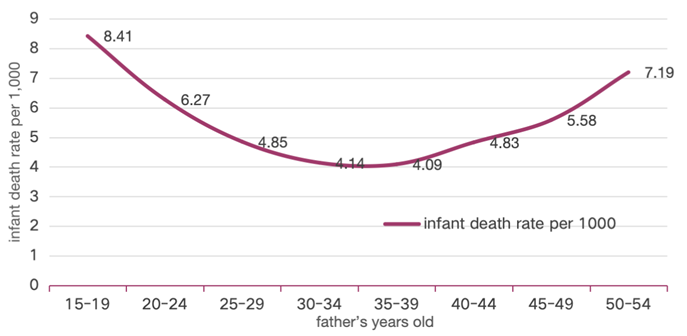
Figure 4. Infant Death Rate Associated with Father’s Age
As further analyze the influence of father’s age, The plot (figure 4) presents a U-shaped relationship between paternal age and infant mortality rates, with rates being highest for fathers in the youngest age group (15-19 years old) and older age groups (above 50 years old). This may suggest that fathers in 30-39 years old tend to be in more stable social, financial, and health situations. The result of third round is shown below:
In the third round of the analysis, as displayed in Figure 5, the birthplace of the infant is the most influential factor, with a feature importance score of 0.51. According to the CDC WONDER database, the infant death rate per 1,000 live births is 5.61 in hospitals, 1.67 in freestanding birth centers, and 6.68 in home births (residences).
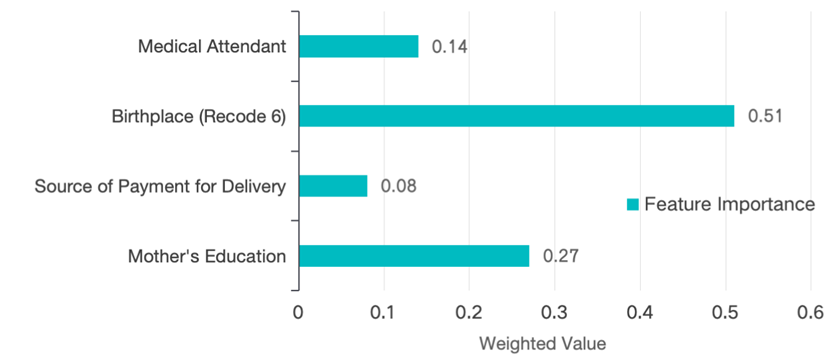
Figure 5. Feature Importance of Four Factors
3.2. Model evaluation
To guarantee the validity of the findings, three independent evaluations of the random forest model were conducted. The evaluation outcomes are listed below.
Table 2. Model Evaluation for Round 1
Metric | Description | Training Set | Test Set | R² Value | Goodness-of-fit index, ranging from 0 to 1; higher is better | 0.985 | 0.81 | Mean Absolute Error (MAE) | L1 loss, average absolute difference between predictions and actual values; lower is better | 0.505 | 1.372 | Mean Squared Error (MSE) | L2 loss, average of the squared differences; closer to 0 is better | 0.697 | 3.494 | Root Mean Squared Error (RMSE) | Square root of MSE, gap measure; lower is better | 0.835 | 1.869 | Median Absolute Deviation (MAD) | Median of the absolute differences; not affected by outliers, lower is better | 0.304 | 1.053 | Mean Absolute Percentage Error (MAPE) | Average percentage error, not affected by outliers, lower is better | 0.099 | 0.084 | Explained Variance Score (EVS) | Measures the variance captured by the model, ranges from 0 to 1; higher is better | 0.985 | 0.813 | Mean Squared Logarithmic Error (MSLE) | Like RMSE, but penalizes larger errors more, lower is better | 0.004 | 0.041 |
In the first round as shown in Table 2, the model shows strong performance overall, with high R² and EVS values and relatively low error metrics (MAE, MSE, RMSE). Though the higher MAE and MAD on the test set suggest that there might be some instances in which the model generalizes effectively to new data, even in cases when the predictions of the model differ from the actual values.
Table 3. Model Evaluation for Round 2
Metric | Description | Training Set | Test Set | R² Value | Goodness-of-fit index, ranging from 0 to 1; higher is better | 0.968 | 0.787 | Mean Absolute Error (MAE) | L1 loss, average absolute difference between predictions and actual values; lower is better | 0.581 | 1.446 | Mean Squared Error (MSE) | L2 loss, average of the squared differences; closer to 0 is better | 0.661 | 4.345 | Root Mean Squared Error (RMSE) | Square root of MSE, gap measure; lower is better | 0.813 | 2.084 | Median Absolute Deviation (MAD) | Median of the absolute differences; not affected by outliers, lower is better | 0.4 | 1.045 | Mean Absolute Percentage Error (MAPE) | Average percentage error, not affected by outliers, lower is better | 0.117 | 0.073 | Explained Variance Score (EVS) | Measures the variance captured by the model, ranges from 0 to 1; higher is better | 0.968 | 0.787 | Mean Squared Logarithmic Error (MSLE) | Like RMSE, but penalizes larger errors more, lower is better | 0.006 | 0.036 |
As can be seen from the Table 3, in the second round, despite the drop in performance, the test set R² value of 0.787 and the explained variance score of 0.787 indicate that the model is still reasonably good at predicting infant mortality on new data. However, the higher test errors (MAE, MSE, RMSE) suggest that there are some large prediction errors in the test set, which suggests that father’s age may be not that predominant.
Table 4. Model Evaluation for Round 3
Metric | Description | Training Set | Test Set | R² | Goodness-of-fit index, ranging from 0 to 1; higher is better | 0.9 | 0.897 | MAE | L1 loss, average absolute difference between predictions and actual values; lower is better | 0.795 | 1.57 | MSE | L2 loss, average of the squared differences; closer to 0 is better | 4.051 | 4.08 | RMSE | Square root of MSE, gap measure; lower is better | 2.013 | 2.02 | MAD | Median of the absolute differences; not affected by outliers, lower is better | 0.294 | 1.508 | MAPE | Average percentage error, not affected by outliers, lower is better | 0.046 | 0.026 | EVS | Measures the variance captured by the model, ranges from 0 to 1; higher is better | 0.901 | 0.901 | MSLE | Like RMSE, but penalizes larger errors more, lower is better | 0.011 | 0.054 |
The model evaluation for round 3 is in Table 4. The model generally performs well, with minimal signs of over-fitting. The close performance on training and test sets, as indicated by R², MSE, and RMSE, suggests the model is reliable.
4. Conclusion
Based on the information discussed in this article, it can be said that the age of the father, the mother's educational attainment, the infant's place of birth, and the father's race are the socioeconomic characteristics that have the biggest effects on infant mortality in the US. For the father's age, its impact on infant mortality shows a U-shaped curve as the father's age increases. Regarding the mother, there is a general negative correlation, meaning that the infant mortality rate goes down with increasing maternal education. As for the place of birth, the mortality rate is significantly lower for infants born in freestanding birth centers, while the mortality rate for home births is slightly higher than that of hospital births.
At the national policy level, the government should focus on above socioeconomic factors influencing infant mortality. First, improving maternal education through greater investment in education, particularly for disadvantaged groups, can significantly reduce infant mortality. For instance, establishing scholarships for women in impoverished areas, offering educational seminars for women who have not completed formal education, and providing free health check-ups for pregnant women. Additionally, expanding the accessibility of high-quality prenatal and postnatal service, especially in rural and underserved areas, is crucial. Given the U-shaped relationship between paternal age and infant mortality, targeted health interventions and education for younger and older fathers are needed. Finally, initiatives to decrease racial disparities in healthcare access and outcomes should also be be given top priority in order to ensure equal opportunities for all families.
References
[1]. CDC 2024 Infant Mortality. Maternal Infant Health, www.cdc.gov/maternal-infant-health/infant-mortality/index.html.
[2]. United Nations 2023 Goal 3: Ensure Healthy Lives and Promote Well-Being for All at All Ages. United Nations Sustainable Development Goals, www.un.org/sustainabledevelopment/health/.
[3]. Gunja M Z, et al. 2023 U.S. Health Care from a Global Perspective, 2022: Accelerating Spending, Worsening Outcomes. The Commonwealth Fund, 31.
[4]. McPhillips D 2024 US Infant Mortality Increased in 2022 for the First Time in Decades. CDC Report Shows, 25.
[5]. Bellazaire A and Erik S 2019 Preventing Infant and Maternal Mortality: State Policy Options. NCSL, 3.
[6]. Mohamoud Y A, et al. 2019 Poverty, Urban-Rural Classification and Term Infant Mortality: A Population-Based Multilevel Analysis. BMC Pregnancy and Childbirth, 19, 22.
[7]. Ivete M K and Iná S S 2023 Contextual, Maternal, and Infant Factors in Preventable Infant Deaths: A Statewide Ecological and Cross-Sectional Study in Rio Grande Do SUL, Brazil. BMC Public Health, 23.
[8]. Nasejje J B, et al. 2022 Use of a Deep Learning and Random Forest Approach to Track Changes in the Predictive Nature of Socioeconomic Drivers of Under-5 Mortality Rates in Sub-Saharan Africa. BMJ Open, 12, 49786.
[9]. Lee J, et al. 2021 Predicting Mortality Risk for Preterm Infants Using Random Forest. Scientific Reports, 11, 31.
[10]. Okobi O E, et al. 2023 Trends and Factors Associated with Mortality Rates of Leading Causes of Infant Death: A CDC Wide-Ranging Online Data for Epidemiologic Research (CDC WONDER) Database Analysis. Cureus, 15, 20.
[11]. Mensch B S, et al. 2019 Evidence for Causal Links between Education and Maternal and Child Health: Systematic Review. Tropical Medicine & International Health, 24, 15.
Cite this article
Chen,Y. (2024). A random forest approach to analyzing socioeconomic influences on U.S. infant mortality. Theoretical and Natural Science,42,105-111.
Data availability
The datasets used and/or analyzed during the current study will be available from the authors upon reasonable request.
Disclaimer/Publisher's Note
The statements, opinions and data contained in all publications are solely those of the individual author(s) and contributor(s) and not of EWA Publishing and/or the editor(s). EWA Publishing and/or the editor(s) disclaim responsibility for any injury to people or property resulting from any ideas, methods, instructions or products referred to in the content.
About volume
Volume title: Proceedings of the 2nd International Conference on Mathematical Physics and Computational Simulation
© 2024 by the author(s). Licensee EWA Publishing, Oxford, UK. This article is an open access article distributed under the terms and
conditions of the Creative Commons Attribution (CC BY) license. Authors who
publish this series agree to the following terms:
1. Authors retain copyright and grant the series right of first publication with the work simultaneously licensed under a Creative Commons
Attribution License that allows others to share the work with an acknowledgment of the work's authorship and initial publication in this
series.
2. Authors are able to enter into separate, additional contractual arrangements for the non-exclusive distribution of the series's published
version of the work (e.g., post it to an institutional repository or publish it in a book), with an acknowledgment of its initial
publication in this series.
3. Authors are permitted and encouraged to post their work online (e.g., in institutional repositories or on their website) prior to and
during the submission process, as it can lead to productive exchanges, as well as earlier and greater citation of published work (See
Open access policy for details).
References
[1]. CDC 2024 Infant Mortality. Maternal Infant Health, www.cdc.gov/maternal-infant-health/infant-mortality/index.html.
[2]. United Nations 2023 Goal 3: Ensure Healthy Lives and Promote Well-Being for All at All Ages. United Nations Sustainable Development Goals, www.un.org/sustainabledevelopment/health/.
[3]. Gunja M Z, et al. 2023 U.S. Health Care from a Global Perspective, 2022: Accelerating Spending, Worsening Outcomes. The Commonwealth Fund, 31.
[4]. McPhillips D 2024 US Infant Mortality Increased in 2022 for the First Time in Decades. CDC Report Shows, 25.
[5]. Bellazaire A and Erik S 2019 Preventing Infant and Maternal Mortality: State Policy Options. NCSL, 3.
[6]. Mohamoud Y A, et al. 2019 Poverty, Urban-Rural Classification and Term Infant Mortality: A Population-Based Multilevel Analysis. BMC Pregnancy and Childbirth, 19, 22.
[7]. Ivete M K and Iná S S 2023 Contextual, Maternal, and Infant Factors in Preventable Infant Deaths: A Statewide Ecological and Cross-Sectional Study in Rio Grande Do SUL, Brazil. BMC Public Health, 23.
[8]. Nasejje J B, et al. 2022 Use of a Deep Learning and Random Forest Approach to Track Changes in the Predictive Nature of Socioeconomic Drivers of Under-5 Mortality Rates in Sub-Saharan Africa. BMJ Open, 12, 49786.
[9]. Lee J, et al. 2021 Predicting Mortality Risk for Preterm Infants Using Random Forest. Scientific Reports, 11, 31.
[10]. Okobi O E, et al. 2023 Trends and Factors Associated with Mortality Rates of Leading Causes of Infant Death: A CDC Wide-Ranging Online Data for Epidemiologic Research (CDC WONDER) Database Analysis. Cureus, 15, 20.
[11]. Mensch B S, et al. 2019 Evidence for Causal Links between Education and Maternal and Child Health: Systematic Review. Tropical Medicine & International Health, 24, 15.