


1. Introduction
The universal adoption of artificial intelligence (AI) technologies has revolutionized industries — and is also shaking up the financial markets. Investors have a lots of interest in AI-related stocks, which are the companies developing or using AI technologies. According to Li, the high performance of AI stocks, which proceeds due to the rapid pace at which these tech startups are developing new technologies tends to also be influenced by changes in regulations and different market moods making their compound forecasts an even more difficult one [1]. Several predictive models have been used to solve this problem, with a growing interest in the use of groupware such as SPSS which were employed for analyzing historical data and predicting future stock performance.
Recent research has focused on forecasting the stock trend smoothly in the AI industry. For example, some research states that external factors have a significant influence on AI-related stocks, and they show unique behavior patterns compared with other types of stocks [2]. Therefore, as researchers explored, several statistical tools and machine learning techniques, such as Autoregressive Integrated Moving Average Model (ARIMA) model, have been applied to stock forecasts to improve prediction accuracy [3]. ARIMA model is a statistical analysis model to which time series data is applied to make sense of a data set or to make predictions about future trends [4].
As shown on Investopedia, stock trend prediction has been the subject of numerous studies in literature and there many approaches have been explored [5]. Traditional financial models are often based on fundamental analysis-earnings, revenue or economics indicators etc. But in the world of AI stocks, where market dynamics can change quickly with a new product innovation or regulations from Congress these models might not cut it [6]. Therefore, according to Tyagi, converging statistical technologies and machine learning algorithms to enhance prediction accuracy is an area of increasing research interest [7]. For instance, according to the research, regression analysis, time series forecasting and clustering techniques have found wide applications in financial data for identifying trends as well predicting future changes [8]. While predictive modeling has come a long way, the eligibility to prepare for AI stock prediction still industry-wise under-explored. The majority of the previous literature either has concentrated on traditional econometric models or machine learning approaches disregarding ARIMA model as a handy financial analysis tool [9]. This work aims to address this research gap by using ARIMA to experts of historical data and make predictions on AI stocks trends. Using advanced statistical methods in ARIMA, this research will provide a down to earth forecasting tool for the trading and investment of AI stocks that can be utilized by investors or financial analysts respectively.
The purpose of this study is that it can help people to have an approximate understanding of the future trends of AI-related stocks and improve the accuracy of the predictions. In addition, with the widespread use of AI in various fields. As Gandhmal and Kumar stated, it is also crucial to study the factors that influence the movement of such stocks, which gives an awareness of what can impact the AI-based stock market [10]. The aim of this study is not only to forecast the stock market through ARIMA time series modeling, but also to provide investors with a reference value in terms of speculation.
In summary, this study will use a time series model to predict the future trend of artificial intelligence stocks, to provide a more accurate and scientific forecast of AI stocks under the context of a highly volatile market. Reviewing existing references and applying advanced statistical modeling techniques, will illustrate a more complete understanding of the development and influencing factors of AI stocks, as well as provide valuable information to investors and help them hold upcoming opportunities.
2. Methodology
2.1. Data source
The data is selected from Yahoo Finance (historical data of International Business Machines Corporation (IBM)). Those data are daily stock price information of IBM from 2019 to 2024, with currency in USD. There are 1258 observations included in the dataset.
2.2. Variable selection
As one of the leading industries that have boomed in recent years, AI-related companies are affected by numerous factors. In addition, due to the unique volatility of the stock market and the irresistibility of the external environment, as well as the instability of AI-related companies, the price of AI-related stocks fluctuates a lot, so its historical data also shows an unstable trend.
As shown in Figure 1, the chart shows the adjusted closing price of IBM stock from 2019 through 2024. the x-axis represents the time period (from mid-2019 to mid-2024), and the y-axis represents the adjusted closing price, which ranges from approximately $80 to $190.
The movement of IBM's stock price reflects the market's expectations for its performance and the industry's outlook. In early 2020, IBM's stock price saw a significant decline, from $100 to nearly $80. This was most likely the impact of COVID-19 on the stock market. Subsequently, IBM's stock price experienced a gradual recovery, reaching around $120-$140 by mid-2021. In early 2022, the stock price continued to increase, exceeding $160, but experienced a decline in mid-2022, falling back to around $120. In early 2024, IBM's stock price was close to $180 and showed a positive uptrend. It was also on an upward trajectory.
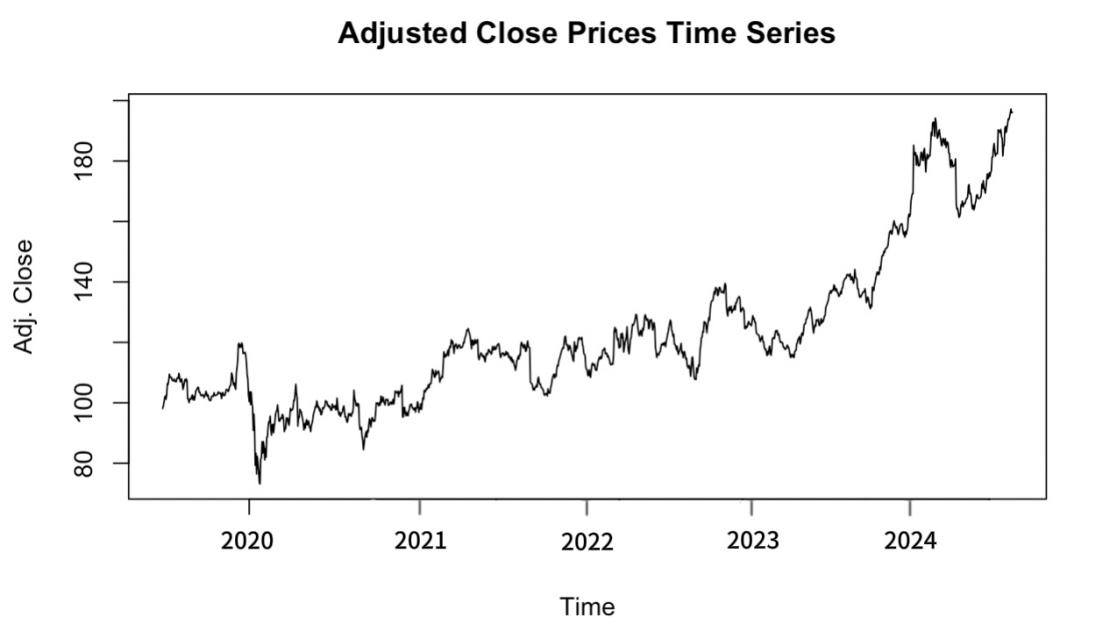
Figure 1. Adjusted Close Prices Time Series
2.3. Method introduction
Autoregressive Integrated Moving Average (ARIMA) model is selected for this AI stock prediction. It is the most common type of statistical model used for time series forecasting. The model can forecast the future trend of time series data and is used to build models that can characterize time series data and provide reference for subsequent research and decision-making.
3. Results and discussion
3.1. Data processing
Autocorrelation Function (ACF) and Partial Autocorrelation Function (PACF) are used to determine the AR and MA terms for the ARIMA model.
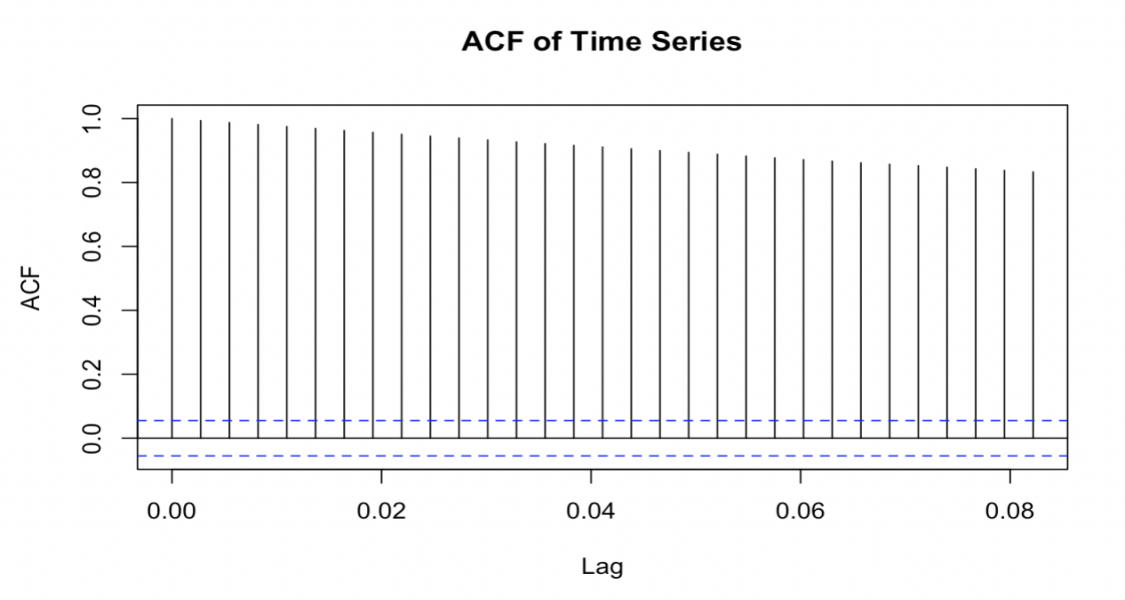
Figure 2. ACF of Time Series
The x-axis in the ACF image indicates the lag and the y-axis is the autocorrelation coefficient (ACF). This ACF plot shows that the time series of IBM stock price remains highly autocorrelated over multiple lags (in the figure, the autocorrelation coefficient is significantly higher than the blue confidence interval line at the beginning). This implies that the current price is strongly influenced by historical prices with some dependence and trend.
For example, in Figure 2, the autocorrelation coefficients are higher in positions such as lag 1 and lag 2, indicating that the price of IBM shows a more pronounced trend, i.e., the past stock price will affect the future stock price.
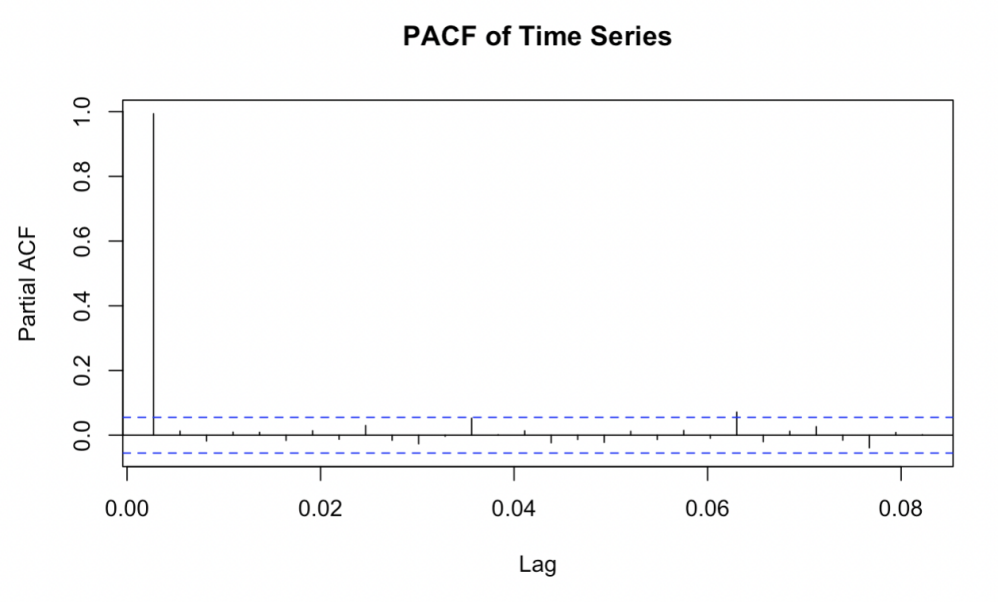
Figure 3. PACF of Time Series
Figure 3 is the Partial ACF (PACF) of the time series of the adjusted closing price of IBM stocks. Similar to the ACF plot, the x-axis represents the lag while the y-axis shows PACF. The PACF plot shows a significant peak at lag 1 (0.8), with the partial autocorrelation coefficients declining rapidly in the immediately following lag, essentially falling within the blue confidence interval, further justifying the use of autoregressive terms in the model. This demonstrates the inclusion of an AR(1) term in the model, indicating that the current value is highly dependent on the immediately preceding value.
Therefore, the autoregressive order (p) of the ARIMA model can be set to 1, while higher-order autoregressive terms contribute less to the forecast. Combining the results of the ACF and PACF plots, it is more appropriate to choose the model structure of ARIMA(1,1,0) or ARIMA(0,1,1).
Three key model error metrics, Mean Absolute Error (MAE), Mean Square Error (MSE), and Root Mean Square Error (RMSE) are listed below the image, respectively as shown in Table 1.
Table 1. MAE, MSE, and RMSE of the model.
Evaluation | Value |
Mean Absolute Error (MAE) | 1.28175 |
Mean Squared Error (MSE) | 34.64 |
Root Mean Squared Error (RMSE) | 27.9 |
These low error metrics indicate that the ARIMA model has a high degree of accuracy in forecasting IBM's stock price. Particularly, the RMSE (1.909888) indicates that the average error between the model's predicted and actual values is about $1.91, which is a small error for a time series with stock prices in the range of $100 to $190. They also indicate that the model is a good fit for the stock price trend and is suitable for practical stock price forecasting and analysis.
3.2. Model evaluation
The PACF plot shows that the time series of ibm stock price can be modeled by a lower order autoregressive process with the most significant effect of lag 1. Based on the ACF and PACF analyses, the ARIMA (1,1,0) model was selected. First-order differencing ensured smoothness, while the AR(1) term matched the autocorrelation observed in the data.
The Root Mean Square Error (RMSE) and the Akaike Information Criterion (AIC) are used to estimate the chosen ARIMA model. The RMSE shows how far predictions fall from measured true values using the Euclidean distance. The AIC weighs the complexity of the estimated model against the goodness of fit of the model to the data. The RMSE shows how far predictions fall from measured true values using Euclidean distance. The smaller the value of these two figures, the better the model fits the data.
Table 2. MAE, MSE, and RMSE of the model.
ARIMA Model | RMSE | AIC |
(1,1,0) | 1.909888 | 5198.88 |
(0,1,1) | 1.90992 | 5198.92 |
(1,1,1) | 1.909643 | 5200.56 |
(2,1,0) | 1.909487 | 5200.35 |
(2,1,1) | 1.909198 | 5201.97 |
(2,1,2) | 1.909141 | 5203.9 |
As Table 2 shows above, it is obvious that the parameters with (1,1,0) and (0,1,1) have the lowest AIC values among the six models. Since the RMSE of (1,1,0) is slightly lower than that of AIC, ARIMA(1,1,0) becomes the ideal model for forecasting.
After fitting the model, the residuals are checked to ensure that they are independent and normally distributed, as required by the ARIMA model. Figure 4 shows the ACF of the residuals, which confirms that there is no significant autocorrelation, suggesting that the model is well-fitted.
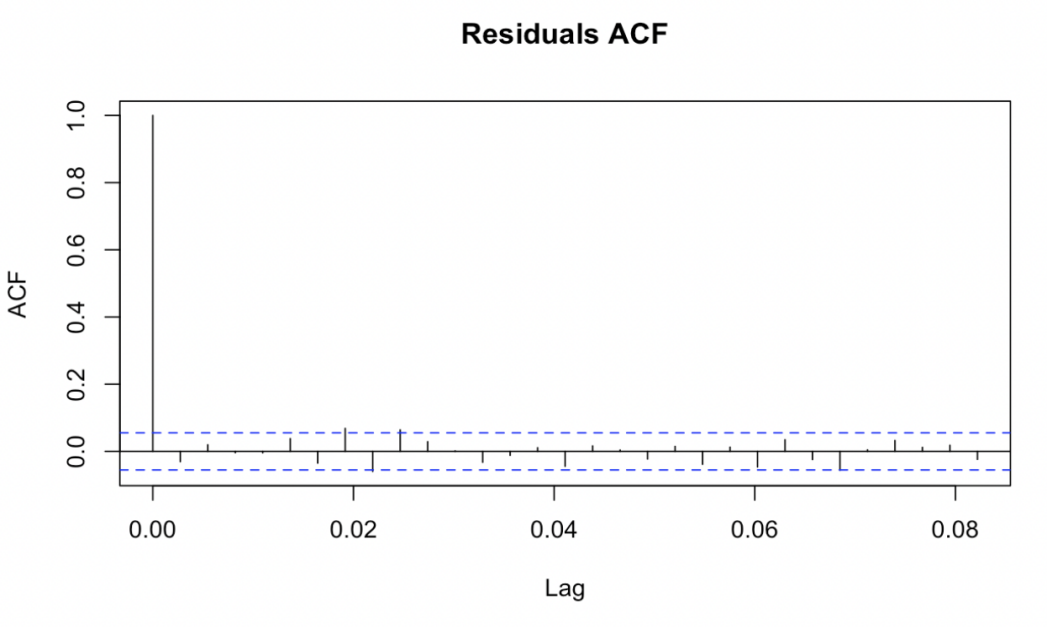
Figure 4. Residuals ACF
The residual ACF only shows a significant peak at the very beginning, and all of them flatten out in the later stages. This proves that the residuals are uncorrelated and that the ARIMA (1,1,0) model successfully matches the underlying structure of the time series. The absence of significant autocorrelation in the residuals suggests that the model is not missing important patterns in the data.
From the time series plot of the residuals, most of the residuals fluctuate around 0 with no significant trend, which indicates the time dependence of the data.
3.3. Forecasting results
The plot shows the ARIMA model's forecast of the future movement of IBM's stock price. By fitting the ARIMA (1,1,0) model, the black line in the graph represents the historical actual data, the blue line represents the forecast, and the gray shaded area represents the range of uncertainty in the forecast, i.e., the confidence interval of the forecast. The confidence interval reflects the uncertainty of the prediction. Over time, the confidence interval becomes larger and larger. Figure 5 shows the forecast values and confidence intervals.
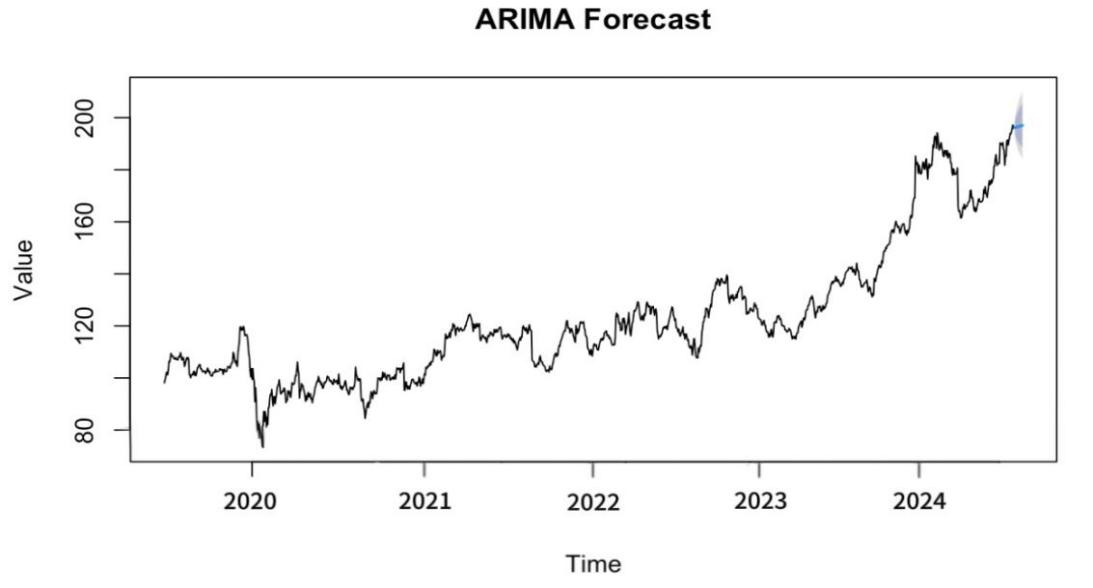
Figure 5. ARIMA Forecast
The stock price action over the forecast period continues the previous upward trend. The blue line corresponds to a forecast value that is consistent with the actual trend, further supporting the previous conclusion of an upward stock price trend. The results indicate that the share price is expected to exceed $200 by the end of 2024. Despite the volatility of the model's predicted results though, there is a greater likelihood that the future IBM stock price will remain above $180 and rise. This also indicates that investors have more optimistic expectations for future IBM stock performance.
3.4. Residuals analysis
Figure 6 shows a Q-Q plot of the ARIMA(1,1,0) model for testing the normality of the model residuals. The x-axis represents the theoretical quantile, the y-axis represents the sample quantile, and the red line is the perfect normal distribution. From the plot, the vast majority of the points are tightly clustered around the red line but there are a small number of outlier points at the two ends of the graph (especially the right end).
The middle part of the Q-Q plot (i.e., most of the residual points) fits well on the red line, which suggests that most of the residuals follow a normal distribution, and also implies that the ARIMA model is able to suitably fit the stock price movements in most cases. However, in the right-hand tail, some extreme residual values are deviating from the red line, which indicates that a few data points are outliers. These outliers may be related to significant events in the market (e.g., global market volatility or company news during a specific period). As a result, the model may have diminished predictive power in extreme market conditions.
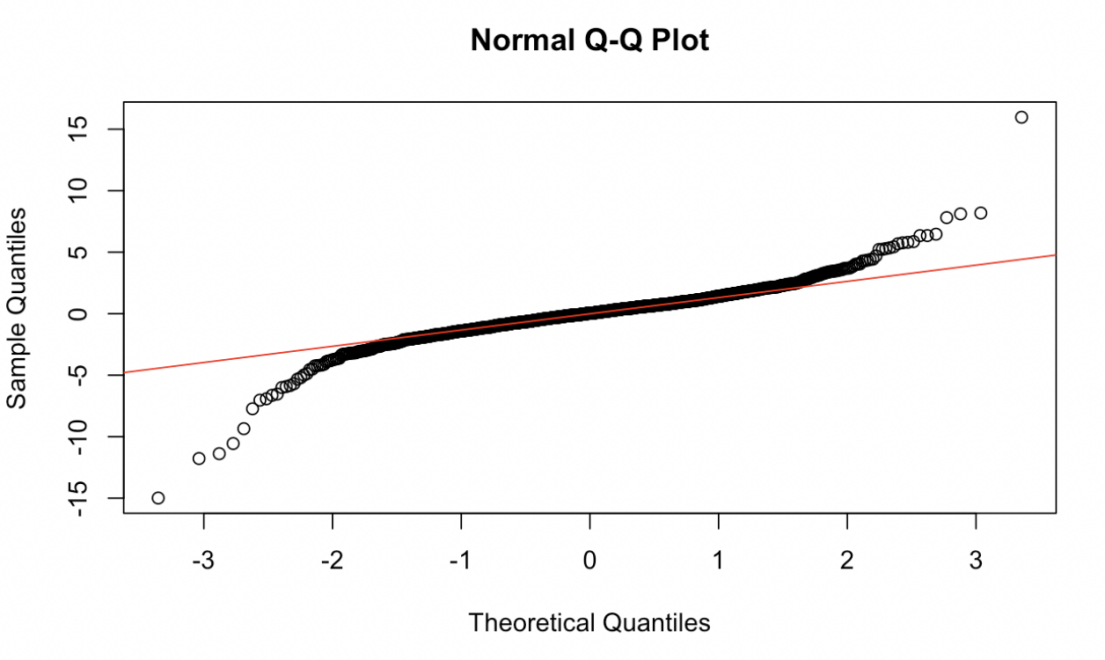
Figure 6. Normal Q-Q Plot for ARIMA(1,1,0)
The time series of the residuals of the ARIMA model, the ACF plot, and the histogram of the residuals are shown in Figure 7. In general, the fluctuations of the residuals are relatively smooth, the ACF is mostly within the confidence interval, and the histogram shows that the residuals are close to normal distribution.
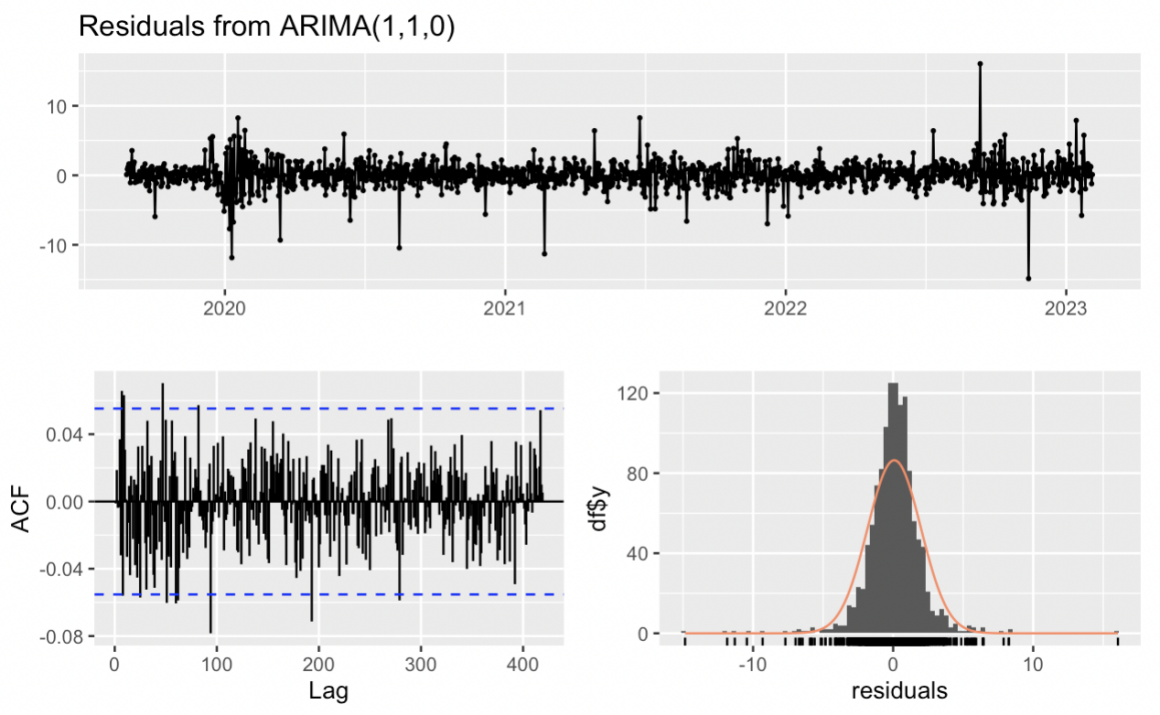
Figure 7. Residual from ARIMA(1,1,0)
The time series plot of the residuals shows that the residuals mostly fluctuate up and down around 0 with no significant trend or structural information, which suggests that the model captures the major time dependence. The results of the histogram are similar to those of the Q-Q plot in that they both indicate that the distribution of the residuals is mostly close to normal but with a slight bias in the tails. This indicates that despite some outliers in the residuals, they follow a normal distribution in the vast majority of cases.
To detect the presence of significant autocorrelation in the residuals, the Ljung-Box test (Table 3) was applied to the residuals. The p-value of the Ljung-Box test was 0.7549, which is much larger than 0.05, indicating that the residuals do not have significant autocorrelation. The ARIMA(1,1,0) model fits well in removing autocorrelation, and the residuals can be seen as random noise. Therefore, this result supports the previous conclusion that the ARIMA model captures most of the time dependence and there is no systematic autocorrelation in the residuals.
Table 3. Ljung-Box test.
Q* | df | p-value |
235.21 | 251 | 0.7549 |
3.5. Critical thinking
The ARIMA(1,1,0) model successfully captured the stock price movement of IBM during the study period. However, some limitations are considered to be improved. The model is a simple random walk model that does not take into account any autocorrelation or moving average patterns that may occur during periods of high volatility. The Q-Q plot shows a slight deviation from normality in the tails, which indicates that although the model handles normal price movements well, problems may arise during periods of high volatility or rapid price movements. In addition, stock prices are affected by a variety of external factors, such as corporate earnings reports, political news, and economy-related policies, etc. The ARIMA model relies only on historical prices and cannot capture these external factors.
4. Conclusion
In conclusion, the ARIMA model that is used is a good tool for forecasting stock trends of AI-related stocks (like IBM) based on historical price data. The forecast shows that the stock price will continually increase during a short period. Through examination of the autocorrelation and partial autocorrelation functions, an ARIMA(1,1,0) model is presented to discover the most significant time dependencies in movements about IBM’s stock price. The outcomes are found to be accurate as there is very little error, so ARIMA can be used for short-term forecasting in a stationary market. As shown by the residuals analysis, there are drawbacks: during very high volatility periods or for outliers events, the model might have issues and also this method does not consider external factors such as earnings reports, regulations, or political developments.
This study applies statistical modeling to the volatile stock market, which helps to deepen individuals’ predictions of AI stock trends. This study can inspire investors and financial analysts to make predictions about AI stocks and inform the behavior of AI-related stocks under different market conditions.
References
[1]. Li K 2024 Predicting Stock Prices Using Machine Learning. Neptune.
[2]. Trabelsi K A, Sayari S, Dammak W and Jeribi A 2024 Unveiling Outperformance: A Portfolio Analysis of Top AI-Related Stocks against IT Indices and Robotics ETFs. Risks, 12(3), 52.
[3]. Kumbure M M, Lohrmann C, Luukka P and Porras J 2022 Machine learning techniques and data for stock market forecasting: A literature review. Expert Systems with Applications, 1, 197.
[4]. Yates T 2024 Four Ways To Predict Market Performance. Investopedia.
[5]. Chen J 2022 Autoregressive Integrated Moving Average (ARIMA). Investopedia.
[6]. Yang Z, Zhao T, Wang S and Li X 2024 MDF-DMC: A stock prediction model combining multi-view stock data features with dynamic market correlation information. Expert Systems with Applications, 15, 238.
[7]. Tyagi V 2024 Stock Price Prediction with Machine Learning. Medium.
[8]. Vilela L F S, Leme R C, Pinheiro C A M and Carpinteiro O A S 2018 Forecasting financial series using clustering methods and support vector regression. Artificial Intelligence Review, 52(2), 743-773.
[9]. Beale R, Rose S, Hooper J, Lloyd S and Weaver I 2018 Australian Academy of Business Leadership SPSS Analysis of Financial Literacy. Proceedings of New York International Business and Social Science Research Conference, 1-5.
[10]. Gandhmal D P and Kumar K 2019 Systematic analysis and review of stock market prediction techniques. Computer Science Review.
Cite this article
Jiang,W. (2024). Future trends of AI stocks prediction using ARIMA model. Theoretical and Natural Science,42,112-119.
Data availability
The datasets used and/or analyzed during the current study will be available from the authors upon reasonable request.
Disclaimer/Publisher's Note
The statements, opinions and data contained in all publications are solely those of the individual author(s) and contributor(s) and not of EWA Publishing and/or the editor(s). EWA Publishing and/or the editor(s) disclaim responsibility for any injury to people or property resulting from any ideas, methods, instructions or products referred to in the content.
About volume
Volume title: Proceedings of the 2nd International Conference on Mathematical Physics and Computational Simulation
© 2024 by the author(s). Licensee EWA Publishing, Oxford, UK. This article is an open access article distributed under the terms and
conditions of the Creative Commons Attribution (CC BY) license. Authors who
publish this series agree to the following terms:
1. Authors retain copyright and grant the series right of first publication with the work simultaneously licensed under a Creative Commons
Attribution License that allows others to share the work with an acknowledgment of the work's authorship and initial publication in this
series.
2. Authors are able to enter into separate, additional contractual arrangements for the non-exclusive distribution of the series's published
version of the work (e.g., post it to an institutional repository or publish it in a book), with an acknowledgment of its initial
publication in this series.
3. Authors are permitted and encouraged to post their work online (e.g., in institutional repositories or on their website) prior to and
during the submission process, as it can lead to productive exchanges, as well as earlier and greater citation of published work (See
Open access policy for details).
References
[1]. Li K 2024 Predicting Stock Prices Using Machine Learning. Neptune.
[2]. Trabelsi K A, Sayari S, Dammak W and Jeribi A 2024 Unveiling Outperformance: A Portfolio Analysis of Top AI-Related Stocks against IT Indices and Robotics ETFs. Risks, 12(3), 52.
[3]. Kumbure M M, Lohrmann C, Luukka P and Porras J 2022 Machine learning techniques and data for stock market forecasting: A literature review. Expert Systems with Applications, 1, 197.
[4]. Yates T 2024 Four Ways To Predict Market Performance. Investopedia.
[5]. Chen J 2022 Autoregressive Integrated Moving Average (ARIMA). Investopedia.
[6]. Yang Z, Zhao T, Wang S and Li X 2024 MDF-DMC: A stock prediction model combining multi-view stock data features with dynamic market correlation information. Expert Systems with Applications, 15, 238.
[7]. Tyagi V 2024 Stock Price Prediction with Machine Learning. Medium.
[8]. Vilela L F S, Leme R C, Pinheiro C A M and Carpinteiro O A S 2018 Forecasting financial series using clustering methods and support vector regression. Artificial Intelligence Review, 52(2), 743-773.
[9]. Beale R, Rose S, Hooper J, Lloyd S and Weaver I 2018 Australian Academy of Business Leadership SPSS Analysis of Financial Literacy. Proceedings of New York International Business and Social Science Research Conference, 1-5.
[10]. Gandhmal D P and Kumar K 2019 Systematic analysis and review of stock market prediction techniques. Computer Science Review.