


1. Introduction
In recent years, cardiovascular disease has emerged as the leading cause of death globally, as reported by the World Health Organization (WHO), with coronary heart disease (CHD) being a major contributor [1]. The global mortality rate from cardiovascular diseases surged by 41% between 1990 and 2013, increasing from 12.3 million to 17.3 million deaths. Additionally, almost half of all deaths in the United States are linked to these critical conditions [2].
However, as researchers state, although CHD is the world's worst disease, it has been declared the most manageable and avoidable [3]. A long-term statistical analysis conducted by the WHO confirms that the risk of heart disease can be significantly mitigated by targeting behavioral and environmental risk factors, including smoking, obesity, physical inactivity, and harmful alcohol consumption. [1] Some researchers have explored computational models for predicting heart syndrome using a comprehensive set of input characteristics. The study employed various medical indicators, such as blood pressure, sex, cholesterol, and 13 other attributes, to predict heart disease in individuals. In addition, the analysis included two additional factors: smoking and obesity [4]. This is the reason why we can use these variables to make predictions about heart disease.
In the past, research on heart disease primarily depended on traditional statistical methods. The year 2000 research by Shusaku Tsumoto underscored the challenge of organizing large datasets manually, prompting the recommendation to leverage data mining techniques for uncovering patterns within extensive databases. While these patterns can be applied in clinical research and operations, their predictive capabilities remain somewhat limited [5].
However, recent years have seen a significant increase in the use of machine learning techniques, with a growing number of researchers incorporating these methods into heart disease studies. Some researchers conducted a comparative analysis of machine learning models, focusing on logistic regression and random forest, to classify heart disease. Using the Framingham dataset with a 70:30 split between training and testing data, the models achieved an accuracy of 85.04% [6]. This emerging trend reflects the increased recognition of machine learning's potential to enhance our comprehension and prediction of heart disease.
The aim of this paper is to investigate and predict the impact of risk factors on heart disease and predict its development using logistic regression modeling in machine learning. By employing this approach, this study has the potential to raise awareness among the government and the general public about heart disease and facilitate proactive preventive measures. The results of this research can enhance early detection and intervention efforts, thereby helping to lessen the impact of heart disease on individuals and society at large.
2. Datasets
2.1. Data profile
The dataset, obtained from the Kaggle website, is part of a cardiovascular study involving residents of Framingham, Massachusetts, USA [7]. It comprises 4,238 records and 15 variables that may impact heart disease. These variables include demographic factors such as age and education; behavioral aspects like current smoking status; medical history elements such as previous strokes; and current medical conditions including BMI and heart rate. The variables are of various types, including continuous, nominal, and ordinal. The final variable, TenYearCHD, is binary, with 0 indicating the absence of the heart disease and 1 indicating its presence (where '1' means 'Yes' and '0' means 'No').
2.2. Data visualization
It utilized Python for data visualization to gain a preliminary insight into the dataset. The histogram depicted in Figure 1 elucidates the distribution of each of the 16 variables with precision, offering a profound comprehension of the data. Furthermore, the heat map presented in Figure 2 illustrates the correlation between pairs of variables; The closer the absolute values of the correlation coefficients are to 1, the stronger the relationship between the variables.
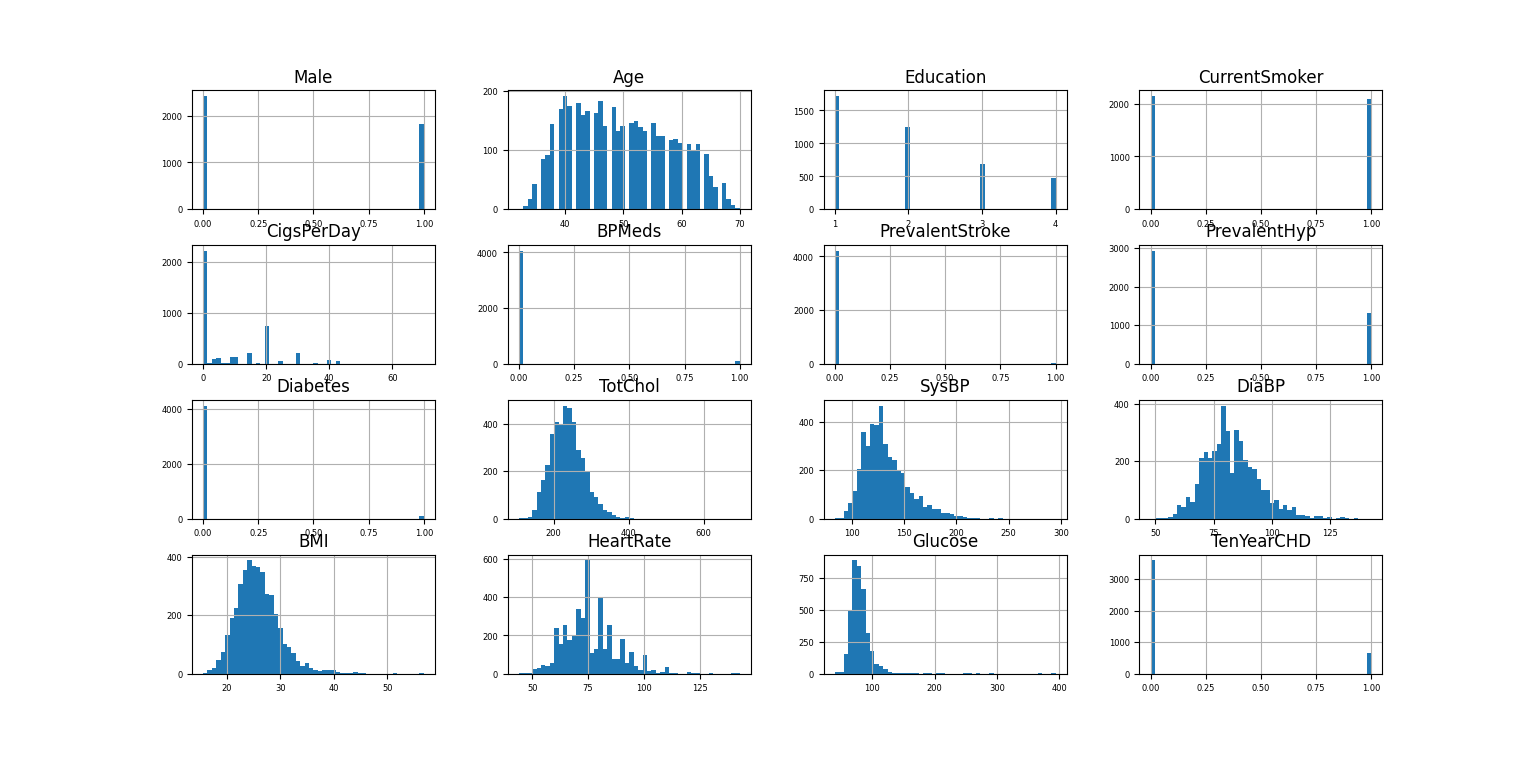
Figure 1. Histogram of 16 variables (Photo/Picture credit: Original).
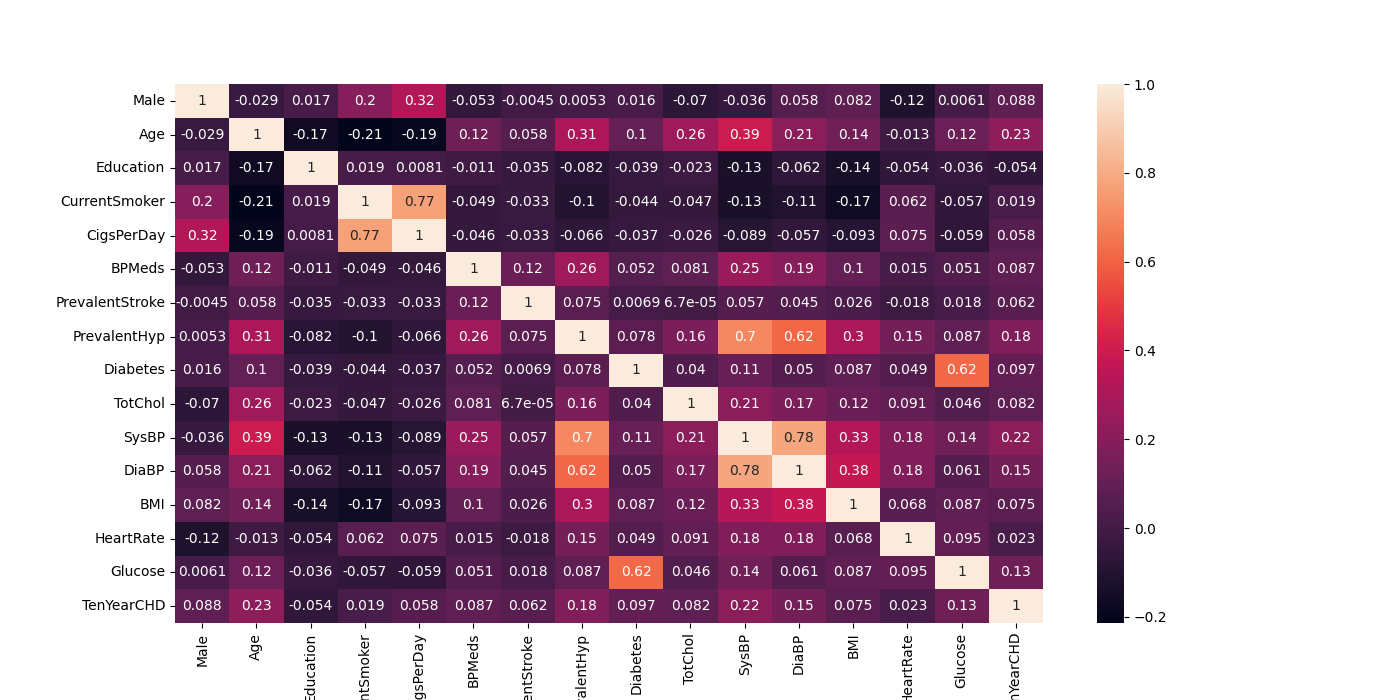
Figure 2. Heat map of 16 variables (Photo/Picture credit: Original).
2.3. Missing value
A missing value in a dataset is a data point that was expected to be collected during the data-gathering process, such as through interviews, measurements, or observations, but is absent for various reasons [8]. Out of the 16 variables, 6 have missing values. The variable with the highest number of missing values is glucose, with 338 missing data points, representing approximately 7.97% of the total 4,238 data points.
Missing data is treated as missing completely at random (MCAR) because it is not related to the missing value itself [8]. The observed data suggest that the missing values are not influenced by other factors and do not exhibit any specific patterns, indicating that they are the MCAR data.
Some researchers prefer using mean substitution to handle missing values due to its simplicity, especially when the missing values are random [9]. Given that the missing values in our dataset are the type of MCAR and the proportion of missing data is only 7.97%, below the 10% threshold, using mean substitution is an appropriate approach. After processing, the number of missing values is 0.
3. Methodology
3.1. Logistic regression modeling
The primary objective of this study is to employ logistic regression modeling for forecasting future instances of heart disease. Logistic regression, a machine learning technique, stands as one of the most prevalent models for binary regression tasks, with applicability extending to multinomial logistic regression. Widely utilized across diverse domains, logistic regression serves as a versatile tool for predictive modeling and analysis.
Logistic regression, a supervised learning technique, is widely utilized for classification tasks. In this methodology, data is classified and segmented into two parts, training and test sets. The training set is employed to build and refine the logistic regression model, while the test set is employed to evaluate its effectiveness and determine its accuracy [10].
A commonly used logistic function can be shown as (1), where the \( logit \) function is the inverse of the logistic function and is used to link the linear predictor variables to the probability 𝑝. This probability, ranging between 0 and 1, denotes the likelihood that the dependent variable equals 1 (the positive class), based on the input features provided. \( {β_{0}},{β_{1}},…,{β_{m}} \) are the parameters (coefficients) to be estimated, and \( {x_{1}},{x_{2}},…,{x_{m}} \) are the explanatory variables, each \( x \) represents a specific feature or predictor.
\( logit(y)=ln{(\frac{p}{1-p})}={β_{0}}+{β_{1}}{x_{1}}+{β_{2}}{x_{2}}+…+{β_{m}}{x_{m}} \) (1)
3.2. Evaluation and analysis of models and data
The confusion matrix (CM), is a critical tool for assessing the effectiveness of classification models. This specialized table vividly contrasts the model's predicted classifications with the real outcomes, offering profound insights into model performance. The classical confusion matrix can be represented in Table 1.
True Positive (TP): The number of samples that the model correctly identified as positive.
True Negative (TN): The number of samples that the model accurately classified as negative.
False Positive (FP): Instances erroneously labeled as positive by the model.
False Negative (FN): Instances incorrectly labeled as negative by the model.
Table 1. Classical confusion matrix
Tota1=P+N | Predicting positive (Positive) | Predicted as negative (Negative) |
Actual positive (Positive) | True Positive | False Negative |
Actual negative (Negative) | False Positive | True Negative |
A classification report serves as an additional instrument for evaluating the efficacy of logistic regression models. This report commonly incorporates essential metrics like precision, recall, and F1 score, defined as follows.
Precision: Calculated as \( TP / (TP + FP) \) , indicates the proportion of true positives among the positives.
Recall: Computed as \( TP / (TP + FN) \) , also called sensitivity, it indicates the proportion of actual positive forecasts that are predicted to be positive.
F1 Score: Expressed as \( 2 * (Precision * Recall) / (Precision + Recall) \) , the F1 Score serves as a harmonized average of precision and recall, offering a comprehensive assessment to mitigate errors stemming from variations in data distribution.
The odds ratio (OR) is utilized to evaluate the association between an exposure and an outcome. It helps determine whether a particular exposure is linked to a higher risk of a specific outcome and allows for a comparison of the relative impact of various risk factors on that outcome. A higher odds ratio suggests a greater likelihood of the event occurring with the exposure, whereas an odds ratio below one indicates a lower likelihood of the event with the exposure. If the OR value is equal to 1, it implies that the two events are independent [11].
The receiver operating characteristic (ROC) curve evaluates the performance of the model by plotting the relationship between true and false positive rates, with a larger area under the curve (AUC) indicating better model performance [12]. The model prediction performance is considered excellent when the value of AUC exceeds 0.9.
4. Results
4.1. Binary logistic regression
In regression analysis, it is expected to observe a correlation between the response variable and predictors. However, having correlations among predictors is undesirable. Multicollinearity occurs when multiple predictors are highly correlated. This can inflate the standard errors of the coefficients, making the estimates less dependable [13]. When the absolute value of the correlation coefficient between predictor variables is below 0.9, it is generally determined that multicollinearity is not a significant issue. As depicted by the data and color gradients in Figure 2, it is clear that the variables do not exhibit multicollinearity.
After addressing multicollinearity in our dataset, we proceeded with logistic regression analysis. The data was divided into a training set, which comprised 70% of the observations, and a test set, which made up the remaining 30%. The logistic regression model resulted in an intercept of -8.1737 (rounded to four decimal places). The coefficients for the predictors are shown in Figure 3. The performance of the LR model was assessed using the test set, yielding an accuracy of 86%, which corresponds closely to the 83.2% accuracy documented by researchers [14]. Using the standard logistic function outlined in equation (1) and the visual representation in Figure 3, the logistic function can be reformulated as presented in equation (2).
\( logit(y)=ln{(\frac{p}{1-p})}=-8.1737+0.412420*Male+0.066752*Age+0.031069*Education+(-0.028590)*CurrentSmoker+0.023282*CigsPerDay+0.270659*BPMeds+0.676283*PrevalentStroke+0.200920*PrevalentHyp+( -0.118499)*Diabetes+0.000511*TotChol+0.012225*SysBP+0.003092*DiaBP+(-0.005262)*BMI+(-0.004023)*HeartRate +0.010347*Glucose \) ·(2)
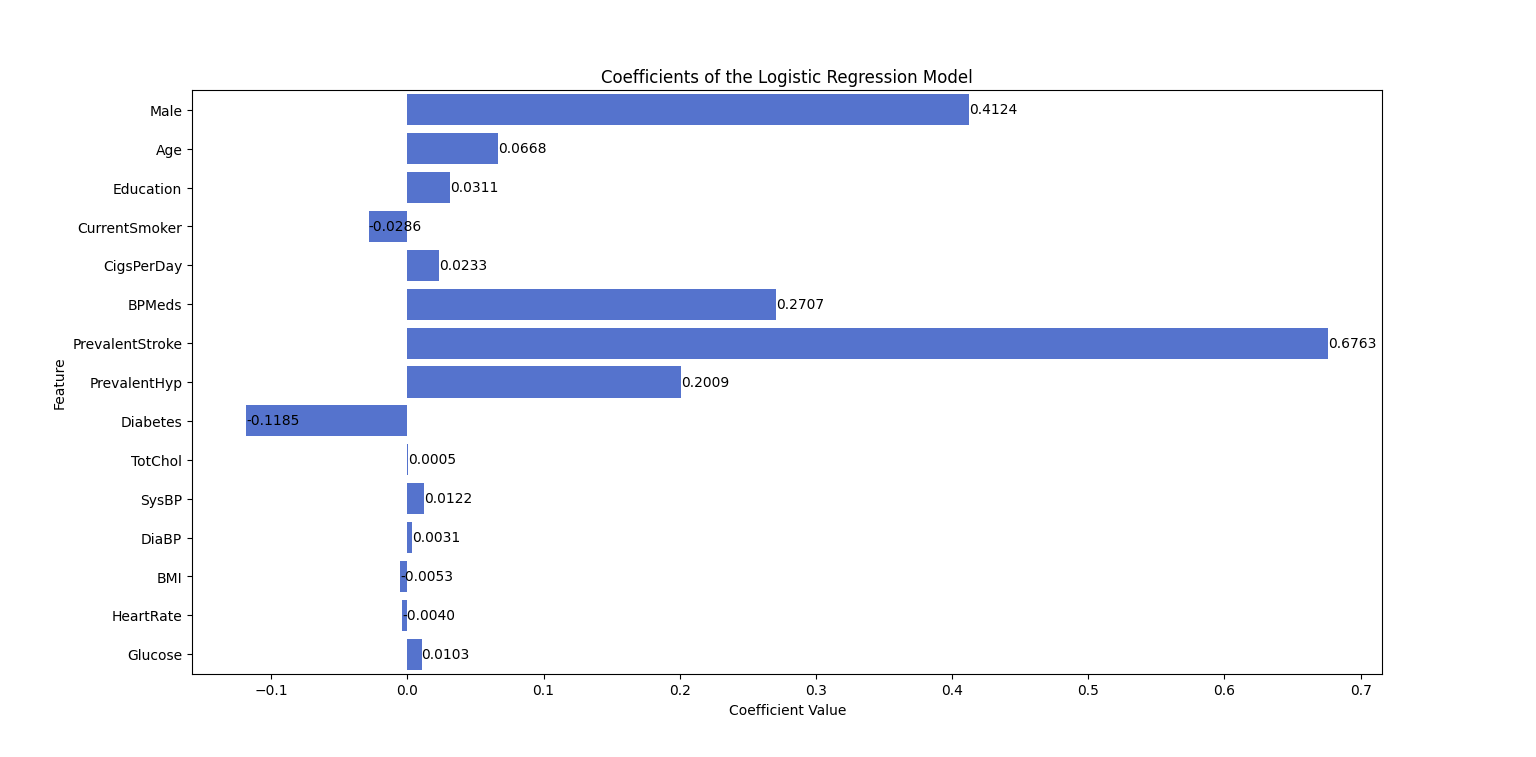
Figure 3. Coefficients of the logistic regression model (Photo/Picture credit: Original).
Based on equation (2), heart disease shows a positive relationship with variables such as Male, Age, Education, CigsPerDay, BPMeds, PrevalentStroke, and Glucose, while exhibiting an inverse relationship with factors such as CurrentSmoker, Diabetes, BMI, and HeartRate. Among these, the positive influence of PrevalentStroke is the most significant, with a coefficient of 0.676283. On the other hand, Diabetes has the strongest negative impact, with a coefficient of -0.118499. Additionally, the positive effects of Male, BPMeds, and PrevalentHyp are notable, with coefficients of 0.412420, 0.270659, and 0.200920, respectively. The remaining variables contribute relatively smaller effects.
4.2. Confusion matrix and classification report
Figure 4 shows the confusion matrix, where the number of TP is 1,077, TN is 19, FP is 169, FN is 7, and the total count is 1,272. Since a value of 0 represents that the participant is healthy, and a value of 1 indicates that they have heart disease, we consider FP, where the model predicts the participant is sick but they are healthy, to be favorable as well. Therefore, our primary focus is on FN, where the model predicts the participant is healthy when they have heart disease—this is a critical error that must be minimized. The total number of incorrect predictions is 7, representing only 0.55%, which indicates that predictions using the logistic model are highly accurate.
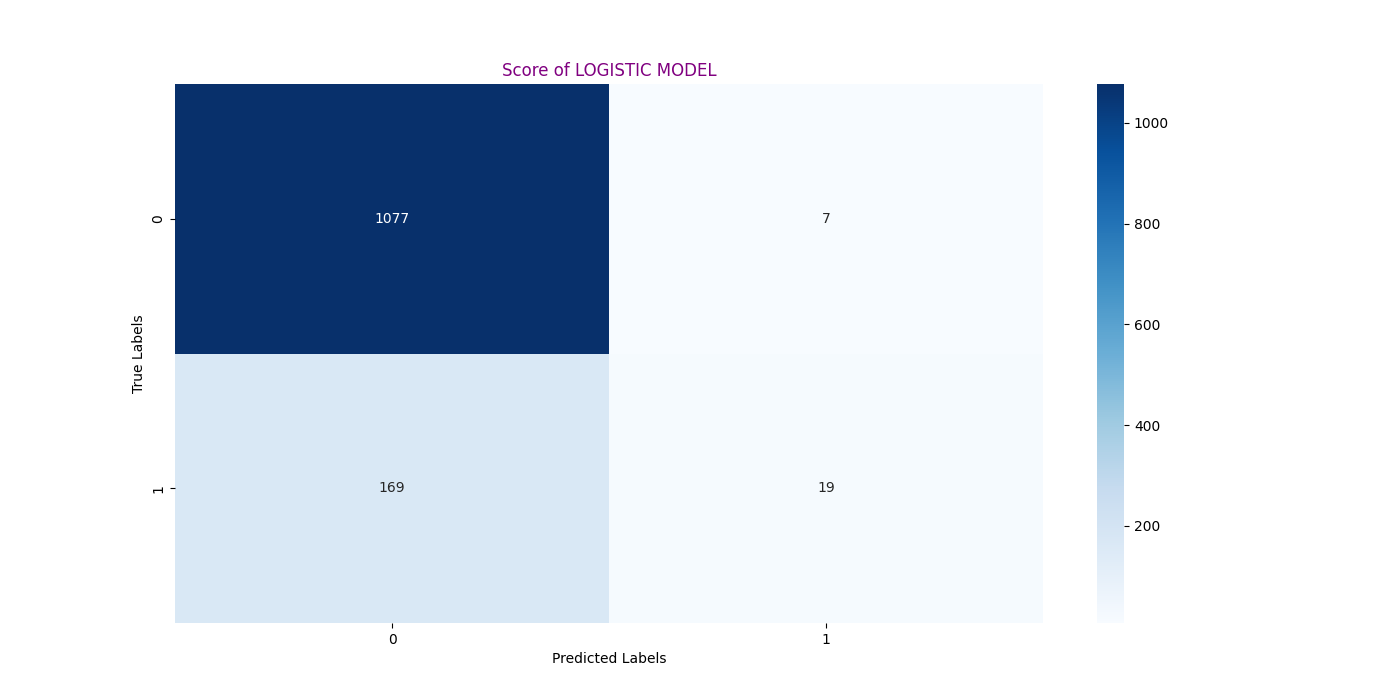
Figure 4. Confusion matrix of prediction (Photo/Picture credit: Original).
The classification report is presented in Table 2. Since the number of predictions for each class varies, we primarily focus on the weighted average. The weighted average precision is 0.84, indicating that a significant portion of the positive predictions are accurate. Recall, also known as sensitivity, indicates that while the recall for class 1 (illness) is relatively low at 0.11, the overall weighted average recall is high at 0.86. This suggests that the model is generally effective at detecting cases of illness. The F1-score has a weighted average of 0.82, further illustrating that the model performs well in predicting illness.
Table 2. Classification Report of Prediction
Classification Report | Precision | Recall | F1-Score | Support |
0 | 0.87 | 0.99 | 0.92 | 1084 |
1 | 0.72 | 0.11 | 0.19 | 188 |
Weighted avg | 0.84 | 0.86 | 0.82 | 1272 |
4.3. Odds ratio and ROC curve
Figure 5 illustrates the odds ratios along with their 95% confidence intervals. The results are consistent with the coefficients obtained from the logistic regression analysis. Notably, PrevalentStroke has the highest odds ratio, close to 2.0, indicating the strongest positive effect on the probability of heart disease among all variables. This is also reflected in its coefficient, which is the largest and has the most substantial positive influence on the likelihood of heart disease. Conversely, Diabetes has the smallest odds ratio and the most negative coefficient, suggesting the worst impact on the probability of heart disease.
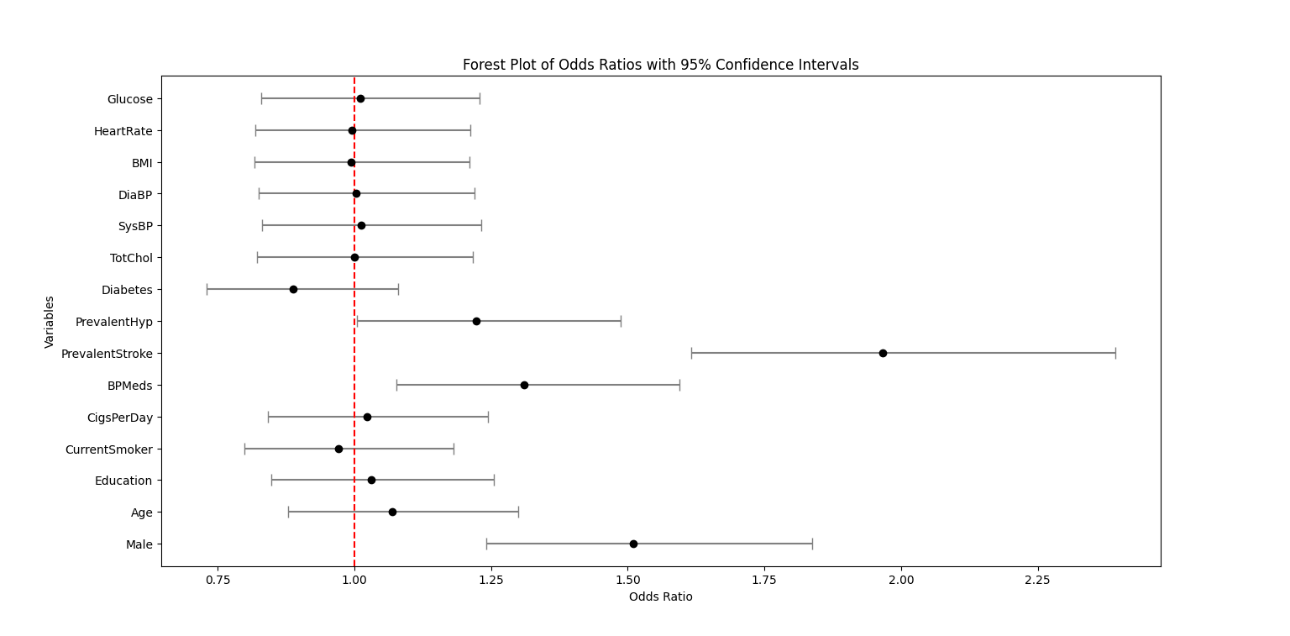
Figure 5. Odds ratio of the variables with 95% confidence interval (Photo/Picture credit: Original).
As can be observed from the ROC curve in Figure 6, the curve is generally skewed towards the upper left corner, indicating good performance. Furthermore, the AUC value of 0.73 can be read from the lower right corner of Figure 6, indicating that the model's area under the curve amounts to 0.73, surpassing 0.5 and suggesting that the model possesses some discriminatory capability. However, there remains room for enhancement.
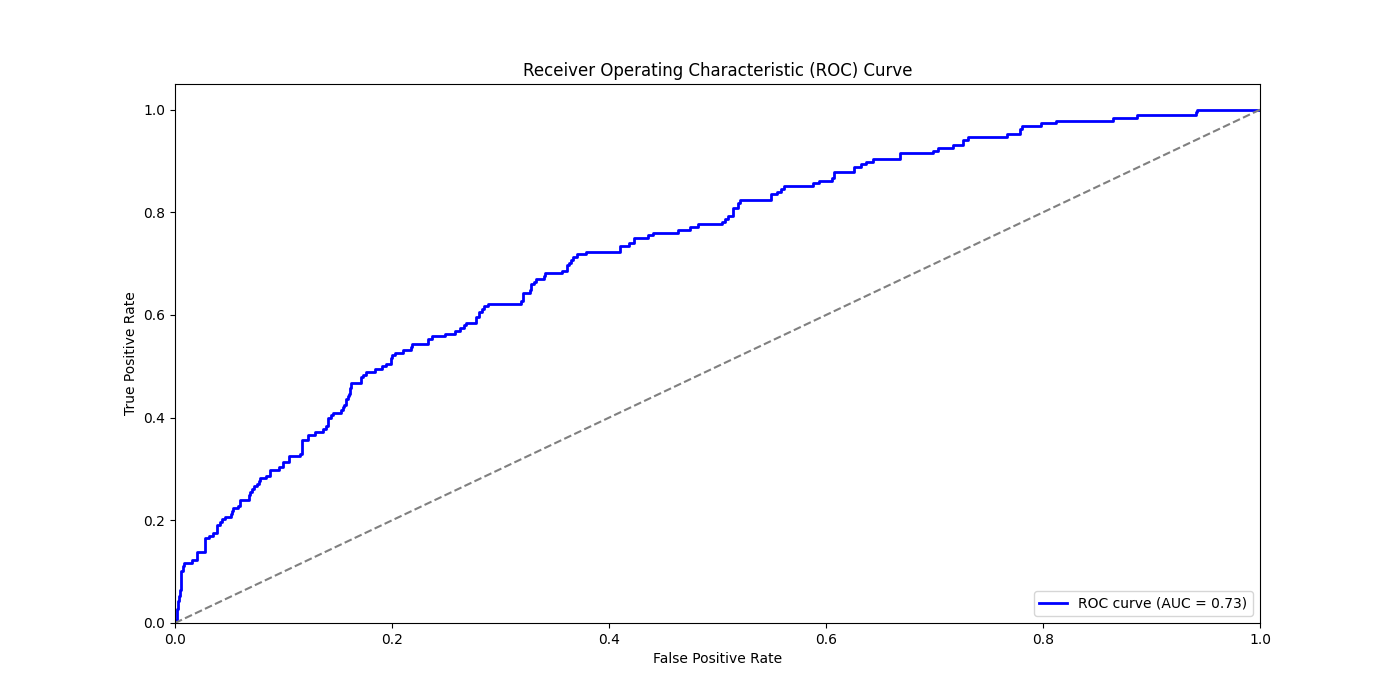
Figure 6. ROC Curve and AUC value of prediction (Photo/Picture credit: Original).
5. Conclusion
This paper utilized data from the Coronary Heart Disease Survey in Massachusetts, USA, which encompasses 15 variables, to evaluate the ten-year risk of CHD. Initially, the data were visualized, and missing values were addressed through mean substitution to prepare for further analysis. Logistic regression modeling was then applied to predict the risk of CHD and examine the relationships between various predictors and the likelihood of developing the disease. To ensure the robustness of the logistic model, the analysis began by addressing multicollinearity. Following the prediction phase, the accuracy of the model was assessed using the confusion matrix and classification report. Furthermore, the validity of the logistic regression findings was confirmed by calculating the odds ratio, and the performance of the categorical predictions was evaluated through ROC curves and AUC values.
The logistic regression model achieved a predictive accuracy of 0.86. However, there is potential for further enhancement of this accuracy through various approaches. One potential improvement could involve adjusting the ratio of the training and test datasets to optimize model performance. Another approach could be to gather additional data, which may provide more comprehensive insights and improve prediction accuracy.
Moreover, exploring other machine-learning techniques might also be advantageous. For example, a 2016 study highlighted that models such as random forests and decision trees outperformed logistic regression in terms of accuracy. Implementing these alternative models could lead to improved performance. It is indeed highly plausible to explore alternative machine learning methodologies for studying heart disease, opening up avenues for further experimentation and investigation.
In addition to accuracy, the AUC value for the current model is 0.73, indicating that there is still room for improvement. To achieve a better AUC, it is essential to refine data processing techniques. In particular, utilizing advanced techniques for managing missing values and implementing additional data preprocessing procedures could bolster the model's capacity to differentiate between classes more effectively. By addressing these areas, the overall performance of the model could be significantly improved, leading to more reliable predictions.
Overall, stroke, hypertension, and antihypertensive medications have a significant impact on the development of coronary heart disease (CHD). Men are also more likely to develop heart disease compared to women. Factors such as daily smoking, education, and age also influence the risk of CHD, whereas total cholesterol and glucose levels have a relatively smaller impact on the disease's development. Therefore, when dealing with high-risk conditions such as stroke and hypertension, it is crucial to focus on preventing heart disease. In daily life, men should particularly avoid smoking, and special attention should be given to protecting the elderly from CHD. From the governmental perspective, there is a significant opportunity to enhance public awareness regarding preventive measures against heart diseases. Initiatives could include widespread education campaigns to inform individuals about heart disease prevention strategies. Moreover, organizing regular free medical check-ups can be instrumental in early detection and prevention efforts, potentially mitigating the prevalence of coronary heart disease—a severe ailment associated with a high mortality rate.
References
[1]. World Health Organization. (2021). Cardiovascular diseases (CVDs). World Health Organization.
[2]. Mozaffarian, D., Benjamin, E. J., Go, A. S., Arnett, D. K., Blaha, M. J., Cushman, M., de Ferranti, S., Després, J. P., Fullerton, H. J., Howard, V. J., Huffman, M. D., Judd, S. E., Kissela, B. M., Lichtman, J. H., Lisabeth, L. D., Liu, S., Mackey, R. H., Matchar, D. B., ... Turner, M. B. (2015). Heart disease and stroke statistics—2015 update: A report from the American Heart Association. Circulation.
[3]. Golande, A., & Kumar, P. (2019). Heart disease prediction using effective machine learning.
[4]. Dangare, C. S., & Apte, S. S. (2012). Improved study of heart disease prediction system using data mining classification techniques. International Journal of Computer Applications, 47(10), 44–48.
[5]. Tsumoto, S. (2000). Problems with mining medical data. Proceedings of the IEEE.
[6]. Latifah, F. A., Slamet, I., & Sugiyanto. (2020). Comparison of heart disease classification with logistic regression algorithm and random forest algorithm. International Conference on Science and Applied Science (ICSAS 2020), 2296(1).
[7]. Zulkiflee, N. F., & Rusiman, M. S. (2021). Heart Disease Prediction Using Logistic Regression. Enhanced Knowledge in Sciences and Technology, 1(2), 177-184.
[8]. Kaiser, J. (2014). Dealing with missing values in data. Journal of Systems Integration, 5(1), 42–51.
[9]. Acock, A. C. (2005). Working with missing values. Journal of Marriage and Family, 67(4), 1012–1028.
[10]. Shah, D., Patel, S., & Bharti, S. K. (2020). Heart disease prediction using machine learning techniques. SN Computer Science, 1(6).
[11]. Europe PMC. (2017). Europe PMC.
[12]. Kumar, R., & Indrayan, A. (2011). Receiver operating characteristic (ROC) curve for medical researchers. Indian Pediatrics, 48(4), 277–287.
[13]. Daoud, J. I. (2017). Multicollinearity and regression analysis. Journal of Physics: Conference Series, 949(1).
[14]. Ganesh, B., Ganesh, A., Srinivas, C., Dhanraj, G. A., & Mensinkal, K. (2022). Logistic regression technique for prediction of cardiovascular disease. Global Transitions Proceedings, 3(1), 127–130.
Cite this article
Wu,H. (2024). Using logistic regression model to predict the future coronary heart disease. Theoretical and Natural Science,50,83-90.
Data availability
The datasets used and/or analyzed during the current study will be available from the authors upon reasonable request.
Disclaimer/Publisher's Note
The statements, opinions and data contained in all publications are solely those of the individual author(s) and contributor(s) and not of EWA Publishing and/or the editor(s). EWA Publishing and/or the editor(s) disclaim responsibility for any injury to people or property resulting from any ideas, methods, instructions or products referred to in the content.
About volume
Volume title: Proceedings of ICBioMed 2024 Workshop: Workshop on Intelligent Medical Data Analysis for Precision Medicine
© 2024 by the author(s). Licensee EWA Publishing, Oxford, UK. This article is an open access article distributed under the terms and
conditions of the Creative Commons Attribution (CC BY) license. Authors who
publish this series agree to the following terms:
1. Authors retain copyright and grant the series right of first publication with the work simultaneously licensed under a Creative Commons
Attribution License that allows others to share the work with an acknowledgment of the work's authorship and initial publication in this
series.
2. Authors are able to enter into separate, additional contractual arrangements for the non-exclusive distribution of the series's published
version of the work (e.g., post it to an institutional repository or publish it in a book), with an acknowledgment of its initial
publication in this series.
3. Authors are permitted and encouraged to post their work online (e.g., in institutional repositories or on their website) prior to and
during the submission process, as it can lead to productive exchanges, as well as earlier and greater citation of published work (See
Open access policy for details).
References
[1]. World Health Organization. (2021). Cardiovascular diseases (CVDs). World Health Organization.
[2]. Mozaffarian, D., Benjamin, E. J., Go, A. S., Arnett, D. K., Blaha, M. J., Cushman, M., de Ferranti, S., Després, J. P., Fullerton, H. J., Howard, V. J., Huffman, M. D., Judd, S. E., Kissela, B. M., Lichtman, J. H., Lisabeth, L. D., Liu, S., Mackey, R. H., Matchar, D. B., ... Turner, M. B. (2015). Heart disease and stroke statistics—2015 update: A report from the American Heart Association. Circulation.
[3]. Golande, A., & Kumar, P. (2019). Heart disease prediction using effective machine learning.
[4]. Dangare, C. S., & Apte, S. S. (2012). Improved study of heart disease prediction system using data mining classification techniques. International Journal of Computer Applications, 47(10), 44–48.
[5]. Tsumoto, S. (2000). Problems with mining medical data. Proceedings of the IEEE.
[6]. Latifah, F. A., Slamet, I., & Sugiyanto. (2020). Comparison of heart disease classification with logistic regression algorithm and random forest algorithm. International Conference on Science and Applied Science (ICSAS 2020), 2296(1).
[7]. Zulkiflee, N. F., & Rusiman, M. S. (2021). Heart Disease Prediction Using Logistic Regression. Enhanced Knowledge in Sciences and Technology, 1(2), 177-184.
[8]. Kaiser, J. (2014). Dealing with missing values in data. Journal of Systems Integration, 5(1), 42–51.
[9]. Acock, A. C. (2005). Working with missing values. Journal of Marriage and Family, 67(4), 1012–1028.
[10]. Shah, D., Patel, S., & Bharti, S. K. (2020). Heart disease prediction using machine learning techniques. SN Computer Science, 1(6).
[11]. Europe PMC. (2017). Europe PMC.
[12]. Kumar, R., & Indrayan, A. (2011). Receiver operating characteristic (ROC) curve for medical researchers. Indian Pediatrics, 48(4), 277–287.
[13]. Daoud, J. I. (2017). Multicollinearity and regression analysis. Journal of Physics: Conference Series, 949(1).
[14]. Ganesh, B., Ganesh, A., Srinivas, C., Dhanraj, G. A., & Mensinkal, K. (2022). Logistic regression technique for prediction of cardiovascular disease. Global Transitions Proceedings, 3(1), 127–130.