


1. Introduction
In the realm of global health challenges, breast cancer (BC) has emerged as a predominant concern. As the most common type of tumor worldwide, BC led in incidence and mortality rates among women, accounting for approximately 11.7% of all cancer cases [1-2]. Its prevalence not only has underscored a critical health issue but also highlighted an increasing trend year after year [3]. This growing prevalence necessitates a heightened focus on biological research, particularly in understanding the intricate mechanisms of pathology and developing effective treatment strategies for BC. According to the studies, one of the central aspects of BC pathology was the genetic abnormalities observed at the molecular level, particularly in gene expression [4]. A notable example of this was the regulatory role of the KIAA1429 gene in the oncogenic modulation of CDK1 expression, a process deeply intertwined with m6A-related epitranscriptomic mechanisms [1]. Meanwhile, this genetic complexity has extended to treatment challenges as well, where genes like ABCA1, ABCB1, and ABCG2, associated with multidrug resistance in chemotherapy, revealed critical links to gene family regulators and chemoresistance [5].
To address these complexities, there has been an increasing reliance on bioinformatics using high-throughput sequencing samples. With the power of data, this approach can offer profound insights into the genetic underpinnings of BC, paving the way for more effective diagnostic and therapeutic strategies. In omics, in addition to traditional transcriptomics studies, the role of N6-methyladenosine (m6A) – the most prevalent post-transcriptional modification in eukaryotic RNA – was particularly noteworthy [6]. Its influence on mRNA functionality, such as transport, alternative splicing, and stability, plays a significant role in cancer progression, metastasis, and resistance to treatment [4]. Despite advances in sequencing technologies highlighting the relationship between abnormal m6A levels and tumors, the specific functions of m6A in BC and its contradictory effects across various cancer cell subtypes and patient profiles remained areas of active debate [1].
Recognizing the importance and dynamic nature of m6A modifications, the study aimed to provide a clearer picture of its role in BC in the context of the traditional mRNA landscape. By conducting an integrative transcriptomic analysis using RNA-seq and MeRIP-Seq on breast cancer samples (focusing on human chromosome 17), we sought to achieve the following objectives: (1) To identify and compile a high-confidence list of genes differentially expressed and regulated by m6A in BC; (2) To investigate the diverse biological functions of these genes; (3) To pinpoint potential target genes showing differential expression due to m6A regulation and assess the feasibility of BC hallmark genes TP53 and BRCA1.
2. Methods
This study employed a dual-omics approach, incorporating both RNA-seq and MeRIP-Seq analyses. The workflow commenced with separate examinations of each omics method to procure distinct breast cancer expression profiles (Fig. 1), then an integrated analysis merged these findings, enabling a comprehensive exploration of the functions of the genes characterized by m6A-mediated differential transcripts expression. The specific analysis steps are as follows:
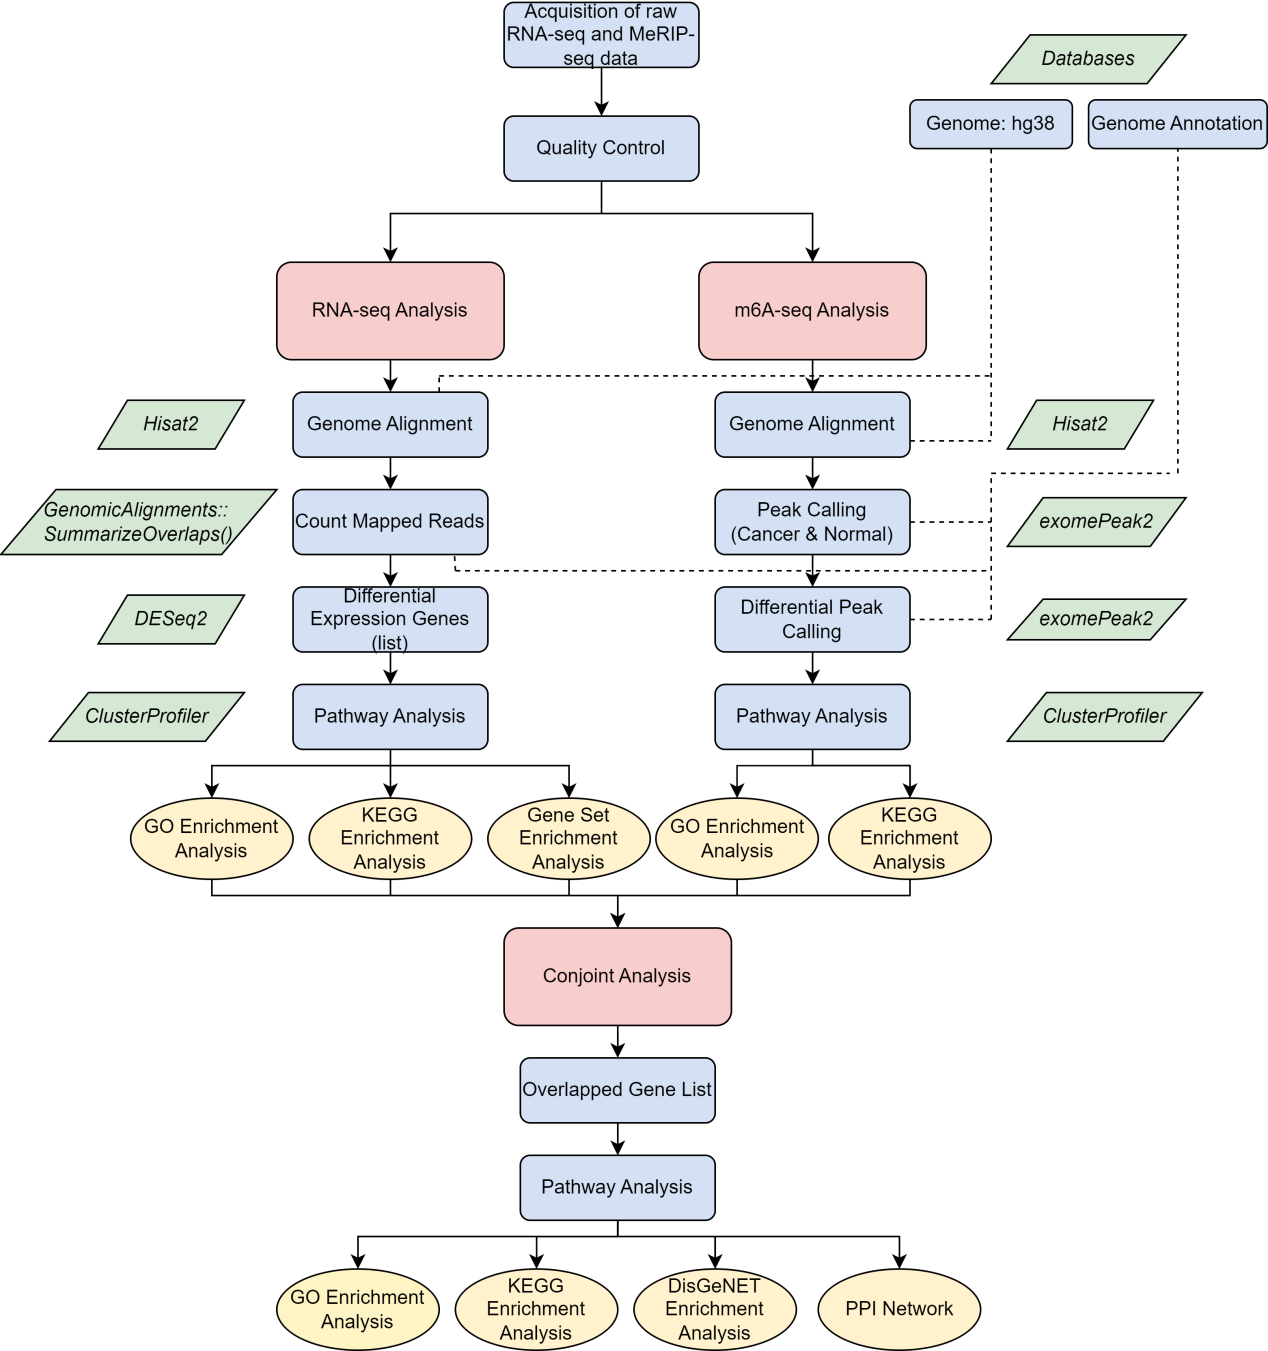
Figure 1. The flowchart of this whole analysis. After obtaining the raw data from the GO database, RNA-seq and MerIP-seq-based m6A flow analyses were first performed, respectively. After completing the two processes, joint analysis was used to obtain gene intersections and dig deeper into their enrichment functions in BC. During the analysis, the three main analysis topics are shown in red, the blue squares show the main analysis steps, and the yellow circles focus on the enrichment analysis and other analysis methods used. Finally, the R packages or functions used were presented in green diamond blocks.
2.1. Raw Data Acquisition
Two omics methodologies were utilized in this research. The raw sequencing data, sourced from the GEO (NCBI) public database under accession number SRP407941, encompassed human breast cancer and normal breast tissue samples [7]. According to the database, sequencing was performed on the Illumina HiSeq 4000 (Illumina platform), generating paired-end RIP-Seq sequences with an average read length of 300bp. The project included 8 samples, each assigned specific IDs and library types. For instance, SRR2228734x(1-4) represented breast cancer tissue, while SRR2228734x(5-8) corresponded to normal breast tissue. In the analysis, samples x2, x4, x6, and x8 from RNA-seq libraries were not only used for RNA-seq analysis but also concurrently served as inputs alongside samples x1, x3, x5, and x7 from MeRIP-Seq IP for m6A analysis (Fig. 2).
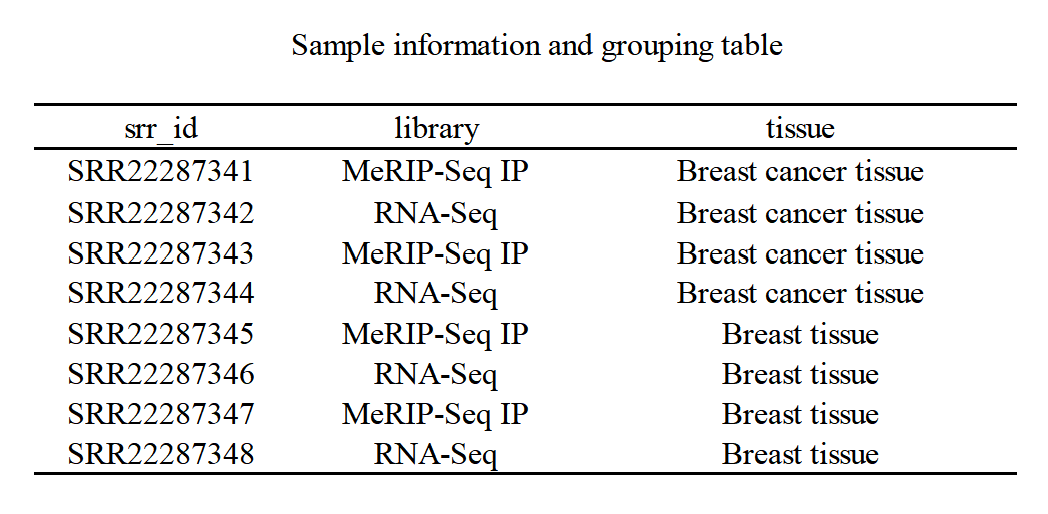
Figure 2. Information on the samples obtained from the GEO database and the experimental design groups. Samples x1-4 were derived from human breast cancer tissues, while samples x5-8 were obtained from normal breast tissues. The library types are as shown in the table: 4 RNA-seq samples were grouped for mRNA differential analysis, while four MeRIP-Seq samples were used as immunoprecipitation (IP) samples for m6A analysis. Additionally, the same 4 RNA-Seq samples also served as input in m6A analysis.
2.2. Quality Control and Data Preprocessing
Prior to formal analysis, the eight samples underwent rigorous quality assessment, including base quality filtering and rRNA sequence removal, executed by experienced professionals.
2.3. Genome Alignment
The sequencing reads were aligned to the hg38 human reference genome using the Hisat2 tool [8]. This proc`ess employed a pre-built index at “/data/genome_indx/genome_hg38”. Subsequently, the eight resulting SAM files were converted to BAM format via ‘samtools view’ to enhance memory efficiency, after which the original SAM files were deleted [9].
*Note: Both RNA-seq and m6A-seq followed the above data processing workflow, albeit with subsequent divergent analytical procedures.
2.4. Read Counts (RNA-seq) & Peak Calling (m6A-seq)
As the initial statistical steps, RNA-seq analysis and m6A-seq analysis had different statistical targets:
RNA-seq: The RNA-seq analysis employed the “summarizeOverlaps()” function from R’s GenomicAlignments package for read count per gene, with gene annotation via TxDb.Hsapiens.UCSC.hg38.knownGene [10-11]. The resulting statistics included a matrix with genes arranged vertically and samples arranged horizontally, where each element represented the count of reads in a specific sample and gene. During this process, parameters were meticulously selected, including gene ID conversion using org.Hs.eg.db, and specific filtering conditions were applied to enhance data quality and reduce data background noise (count_se[rowSums(assay(count_se) >= 10) > 1,]).
MeRIP-seq: Unlike RNA-seq, which quantified the number of reads per gene, m6A analysis focused on identifying regions significantly enriched in m6A in IP samples compared to input samples. The “exomePeak2” tool was utilized for peak calling [12]. During this process, m6A-enriched regions were separately counted for breast cancer and normal groups, with RNA-seq sequencing data from the same groups used as input controls. MeRIP-seq BAM files were used as immunoprecipitation (IP) samples for corrected peak findings. Notably, the “TxDb.Hsapiens.UCSC.hg38.knownGene” on chromosome 17 was called transcript annotation (TxDb), and the p-value and log2FC thresholds were set to default values in the functions [10].
2.5. Differentially Expressed Genes & m6A Differential Peaks
RNA-seq (differentially expressed genes): DESeq2 facilitated the identification, incorporating data normalization and modeling based on a negative binomial distribution [13]. Its results reported differential expression genes between breast cancer tissue and normal breast tissue, along with their log2FC and BH-corrected p-values (padj). Thresholds were set at |log2FC| > 1 and padj < 0.05.
MeRIP-seq (m6A Differential Peaks): ExomePeak2 also executed differential peak calling comparing breast cancer tissue with normal tissue [12]. The “bam_ip_treated” and “bam_input_treated” parameters were enabled for this calling. The output was in BED format.
2.6. GO & KEGG Enrichment & GSEA Analysis
Based on the differentially expressed genes and m6A differential peaks obtained in the previous steps, separate Gene Ontology (GO) Enrichment Analysis and Kyoto Encyclopedia of Genes and Genomes (KEGG) Enrichment Analysis were conducted in both omics (methods without no enrichment outcome were not included in the next part) [14-15]. The gene lists corresponding to differential expression in both omics was set as input, and the “enrichGO()” and “enrichKEGG()” functions were called to perform enrichment analysis [16]. org.Hs.eg.db provided the necessary information for enrichment, such as human biological pathways and GO functional annotations. The threshold was set at p < 0.05. Additionally, Gene Set Enrichment Analysis (GSEA) was separately conducted for RNA-seq analysis [17].
2.7. Conjoint Analyses
The final phase involved a synergistic analysis, merging RNA-seq and m6A-seq findings to pinpoint breast cancer genes affected by m6A modifications. The specific method involved taking the intersection of differentially expressed genes from RNA-seq and genes corresponding to m6A differential peaks. Subsequent functional analyses included: (1) GO and KEGG functional enrichment analysis for the intersecting genes. (2) DisGeNet enrichment analysis to determine associations with diseases [18]. (3) Protein - Protein Interaction (PPI) network analysis using the String database to explore their deep functional roles in BC [19].
3. Results
3.1. Breast Cancer mRNA Expression Profile
3.1.1. Sample Assessment. Based on the count matrix derived from read counts, Principal Component Analysis (PCA) and Pearson correlation coefficient assessments were conducted to determine the relationships among the four RNA-seq samples (Fig. 3A, B). In the PCA plot, breast cancer and normal tissue samples exhibited significant divergence along Principal Component 1 (PC1), while in Principal Component 2 (PC2), the two sample types maintained a distinct separation, although the two breast tissue samples were relatively distant from each other. Meanwhile, the Pearson correlation plot further quantified the strength of the association: a very strong positive correlation (0.87) between the breast cancer samples and a notable positive correlation (0.77) between the normal tissue samples. Considering both sets of analysis, the experimental design for the RNA-seq samples was overall effective, demonstrating significant biological variations between the two categories. This provides a solid foundation for subsequent differential expression analysis, despite the inherent variability within each group.
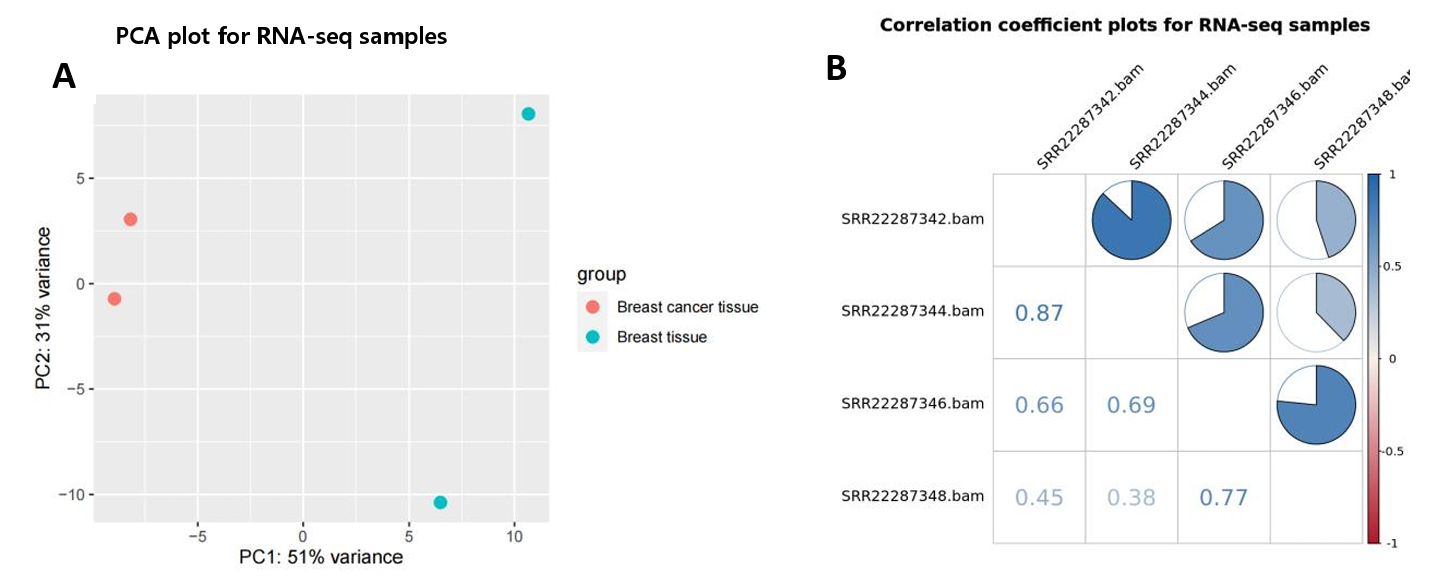
Figure 3. Sample relationships and quality checks. (A) PCA plots show the clustering of four RNA-seq samples; (B) The correlation coefficient chart quantifies the strength of the correlation between the four samples.
mRNA Expression Level Analysis. After counting reads, the differential expression analysis was utilized to conduct a clustering analysis of 886 genes, which elucidated the overarching gene expression patterns and delineated the similarities and disparities among samples, as visualized through the heatmap (Fig. 4D). Subsequent comparison among groups and filtration yielded 72 genes with significantly differential expression. The symbols and clustering configurations of these 72 genes across four samples are indicated in Fig. 4E. Moreover, a volcano plot was deployed to further delineate the distribution, significance, and extent of variances among these differentially expressed genes. The analysis revealed that 37 genes were markedly upregulated in breast cancer samples, whereas 35 genes demonstrated pronounced downregulation. Notably, genes of considerable significance or with substantial differential fold changes have been annotated in the figure (Fig. 4A).
Additionally, the relationship between the counts and the differential expression levels, as well as the dispersion across gene points and the fitting model of DESeq2, are shown in MA plot (Fig. 4B) and discrete estimation plot (Fig. 4C).
Beyond these analyses, the study concentrated on the transcript expression of two star breast cancer genes, TP53 and BRCA1. It was observed that the transcript expression of both genes was augmented in breast cancer tissues, with BRCA1 exhibiting a more pronounced upregulation compared to TP53 (log2FC: 1.94 vs. 1.64) (Fig. 4F-H). However, it was also worth noting that two genes were statistically non-significant (padj > 0.05) (Fig. 10D).
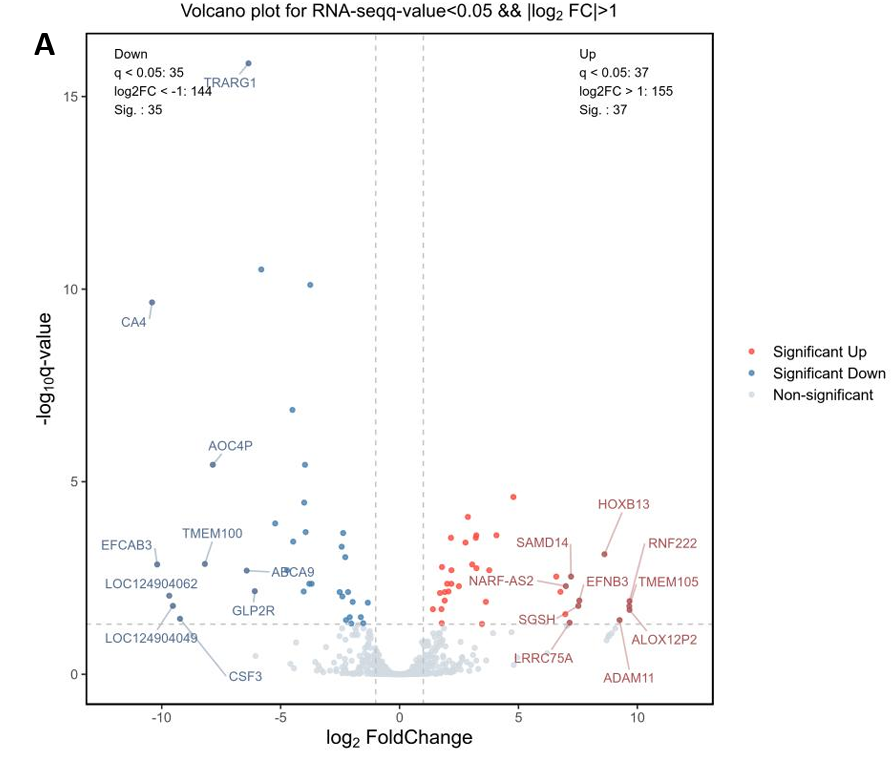
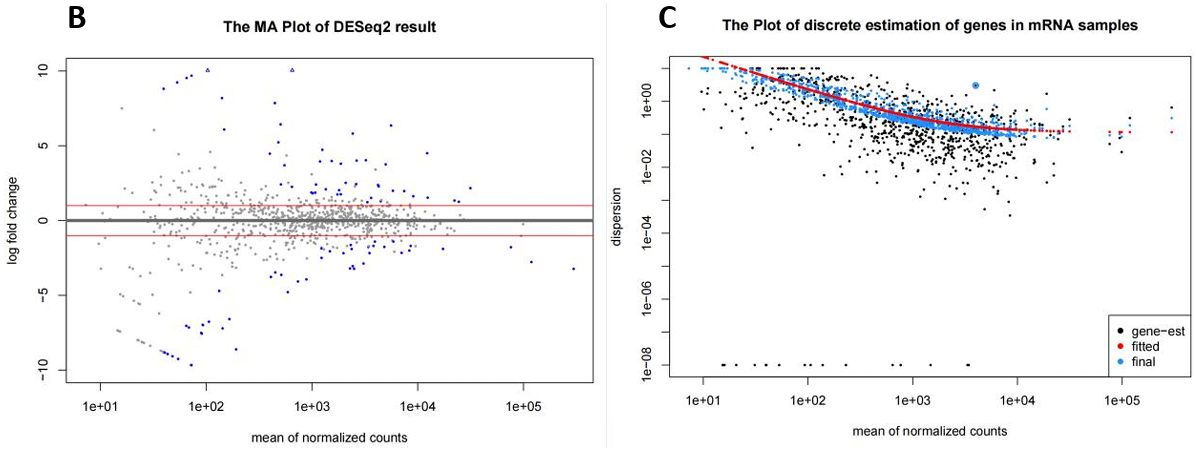
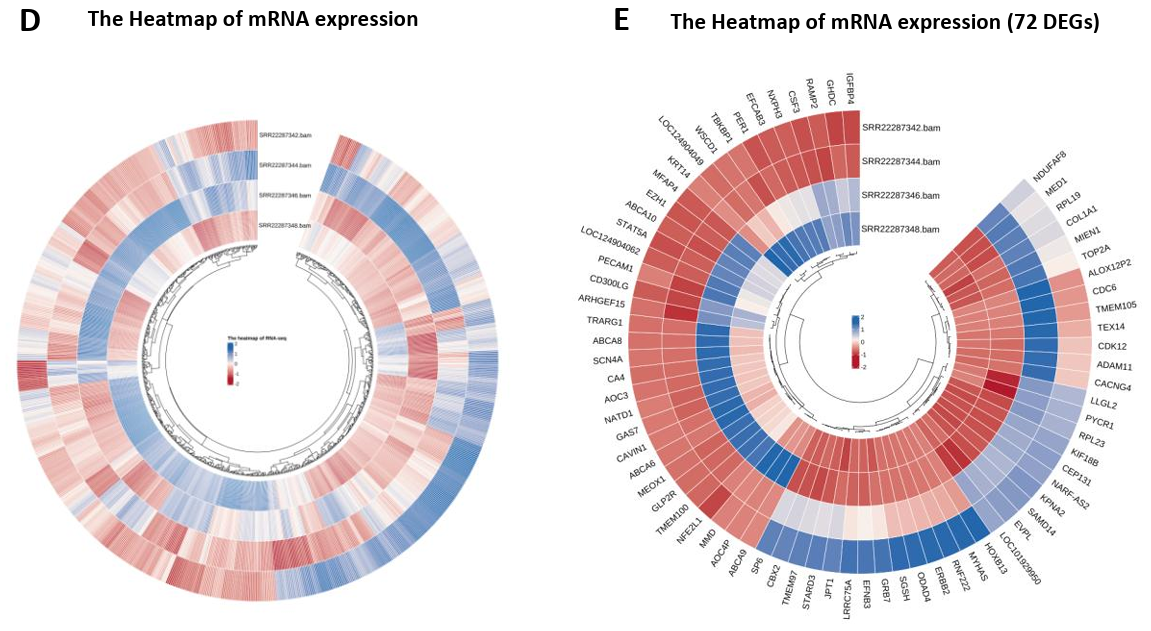
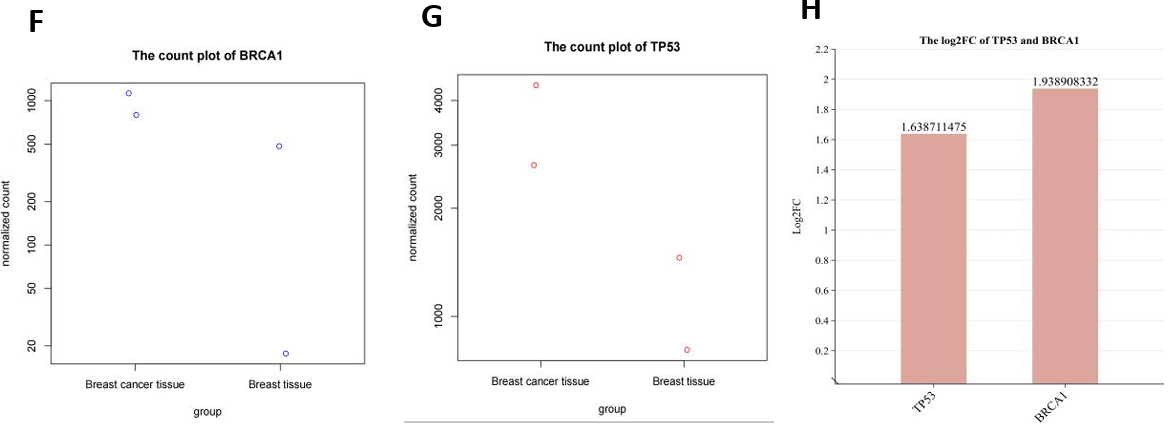
Figure 4. mRNA expression profile (RNA-seq). (A) Volcano map showed 72 differentially expressed genes, 37 of which were up-regulated and 35 down-regulated in BC samples; (B)(C) MA maps and Discrete estimation maps show the relationship and degree of dispersion of gene counts and expression differences respectively (corresponding to the statistical model in DESeq2); (D) Clustering heatmap of all 886 genes in four samples, showing expression patterns within and between groups as a whole; (E) Cluster expression patterns of 72 differentially expressed genes, with up-regulated genes represented in blue and down-regulated genes represented in red; (F-H) The dot plots for TP53 and BRCA1’s normalized counts, and the bar chart represents the up-regulation multiples (Log2FC) of these two BC star genes.
3.1.2. The Enrichment Analysis of Differentially Expressed Genes (DEGs): ABC Transporter Activity may have an Impact on BC. The GO and KEGG enrichment analyses of the 72 differentially expressed mRNA genes suggested potential alterations in ATP-binding cassette (ABC) transporters within breast cancer tissues (Fig. 5B). These changes might affect transporter protein functions, including lipid transporter activity, ATPase-coupled transmembrane transporter activity, and ABC-type transporter activity (Fig. 5A). The GO pathway network highlighted a significant link between ABCAx genes (ABCA6, ABCA8, ABCA9, ABCA10) and transporter protein functions (Fig. 5C).
Furthermore, gene set enrichment analysis of the original sample count matrix indicated potential comorbidity between Human Papillomavirus (HPV) and breast cancer. The differential gene set enrichment was depicted in Figure 5E, adhering to a threshold of p < 0.05 and False Discovery Rate (FDR) < 0.05. Notably, TP53 was observed to be upregulated in the gene set enrichment analysis, underscoring its potential involvement in this comorbidity (Fig. 5D).
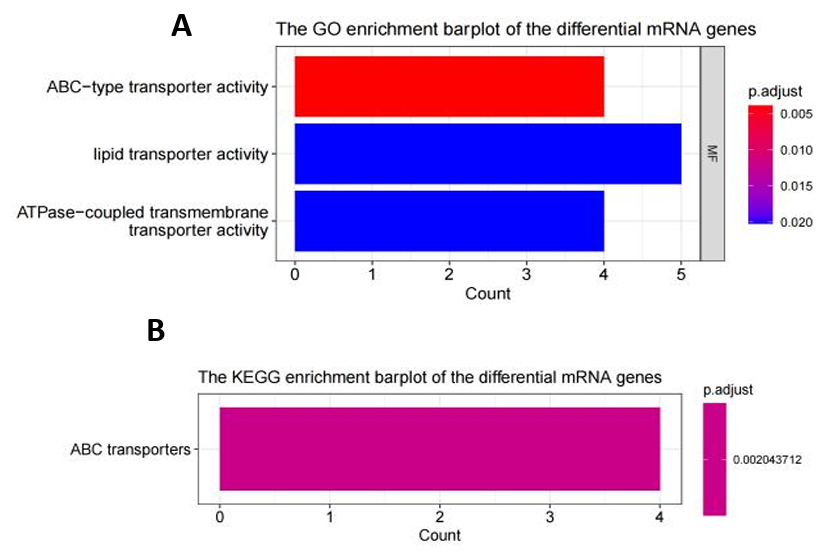
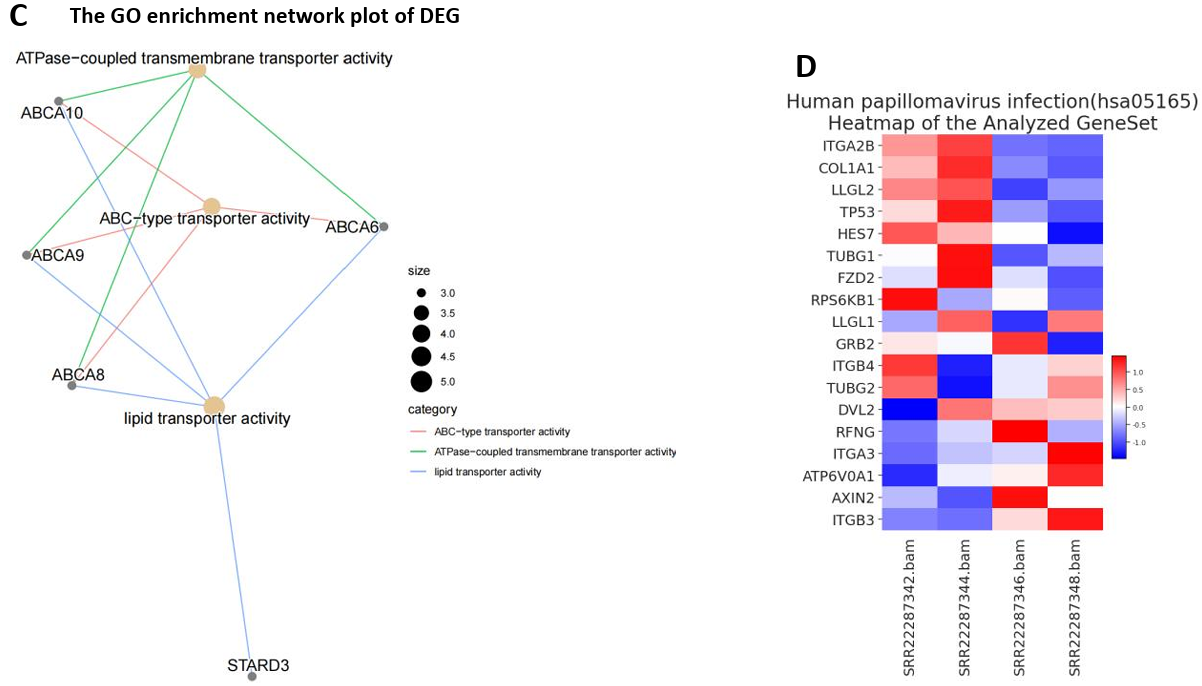
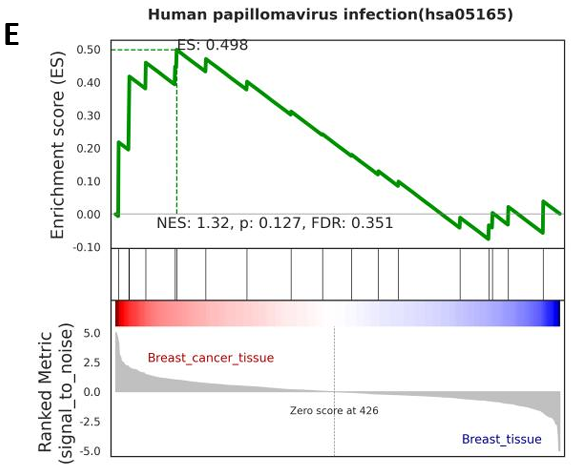
Figure 5. The Enrichment Analysis of Differentially Expressed Genes (DEGs). (A) Histogram of GO enrichment analysis for DEG (only BP type had the output results); (B) Histogram of KEGG enrichment analysis for DEG; (C) GO enrichment analysis network map for DEG (assisted observation of associated genes); (D) (E) Gene set enrichment analysis revealed the only significant enrichment pathway HPV and the gene expression patterns affecting it.
3.2. m6A Peak Spectrum (BC & Normal & Differentiation)
In the m6A omic study of breast cancer (BC) and normal tissue groups, we identified 6016 and 4635 m6A peaks, respectively (Fig. 6F). The m6A peak distribution and peak scores on the entire chromosome 17 were shown in Figure 6H. Then, the comparative analysis of the distribution proportions revealed notable differences: in the BC group, a higher percentage of m6A peaks was observed in the 5’UTR region (12.3%) compared to the normal group (10.2%). In contrast, the BC group showed lower proportions in the CDS and 3’UTR regions relative to the control group (Fig. 6C-E). Further detailed analysis presented in Figure 6A and 6B highlighted the regional distribution of these peaks on mRNA. We observed enrichment of m6A peaks near the transcription start site (TSS) and transcription termination site (TTS) in both groups. Notably, the BC group exhibited a marginally higher density of peaks in these regions compared to the normal group. Additionally, Figure 6G elucidated the variation in fold-change values (input versus IP) among the captured peaks within each group.
Overall, the observed enrichment pattern of m6A peaks aligned with the established consensus on m6A distribution, serving as an indirect validation of the sequencing sample quality.
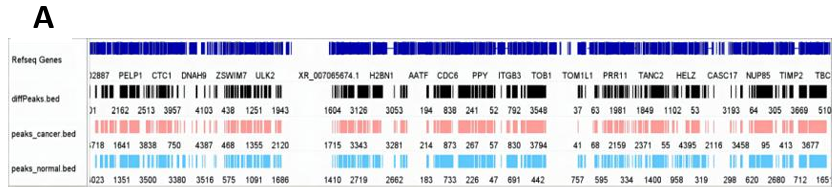
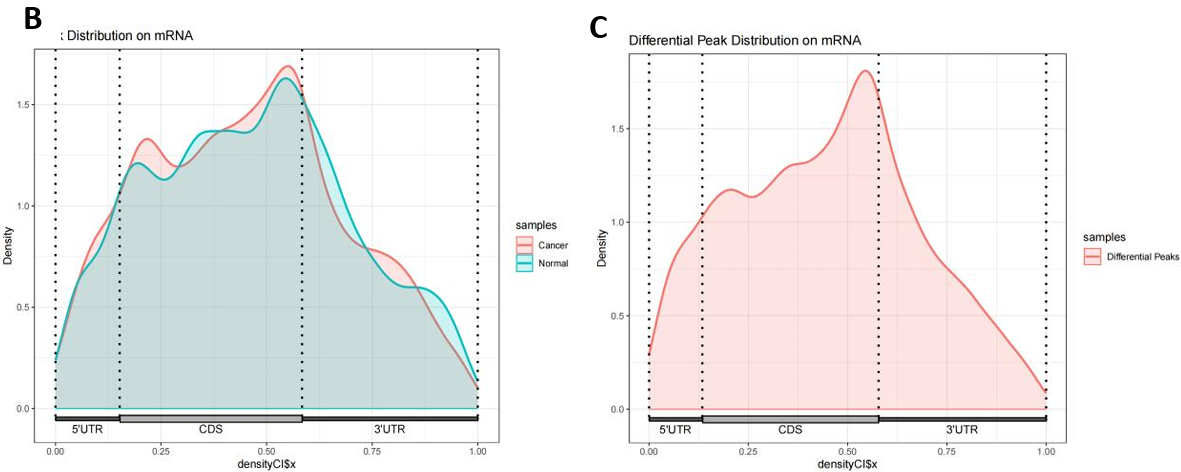
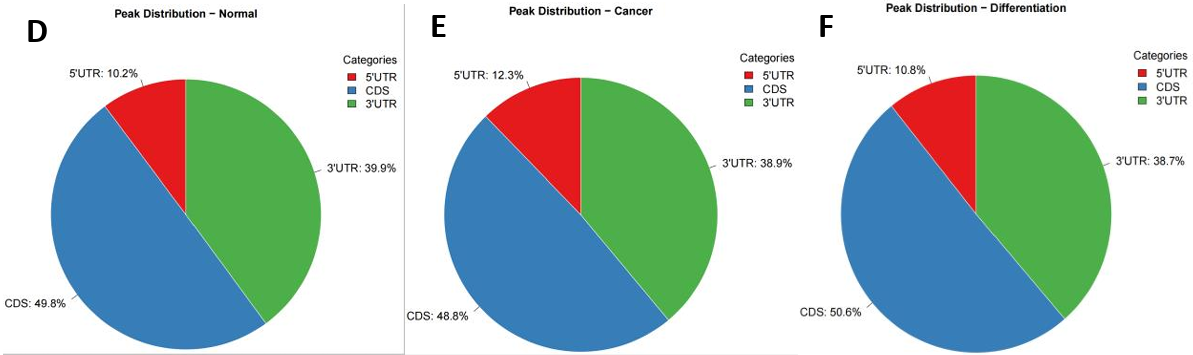
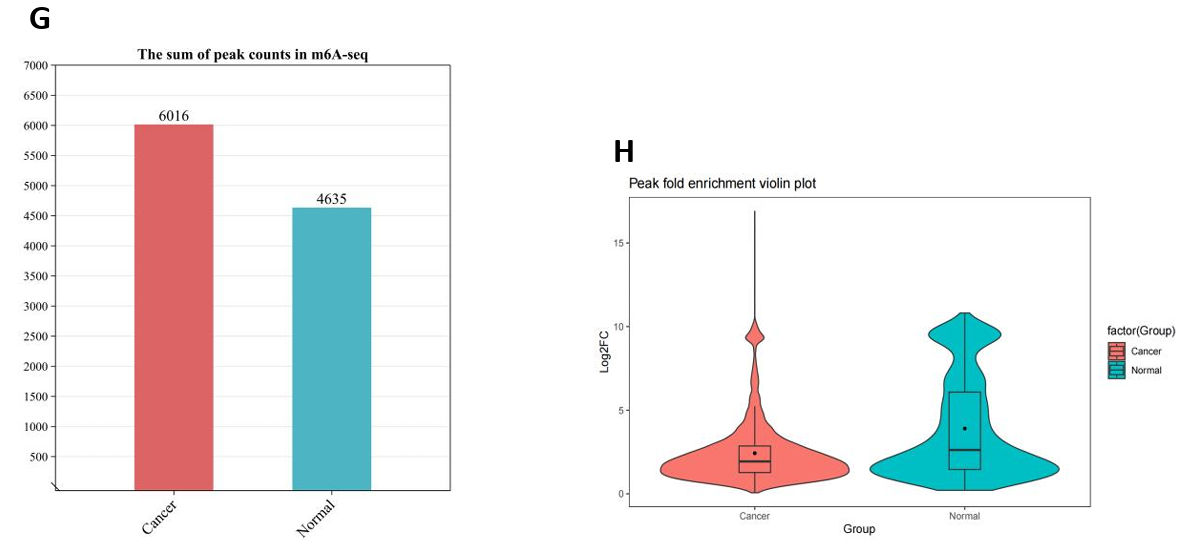
Figure 6. m6A modification spectrum. (A) IGV visualized m6A peak distribution and scores on whole chromosome 17, from top to bottom, as follows: difference peak (black), BC sample peak (pink), control group peak (light blue)[32]; (B) The guitar plots of BC and normal groups' m6A peak distribution on mRNA[33]; (C) The guitar plot of differential m6A peak distribution on mRNA[33]; (D - F) Pie charts of m6A distribution showing the proportions of the 3 region types under normal, cancer and differentiation conditions; (G) The bar plot of m6A peak counts; (H) The violin plot containing peak fold enrichment and distribution.
3.3. The Enrichment Analysis Demonstrated the Comprehensive Impact of Differential m6A Modification on Various Functions
After both two groups’ m6A peak examinations, ExomePeak2 was continuously used to identify differential m6A peaks in the breast cancer (BC) group in comparison to normal controls [12]. This approach led to the identification of 781 genes associated with these differential m6A peaks. Subsequent GO enrichment analysis elucidated the functional implications of these peaks, revealing two major pathways significantly associated with the epidermal growth factor response (Fig. 7A). Among the enriched genes, the cross genes (as observed in the joint analysis) included ERBB2, MED1, and CDL1A1, with the highest proportion in all pathways (3/10) (Fig. 7B). Additionally, two pathways, namely “regulation of signal transduction by P53 class mediator” and “chromosome segregation,” each implicated TP53 and BRCA1, respectively, potentially suggesting a potential downstream impact of m6A modification on these key genes in breast cancer pathology (Fig. 7B).
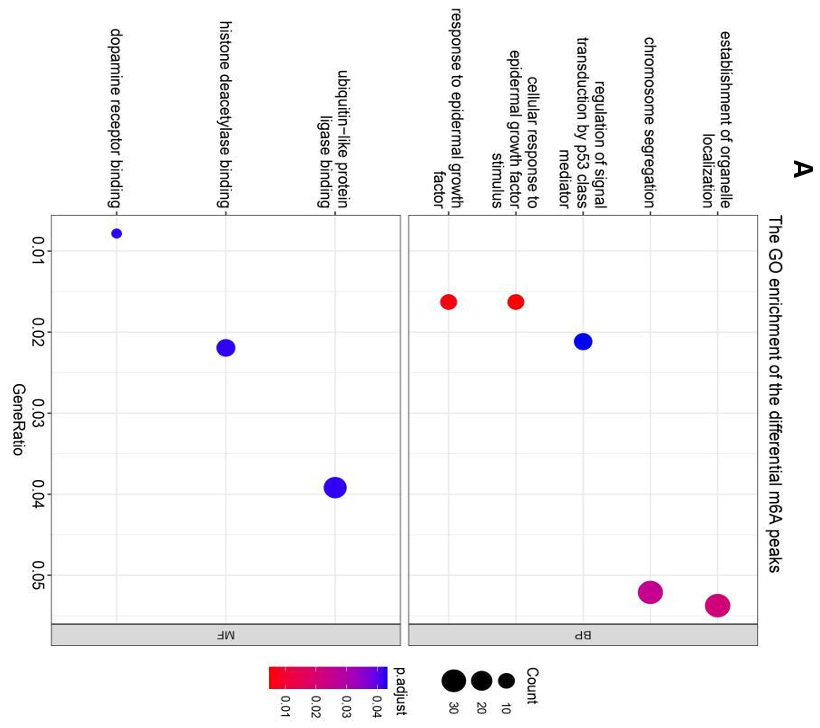
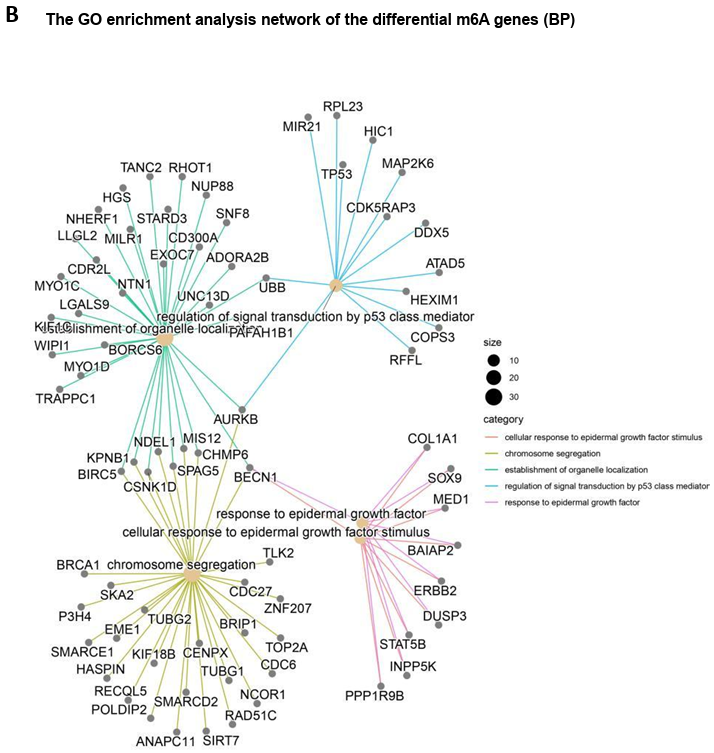
Figure 7. m6A differential genes’ GO enrichment analysis. (A) The bubble map shows differential m6A modification gene enrichment of "BP" and "MF"; (B) The network map represents the associations between the "BP" pathways as well as the numbers and names of genes enriched.
3.4. Integrated Pathway Analysis: Confidence Target Gene List & Enrichment Results Corresponding to Single-Omics
Furthermore, integrated analysis was performed to extract the confident gene list and explore gene functions. Firstly, an intersection was taken between the differential genes obtained from the two single-omics, capturing 53 genes that simultaneously exhibited differential m6A modification and mRNA expression characteristics (Fig. 8A). This dual characteristic not only suggested that changes in expression could be influenced by variations in m6A modification but also bolstered the reliability of these genes as dynamic markers of reversible m6A modifications. Consequently, this robust list of 53 genes (detailed in Appendix 1) was designated as the primary screening set for the target genes subsequently.
Following this, an enrichment analysis using the KEGG was conducted on these overlapping genes [15]. This analysis highlighted one significant pathway - “ABC transporters.” which included 3 ABCA subfamily genes of “ABCA6”, “ABCA8” and “ABCA10” (Fig. 8B). Complementarily, the Protein-Protein Interaction (PPI) network analysis elucidated expression correlations among these intersecting genes, pinpointing central hub genes such as ERBB2, TOP2A, STAT5A, EVPL, among others [19] (Fig. 8E). Notably, a pronounced correlation in expression was observed between ABCA8 and ABCA6, which were critical regulatory genes in the ABC transporter system (Fig. 8E).
Furthermore, the DisGeNET enrichment analysis was employed to explore potential disease associations of these intersecting genes [18]. Remarkably, all 53 genes showed enrichment in various cancer-related diseases (Fig. 8C-D). Specifically, three breast cancer subtypes - “Luminal B Breast Carcinoma,” “Monosomy,” and “Metastatic human epidermal growth factor 2 positive Carcinoma of Breast” - were prominent, all closely related to the Breast Epidermal Growth Factor category (Fig. 8C). This correlation with disease phenotypes aligned with the epidermal growth factor response pathways identified in the differential m6A gene enrichment analysis, shedding light on specific breast cancer types potentially influenced by m6A-mediated gene expression alterations. Finally, the observed enrichment in other cancer types might offer insights into potential comorbidity associations linked to these intersecting genes.
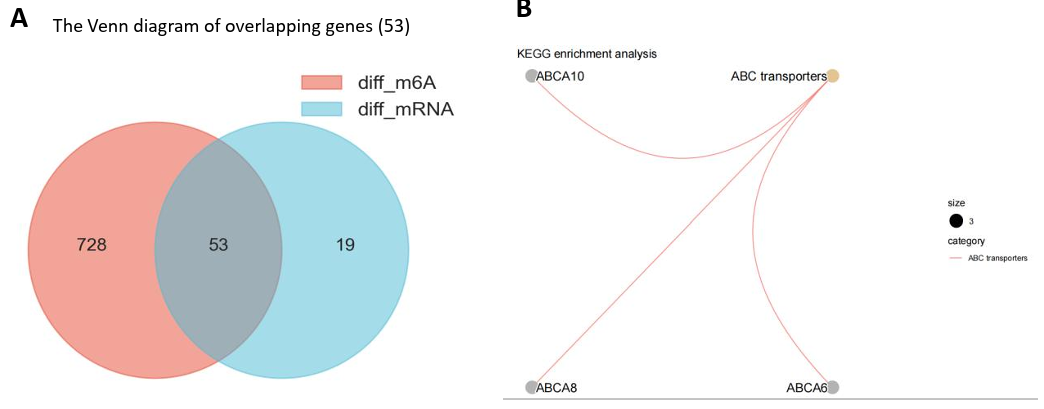
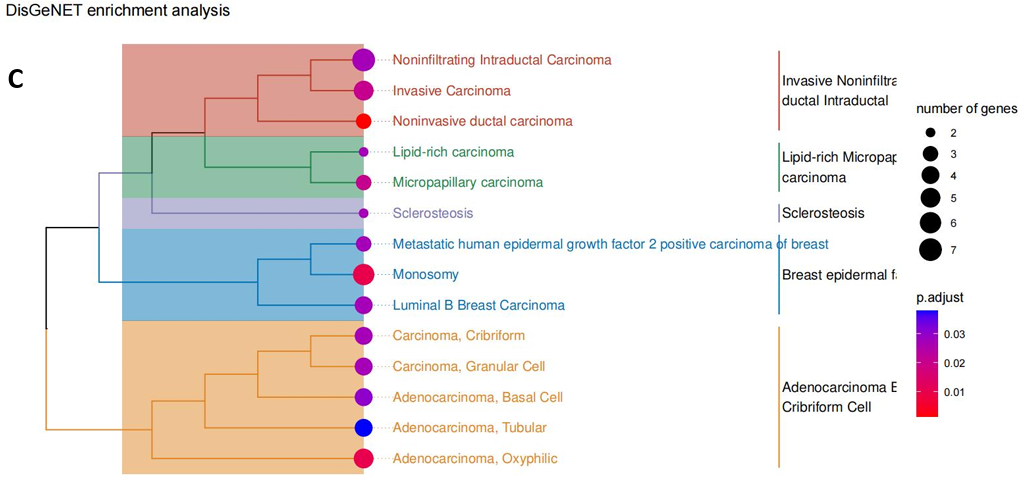
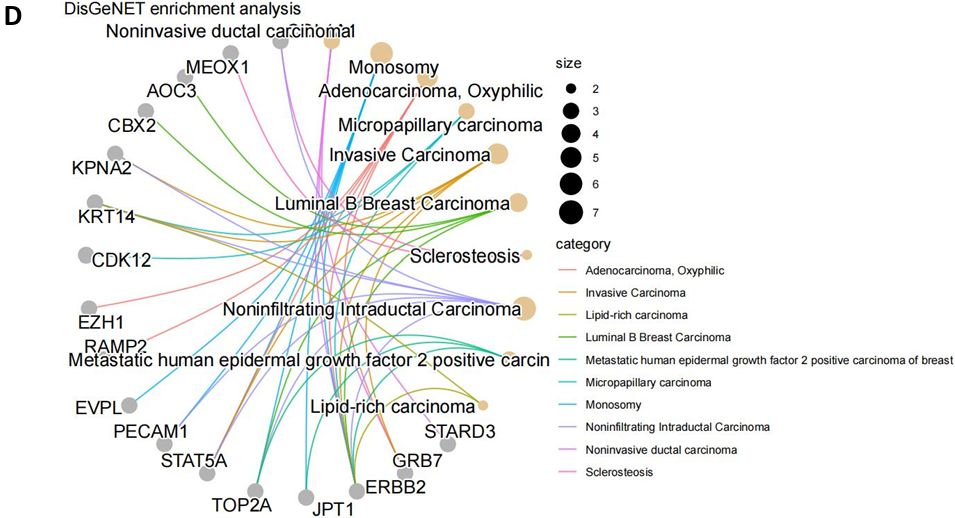
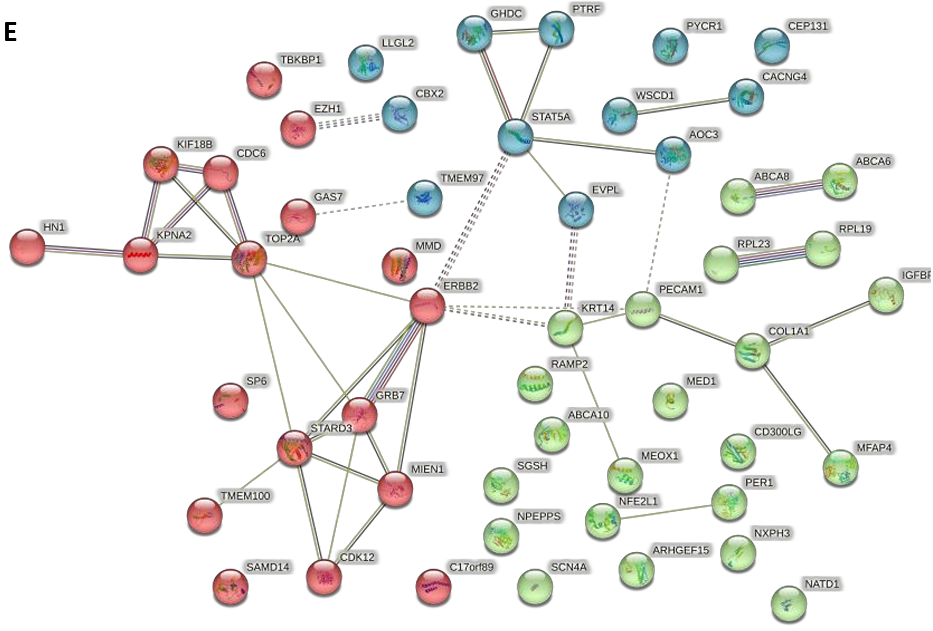
Figure 8. Integrated Pathway Analysis. (A) The Venn diagram of 53 overlapping genes obtained from 72 differentially expressed (mRNA) genes and 781 differentially modified m6A genes. (B) KEGG enrichment network of intersection genes; (C-D) DisGeNET enrichment analysis diagrams: showing cross-gene enriched disease types (3 breast cancer subtypes were associated with EGF) and associated gene names. (E) The protein - protein interaction network contained the expression correlation of 53 genes, in which key genes such as ERBB2, STAT5A, TOP2A were found, and close correlation between ABCA8 and ABCA6 was observed.
4. Discussion
Extensive research has explored the pathogenic genes and mechanisms underlying breast cancer, yet the role of m6A modification, a major epigenetic alteration of mRNA, remains underexplored, particularly its effects on the transcripts and distant phenotype associations [20]. In the study, RNA-seq and MeRIP-seq (m6A) were utilized to analyze differentially expressed mRNA genes and m6A differential peak genes in BC and normal tissues. Additionally, we conducted enrichment analysis to assess the distinct functional roles of these differentially expressed genes.
The findings revealed that the differentially expressed genes were predominantly enriched in pathways associated with ABC transporters. Meanwhile, the differential m6A genes were significantly involved in processes linked to epidermal growth factor response, cellular localization, and chromosome segregation. An integrated analysis of these genes provided a deeper understanding of their m6A-mediated differential expressions and functions.
In the KEGG database, an overlap of 53 genes showed similar enrichment in the ABC transporters pathway, and DisGeNET’s enrichment analysis further affirmed the link between epidermal growth factors and m6A modification in breast cancer subtypes. Additionally, a protein-protein interaction network pinpointed key genes such as ERBB2 (related to epidermal growth factors) and core genes like ABCA6 and ABCA8 (associated with ABC transporters), highlighting them as potential m6A targets in breast cancer.
4.1. ABC Transporter Genes
ATP-binding cassette (ABC) transporters, a group of transmembrane proteins, facilitated substrate transport through ATP hydrolysis [21]. In the research, four subfamily A member genes (ABCA6, ABCA8, ABCA9, and ABCA10) were differentially expressed, with significant downregulation (log2FC < -3) in breast cancer samples. The m6A target genes overlapped with all but ABCA9. Particularly, these genes were the sole enriched pathway’s genes in the intersection, indicating a potential association between the ABC transporter pathway and DEG enrichment activities in breast cancer, which may involve m6A modification.
Literature on m6A modification of ABC transporter genes in breast cancer was rare. However, extensive evidence linked these genes to breast cancer development and drug resistance. Overexpression of the ABCA8 gene, for instance, could inhibit breast cancer cell proliferation, whereas its low expression correlates with adverse clinical features in patients [22]. ABCA10, known for its low expression and regulatory pattern influenced by immune infiltration and promoter methylation, emerged as a potential target for precision therapy and a novel prognostic biomarker [23]. Moreover, ABC transporter family genes were intricately connected to multidrug resistance (MDR) in cancer chemotherapy [24]. Their overexpression, a primary mechanism for acquired drug resistance, positioned them as potential therapeutic targets to combat cancer drug resistance [25]. Thus, investigating ABC transporter genes as m6A targets in breast cancer might offer a new epigenetic perspective on this complex therapeutic challenge. According to the confidence gene list, among the ABC family genes, ABCA6, ABCA8, and ABCA10 were selected as cautious but reliable choices for differential expression target genes regulated by m6A modification in breast cancer.
4.2. Epidermal Growth Factor & ERBB2
Beyond the realm of ABC transporters, the Epidermal Growth Factor (EGF) standed as another molecule with significant functional relevance. EGF was instrumental in triggering signaling pathways that were pivotal for cell proliferation and differentiation, accomplished through its interaction with EGF receptors [26]. This analysis distinctly underscored the association between EGF and m6A differential modification. Notably, the differentially expressed genes (DEGs) mediated by m6A differential modification were significantly enriched across three breast cancer subtypes, all of which were closely related to breast epidermal factors. This observation was in harmony with our single-omics m6A-seq data, which demonstrated marked “response to epidermal growth factor” and “cellular response to epidermal growth factor stimulus” pathways, thereby highlighting the impact of m6A modification on the downstream responses of epidermal growth factor in breast cancer tissues.
In examining the genes enriched within these pathways, alongside their correlations across three breast cancer subtypes, the gene ERBB2 was consistently identified as a common element. Within the protein-protein interaction network, composed of 53 intersecting genes, ERBB2 assumed a critical role as a central hub gene. It established connections with key genes such as STAT5A, TOP2A, and STARD3, each playing a significant role in breast cancer subtypes or within the m6A-seq enrichment pathways. Specifically, TOP2A was involved in “chromosome segregation” pathway, while STARD3 was crucial for “the establishment of organelle localization” pathway. Hence, ERBB2 positioned itself as an exemplary m6A target gene in the analysis.
The role of EGF in breast cancer has been extensively researched, particularly focusing on the Human Epidermal Growth Factor Receptor 2 (HER2). HER2-positive breast cancer was recognized as a distinct subtype, with a substantial amount of research centered around pathways pertinent to HER2-positive subtypes. In the KEGG database, the pathway labeled “Breast cancer” (hsa05224) included two pathways that involved ERBB2: the “ERBB2-overexpression to RAS-ERK signaling pathway” (N00022) and the “ERBB2-overexpression to PI3K signaling pathway” (N00034) [27]. As illustrated in Figure 9, the overexpression of ERBB2 in HER2-positive breast cancer significantly influenced the downstream RAS-ERK and PI3K signaling pathways through EGFR and HER2, thereby confirming the crucial role of ERBB2 in EGF-related pathways within breast cancer. However, despite known overexpression of ERBB2 in breast and ovarian tumors, insights into its transcriptome have been largely restricted to selective splicing and a few transcription variants [28-29]. This gap underscored the necessity for further research to delve into the role of epigenetics, especially m6A modification, in the regulation of these downstream effects.
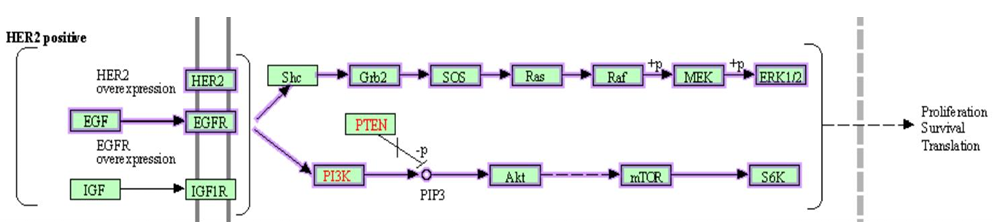
Figure 9. Two influenced pathways of ERBB2 in KEGG “Breast cancer” pathway (hsa05224): "ERBB2-overexpression to RAS-ERK signaling pathway" (N00022) and "ERBB2-overexpression to PI3K signaling pathway" (N00034).
4.3. TP53 & BRCA1
In this analysis, we examined that TP53 and BRCA1, star genes in breast cancer, were identified exclusively as mRNA differential expression genes, without featuring in the m6A differential modification gene list. The data demonstrated an upregulation of both TP53 and BRCA1 transcripts in breast cancer samples, with BRCA1 showing a more pronounced increase (log2FC: 1.94 vs. 1.64) (Fig. 10D). This finding contrasted with the established understanding of TP53 and BRCA1’s roles in breast cancer.
Typically, BRCA1, which coded for the BRCA protein crucial in DNA damage sensing and repair, was considered a tumor suppressor gene [30]. Therefore, it was generally considered to be downregulated in cancer [31]. Similarly, TP53, encoding the P53 protein responsible for cell cycle regulation, DNA repair, and apoptosis, was also categorized as a tumor suppressor gene [31]. However, the comprehensive analysis revealed a discrepancy between these theoretical roles and the results.
Specifically, according to DESeq2 analysis results, neither gene showed statistical significance (padj > 0.05), a situation that might stem from a limited sample size (Fig. 10D). Other potential explanations include variations in sequencing quality, or differences in gene expression levels specific to breast cancer subtypes or certain mutations.
Additionally, m6A modification peaks of TP53 and BRCA1 were shown in Figure 10B and 10C for further check.
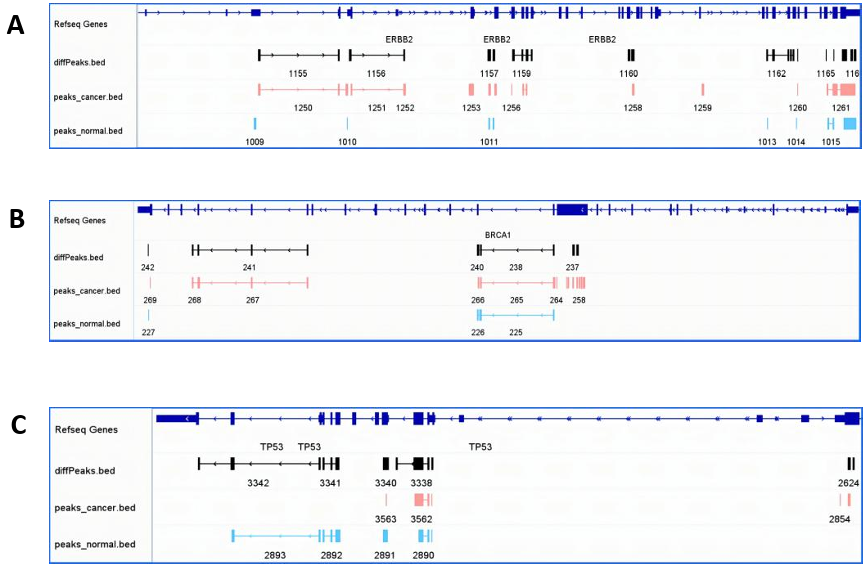
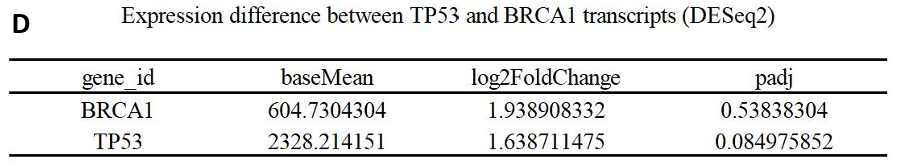
Figure 10. m6A modification peaks of ERBB2, TP53, BRCA1 under IGV visualization & The table of TP53 and BRCA1 differential comparsion outcomes between groups (DESeq2) (Breast cancer tissue vs. Normal breast tissue). (A)ERBB2’s m6A peaks’ distribution and scores under three conditions (Differentiation, BC, Normal); (B)BRCA1’s m6A peaks’ distribution and scores under three conditions (Differentiation, BC, Normal); (C)TP53’s m6A peaks’ distribution and scores under three conditions (Differentiation, BC, Normal); (D) The DESeq2 results of TP53 and BRCA1.
4.4. Limitations
The analysis in this study faced certain limitations which might impact the outcomes. Initially, the raw sample data, foundational to the analysis, have some deficiencies. It was possible that the use of a relatively small number of sequencing samples led to statistically insignificant results or statistical bias. This limitation also restricted the ability to employ broader analysis or modeling techniques, such as Weighted Gene Co-expression Network Analysis (WGCNA) or machine learning. Moreover, the categorization of breast tissue cancer samples lacked detailed subtyping, which impeded a more nuanced analysis. Furthermore, the analysis was restricted by hardware constraints, specifically the server capacity, which resulted in the only focused research on genes located on chromosome 17. This focus potentially led to a narrow view of m6A and mRNA interactions, neglecting a more comprehensive analysis of gene correlations. For instance, the exploration of the functional associations between BRCA2 and BRCA1 genes, which were situated on chromosome 13 could not be achieved. Lastly, regarding the methodology, the read counts matrix generated using the “summarizeOverlaps” function had not been subjected to PKDF transformation, a decision influenced by time and technical constraints. This omission could have further implications for the depth and accuracy of the analysis.
5. Conclusion
In conclusion, our study provided a comprehensive examination of the mRNA transcriptome and m6A methylome on chromosome 17 in human breast cancer tissue, compared to normal breast tissue. The integrative analysis of single-omics datasets highlighted a robust list of genes that were distinctly regulated by m6A modification in BC. Notably, two pathway types were observed as the significant enrichment of functions related to ABC transporter protein activity and epidermal growth factor signaling. Besides, among the identified target genes, ERBB2, characterized as a hub gene, along with ABC transporter genes containing ABCA6, ABCA8, and ABCA10, emerged as promising biomarkers, distinct from well-known genes like TP53 and BRCA1. Further, the findings suggested a potential link between the enrichment of co-occurring HPV in breast cancer and shared differential expression patterns of transcriptional transcripts. Today, the increasing recognition of m6A modifications in cancer underscored the need for further research into the m6A target genes in breast cancer. In the future, such research in this area will unveil new RNA-binding proteins (methyltransferases) as potential therapeutic targets, paving the way for innovative targeted therapy strategies in the realm of m6A epigenetics. Additionally, the integration of multi-omics studies with clinical data analysis will also promise to deepen our understanding of the underlying biological processes associated with transcriptional differences and their correlations with breast cancer progression at the same time.
Acknowledgements
I would like to express my gratitude to Dr. Zhen Wei for his invaluable guidance and technical support throughout the entire project. He provided pre-processed and quality-controlled samples, as well as other essential resources such as genome annotations and relevant links or files. We appreciate his time and effort, which have laid a crucial foundation for the success of this project.
References
[1]. Fang, Z., Mei, W., Qu, C., Lu, J., Shang, L., Cao, F. & Li, F. (2022). Role of m6A writers, erasers and readers in cancer. Exp Hematol Oncol, 11, 45.
[2]. Siegel, R. L., Miller, K. D., Fuchs, H. E. & Jemal, A. (2022). Cancer statistics, 2022. CA Cancer J Clin, 72, 7-33.
[3]. Arnold, M., Morgan, E., Rumgay, H., Mafra, A., Singh, D., Laversanne, M., Vignat, J., Gralow, J. R., Cardoso, F., Siesling, S. & Soerjomataram, I. (2022). Current and future burden of breast cancer: Global statistics for 2020 and 2040. Breast, 66, 15-23.
[4]. Petri, B. J. & Klinge, C. M. (2023). m6A readers, writers, erasers, and the m6A epitranscriptome in breast cancer. J Mol Endocrinol, 70.
[5]. Modi, A., Roy, D., Sharma, S., Vishnoi, J. R., Pareek, P., Elhence, P., Sharma, P. & Purohit, P. (2022). ABC transporters in breast cancer: their roles in multidrug resistance and beyond. J Drug Target, 30, 927-947.
[6]. Desai, P. & Aggarwal, A. (2021). Breast Cancer in Women Over 65 years- a Review of Screening and Treatment Options. Clin Geriatr Med, 37, 611-623.
[7]. National Center for Biotechnology Information (2023) Sequence Read Archive: SRP407941. Available at: https://www.ncbi.nlm.nih.gov/Traces/study/?acc=SRP407941&o=acc_s%3Aa (Accessed: October 10, 2023)
[8]. Kim, D., Langmead, B., & Salzberg, S. L. (2015). HISAT: a fast spliced aligner with low memory requirements. Nature Methods, 12, 357–360.
[9]. Li, H., Handsaker, B., Wysoker, A., Fennell, T., Ruan, J., Homer, N., Marth, G., Abecasis, G., Durbin, R., & 1000 Genome Project Data Processing Subgroup. (2009). The Sequence alignment/map (SAM) format and SAMtools. Bioinformatics, 25(16), 2078-2079.
[10]. Bioconductor Core Team. (2023). TxDb.Hsapiens.UCSC.hg38.knownGene. Bioconductor version: Release (3.18). DOI: 10.18129/B9.bioc.TxDb.Hsapiens.UCSC.hg38.knownGene.
[11]. Pagès, H., Obenchain, V., Morgan, M., & Castelo, R. (2023). GenomicAlignments: Representation and manipulation of short genomic alignments. Bioconductor version: Release (3.18). DOI: 10.18129/B9.bioc.GenomicAlignments.
[12]. Wei, Z. (2023). ExomePeak2: Peak Calling and differential analysis for MeRIP-Seq. Bioconductor version: Release (3.18). DOI: 10.18129/B9.bioc.exomePeak2.
[13]. Love, M., Ahlmann-Eltze, C., Forbes, K., Anders, S., Huber, W. (2023). DESeq2: Differential gene expression analysis based on the negative binomial distribution. Bioconductor version: Release (3.18). DOI: 10.18129/B9.bioc.DESeq2.
[14]. Gene Ontology Consortium. The Gene Ontology (GO) database and informatics resource. Nucleic Acids Res. 32, D258-D261 (2004).
[15]. Kanehisa, M., Sato, Y., Kawashima, M., Furumichi, M. & Tanabe, (2016). KEGG as a reference resource for gene and protein annotation. Nucleic Acids Res, 44, D457-D462.
[16]. Yu, G., Wang, L., Han, Y., & He, Q. (2023). ClusterProfiler: A universal enrichment tool for interpreting omics data. Bioconductor version: Release (3.18). DOI: 10.18129/B9.bioc.clusterProfiler.
[17]. Subramanian, A., Tamayo, P., Mootha, V.K., et al. Gene set enrichment analysis: A knowledge-based approach for interpreting genome-wide expression profiles. Proc Natl Acad Sci U S A, 102, 15545-15550 (2005).
[18]. Piñero, J., Queralt-Rosinach, N., Bravo, À., Deu-Pons, J., Bauer-Mehren, A., Baron, M., ... & Furlong, L.I. (2017). DisGeNET: a comprehensive platform integrating information on human disease-associated genes and variants. Nucleic Acids Research, 45(D1), D833-D839.
[19]. Szklarczyk, D., Franceschini, A., Wyder, S., Forslund, K., Heller, D., Huerta-Cepas, J., ... & Mering, C. V. (2015). STRING v10: protein-protein interaction networks, integrated over the tree of life. Nucleic acids research, 43(D1), D447-D452.
[20]. Huber-Keener, K. J. (2022). Cancer genetics and breast cancer. Best Pract Res Clin Obstet Gynaecol, 82, 3-11.
[21]. Kaminski, W. E., Wenzel, J. J., Piehler, A., Langmann, T. & Schmitz, G. (2001). ABCA6, a novel a subclass ABC transporter. Biochem Biophys Res Commun, 285, 1295-301.
[22]. Lv, C., Yang, H., Yu, J. & Dai, X. (2022). ABCA8 inhibits breast cancer cell proliferation by regulating the AMP activated protein kinase/mammalian target of rapamycin signaling pathway. Environ Toxicol, 37, 1423-1431.
[23]. Chu, P. Y., Tzeng, Y. T., Tsui, K. H., Chu, C. Y. & Li, C. J. (2022). Downregulation of ATP binding cassette subfamily a member 10 acts as a prognostic factor associated with immune infiltration in breast cancer. Aging (Albany NY), 14, 2252-2267.
[24]. Amawi, H., Sim, H. M., Tiwari, A. K., Ambudkar, S. V. & Shukla, S. (2019). ABC Transporter-Mediated Multidrug-Resistant Cancer. Adv Exp Med Biol, 1141, 549-580.
[25]. Wang, Y., Wang, Y., Qin, Z., Cai, S., Yu, L., Hu, H. & Zeng, S. (2021). The role of non-coding RNAs in ABC transporters regulation and their clinical implications of multidrug resistance in cancer. Expert Opin Drug Metab Toxicol, 17, 291-306.
[26]. Hu, L., Su, L., Cheng, H., Mo, C., Ouyang, T., Li, J., Wang, T., Fan, Z., Fan, T., Lin, B., Zhang, J. & Xie, Y. (2021). Single-Cell RNA Sequencing Reveals the Cellular Origin and Evolution of Breast Cancer in BRCA1 Mutation Carriers. Cancer Res, 81, 2600-2611.
[27]. Kanehisa Laboratories (2023). Breast cancer - Homo sapiens (human). KEGG Pathway Database. Available at: https://www.kegg.jp/pathway/hsa05224 [Accessed 31 October 2023]
[28]. Hou, Y., Peng, Y. & Li, Z. (2022) ‘Update on prognostic and predictive biomarkers of breast cancer’, Semin Diagn Pathol, 39, 322-332.
[29]. Sadeque, A., Serão, N. V., Southey, B. R., Delfino, K. R. & Rodriguez-Zas, S. L. (2012). Identification and characterization of alternative exon usage linked glioblastoma multiforme survival. BMC Med Genomics, 5, 59.
[30]. Mahdavi, M., Nassiri, M., Kooshyar, M. M., Vakili-Azghandi, M., Avan, A., Sandry, R., Pillai, S., Lam, A. K. & Gopalan, V. (2019). Hereditary breast cancer; Genetic penetrance and current status with BRCA. J Cell Physiol, 234, 5741-5750.
[31]. Sheikh, A., Hussain, S. A., Ghori, Q., Naeem, N., Fazil, A., Giri, S., Sathian, B., Mainali, P. & Al Tamimi, D. M. (2015). The spectrum of genetic mutations in breast cancer. Asian Pac J Cancer Prev, 16, 2177-85.
[32]. Robinson, J. T., Thorvaldsdóttir, H., Winckler, W., Guttman, M., Lander, E. S., Getz, G., & Mesirov, J. P. (2011). Integrative Genomics Viewer. Nature Biotechnology, 29, 24-26.
[33]. Du, X., Liu, H., Zhang, L., & Meng, J. (2023). Guitar. Bioconductor version: Release (3.18). DOI: 10.18129/B9.bioc.Guitar.
Cite this article
Wang,M. (2024). Exploring the transcriptomic and m6a landscape of human chromosome 17 in breast cancer: A combined RNA-seq and MeRIP-Seq analysis. Theoretical and Natural Science,40,117-138.
Data availability
The datasets used and/or analyzed during the current study will be available from the authors upon reasonable request.
Disclaimer/Publisher's Note
The statements, opinions and data contained in all publications are solely those of the individual author(s) and contributor(s) and not of EWA Publishing and/or the editor(s). EWA Publishing and/or the editor(s) disclaim responsibility for any injury to people or property resulting from any ideas, methods, instructions or products referred to in the content.
About volume
Volume title: Proceedings of the 4th International Conference on Biological Engineering and Medical Science
© 2024 by the author(s). Licensee EWA Publishing, Oxford, UK. This article is an open access article distributed under the terms and
conditions of the Creative Commons Attribution (CC BY) license. Authors who
publish this series agree to the following terms:
1. Authors retain copyright and grant the series right of first publication with the work simultaneously licensed under a Creative Commons
Attribution License that allows others to share the work with an acknowledgment of the work's authorship and initial publication in this
series.
2. Authors are able to enter into separate, additional contractual arrangements for the non-exclusive distribution of the series's published
version of the work (e.g., post it to an institutional repository or publish it in a book), with an acknowledgment of its initial
publication in this series.
3. Authors are permitted and encouraged to post their work online (e.g., in institutional repositories or on their website) prior to and
during the submission process, as it can lead to productive exchanges, as well as earlier and greater citation of published work (See
Open access policy for details).
References
[1]. Fang, Z., Mei, W., Qu, C., Lu, J., Shang, L., Cao, F. & Li, F. (2022). Role of m6A writers, erasers and readers in cancer. Exp Hematol Oncol, 11, 45.
[2]. Siegel, R. L., Miller, K. D., Fuchs, H. E. & Jemal, A. (2022). Cancer statistics, 2022. CA Cancer J Clin, 72, 7-33.
[3]. Arnold, M., Morgan, E., Rumgay, H., Mafra, A., Singh, D., Laversanne, M., Vignat, J., Gralow, J. R., Cardoso, F., Siesling, S. & Soerjomataram, I. (2022). Current and future burden of breast cancer: Global statistics for 2020 and 2040. Breast, 66, 15-23.
[4]. Petri, B. J. & Klinge, C. M. (2023). m6A readers, writers, erasers, and the m6A epitranscriptome in breast cancer. J Mol Endocrinol, 70.
[5]. Modi, A., Roy, D., Sharma, S., Vishnoi, J. R., Pareek, P., Elhence, P., Sharma, P. & Purohit, P. (2022). ABC transporters in breast cancer: their roles in multidrug resistance and beyond. J Drug Target, 30, 927-947.
[6]. Desai, P. & Aggarwal, A. (2021). Breast Cancer in Women Over 65 years- a Review of Screening and Treatment Options. Clin Geriatr Med, 37, 611-623.
[7]. National Center for Biotechnology Information (2023) Sequence Read Archive: SRP407941. Available at: https://www.ncbi.nlm.nih.gov/Traces/study/?acc=SRP407941&o=acc_s%3Aa (Accessed: October 10, 2023)
[8]. Kim, D., Langmead, B., & Salzberg, S. L. (2015). HISAT: a fast spliced aligner with low memory requirements. Nature Methods, 12, 357–360.
[9]. Li, H., Handsaker, B., Wysoker, A., Fennell, T., Ruan, J., Homer, N., Marth, G., Abecasis, G., Durbin, R., & 1000 Genome Project Data Processing Subgroup. (2009). The Sequence alignment/map (SAM) format and SAMtools. Bioinformatics, 25(16), 2078-2079.
[10]. Bioconductor Core Team. (2023). TxDb.Hsapiens.UCSC.hg38.knownGene. Bioconductor version: Release (3.18). DOI: 10.18129/B9.bioc.TxDb.Hsapiens.UCSC.hg38.knownGene.
[11]. Pagès, H., Obenchain, V., Morgan, M., & Castelo, R. (2023). GenomicAlignments: Representation and manipulation of short genomic alignments. Bioconductor version: Release (3.18). DOI: 10.18129/B9.bioc.GenomicAlignments.
[12]. Wei, Z. (2023). ExomePeak2: Peak Calling and differential analysis for MeRIP-Seq. Bioconductor version: Release (3.18). DOI: 10.18129/B9.bioc.exomePeak2.
[13]. Love, M., Ahlmann-Eltze, C., Forbes, K., Anders, S., Huber, W. (2023). DESeq2: Differential gene expression analysis based on the negative binomial distribution. Bioconductor version: Release (3.18). DOI: 10.18129/B9.bioc.DESeq2.
[14]. Gene Ontology Consortium. The Gene Ontology (GO) database and informatics resource. Nucleic Acids Res. 32, D258-D261 (2004).
[15]. Kanehisa, M., Sato, Y., Kawashima, M., Furumichi, M. & Tanabe, (2016). KEGG as a reference resource for gene and protein annotation. Nucleic Acids Res, 44, D457-D462.
[16]. Yu, G., Wang, L., Han, Y., & He, Q. (2023). ClusterProfiler: A universal enrichment tool for interpreting omics data. Bioconductor version: Release (3.18). DOI: 10.18129/B9.bioc.clusterProfiler.
[17]. Subramanian, A., Tamayo, P., Mootha, V.K., et al. Gene set enrichment analysis: A knowledge-based approach for interpreting genome-wide expression profiles. Proc Natl Acad Sci U S A, 102, 15545-15550 (2005).
[18]. Piñero, J., Queralt-Rosinach, N., Bravo, À., Deu-Pons, J., Bauer-Mehren, A., Baron, M., ... & Furlong, L.I. (2017). DisGeNET: a comprehensive platform integrating information on human disease-associated genes and variants. Nucleic Acids Research, 45(D1), D833-D839.
[19]. Szklarczyk, D., Franceschini, A., Wyder, S., Forslund, K., Heller, D., Huerta-Cepas, J., ... & Mering, C. V. (2015). STRING v10: protein-protein interaction networks, integrated over the tree of life. Nucleic acids research, 43(D1), D447-D452.
[20]. Huber-Keener, K. J. (2022). Cancer genetics and breast cancer. Best Pract Res Clin Obstet Gynaecol, 82, 3-11.
[21]. Kaminski, W. E., Wenzel, J. J., Piehler, A., Langmann, T. & Schmitz, G. (2001). ABCA6, a novel a subclass ABC transporter. Biochem Biophys Res Commun, 285, 1295-301.
[22]. Lv, C., Yang, H., Yu, J. & Dai, X. (2022). ABCA8 inhibits breast cancer cell proliferation by regulating the AMP activated protein kinase/mammalian target of rapamycin signaling pathway. Environ Toxicol, 37, 1423-1431.
[23]. Chu, P. Y., Tzeng, Y. T., Tsui, K. H., Chu, C. Y. & Li, C. J. (2022). Downregulation of ATP binding cassette subfamily a member 10 acts as a prognostic factor associated with immune infiltration in breast cancer. Aging (Albany NY), 14, 2252-2267.
[24]. Amawi, H., Sim, H. M., Tiwari, A. K., Ambudkar, S. V. & Shukla, S. (2019). ABC Transporter-Mediated Multidrug-Resistant Cancer. Adv Exp Med Biol, 1141, 549-580.
[25]. Wang, Y., Wang, Y., Qin, Z., Cai, S., Yu, L., Hu, H. & Zeng, S. (2021). The role of non-coding RNAs in ABC transporters regulation and their clinical implications of multidrug resistance in cancer. Expert Opin Drug Metab Toxicol, 17, 291-306.
[26]. Hu, L., Su, L., Cheng, H., Mo, C., Ouyang, T., Li, J., Wang, T., Fan, Z., Fan, T., Lin, B., Zhang, J. & Xie, Y. (2021). Single-Cell RNA Sequencing Reveals the Cellular Origin and Evolution of Breast Cancer in BRCA1 Mutation Carriers. Cancer Res, 81, 2600-2611.
[27]. Kanehisa Laboratories (2023). Breast cancer - Homo sapiens (human). KEGG Pathway Database. Available at: https://www.kegg.jp/pathway/hsa05224 [Accessed 31 October 2023]
[28]. Hou, Y., Peng, Y. & Li, Z. (2022) ‘Update on prognostic and predictive biomarkers of breast cancer’, Semin Diagn Pathol, 39, 322-332.
[29]. Sadeque, A., Serão, N. V., Southey, B. R., Delfino, K. R. & Rodriguez-Zas, S. L. (2012). Identification and characterization of alternative exon usage linked glioblastoma multiforme survival. BMC Med Genomics, 5, 59.
[30]. Mahdavi, M., Nassiri, M., Kooshyar, M. M., Vakili-Azghandi, M., Avan, A., Sandry, R., Pillai, S., Lam, A. K. & Gopalan, V. (2019). Hereditary breast cancer; Genetic penetrance and current status with BRCA. J Cell Physiol, 234, 5741-5750.
[31]. Sheikh, A., Hussain, S. A., Ghori, Q., Naeem, N., Fazil, A., Giri, S., Sathian, B., Mainali, P. & Al Tamimi, D. M. (2015). The spectrum of genetic mutations in breast cancer. Asian Pac J Cancer Prev, 16, 2177-85.
[32]. Robinson, J. T., Thorvaldsdóttir, H., Winckler, W., Guttman, M., Lander, E. S., Getz, G., & Mesirov, J. P. (2011). Integrative Genomics Viewer. Nature Biotechnology, 29, 24-26.
[33]. Du, X., Liu, H., Zhang, L., & Meng, J. (2023). Guitar. Bioconductor version: Release (3.18). DOI: 10.18129/B9.bioc.Guitar.