


1. Introduction
Gastric cancer is the fourth most common type of cancer and the second leading cause of cancer-related deaths in the world [1–4]. It is estimated that gastric cancer will cause 12,000,000 deaths by 2030 [5]. Early diagnosis and treatment serve a pivotal role in ensuring patient survival rates for gastric cancer. However, gastric cancer diagnosis in its early stages is often challenging due to the lack of specific symptoms [4–6]. There have been many studies that indicate an association between altered metabolic signatures with gastric cancer [7]. It can provide a highly accurate and comprehensive understanding of anomalies within the stomach, oftentimes giving distinguishable characteristics between malignant and healthy conditions. Additionally, metabolic biomarkers can provide impressive diagnostic and prognostic value to gastric cancer, with some even considered as independent risk or predictive factors. They are critical in gastric cancer’s early-stage diagnosis and disease prognosis. Such metabolic biomarkers play a vital role in the cancer pathogenesis of metastasis. Being able to predict and detect such biomarkers can serve a crucial purpose in advancing gastric cancer diagnostic and therapeutic measures [8,9].
The methodological innovations in metabolomics-based approaches provide both qualitative and quantitative measurements of the metabolic signatures that are unique to cancerous tissue [7]. Additionally, gastric cancer tumors are heterogenous, meaning they will portray different metabolic phenotypes based on their constantly evolving microenvironment [10,11]. Recently, a study has demonstrated that information on altered metabolisms of gastric cancer cells provides additional guidance and advancement into gastric cancer diagnosis, prognosis, and treatment as the development of cancer cells requires alterations in its metabolism to adapt to its ever-changing hostile environment [10,12,13]. Specifically in gastric cancer, for instance, aerobic glycolysis is upregulated compared to that of normal gastric epithelium, forming an acidic microenvironment which aggravates the decomposition of extracellular matrixes and facilitates formation of blood vessels which transports needed nutrients to the tumor [7]. Lipid metabolism has also been discovered to alter in gastric cancer, with upregulated lipogenesis and enhanced fatty acid-β oxidation which works together to build up large amounts of fatty acids, ATP, and acetyl coenzyme-A to use as an energy source in the early stages of gastric cancer. The fatty acid synthase enzyme is also found to be upregulated in gastric cancer cells, which has been linked to chemoresistance, tumor proliferation, and relatively poor prognosis [7].
The discovery of tumor-specific biomarkers can be pivotal in effectively diagnosing and preventing gastric cancer [14]. Mass spectrometry imaging (MSI) is a technique that enables untargeted investigation of molecular species concerning the spatial distribution of a variety of samples [15]. It is a method that provides both the information from mass spectrometry and a visualization of the distribution of molecules within the sample, making it a powerful analytical tool in analyzing the metabolic biomarkers in cancer research [12,15]. Therefore, using MSI to investigate gastric cancer tissue will facilitate the identification of biomarkers and elucidate the heterogeneity of gastric cancer tissue [12]. This is an MSI data-based study that aims to use a computational imaging segmentation-based pipeline to analyze the differentially expressed metabolites and identify biomarkers across different tissue subtypes in gastric cancer.
In this study, we developed a computational imaging segmentation-based pipeline to analyze MSI data of gastric cancer for metabolic biomarker discovery. We first conducted the visualization processing based on the MSI raw data, followed by segmentation of MSI data using the spatial distribution patterns of tissue metabolic signatures. We will annotate the segmentation regions based on the histological images and, as the final step, analyse the differential expressed metabolites in different regions and conduct functional analysis to investigate their mechanistic roles in gastric cancer.
2. Methods and materials
2.1. Dataset preparation
Prior published data from studies using spatial metabolomics for gastric cancer biomarker discovery from the platform METASPACE (https://metaspace2020.eu/) were extracted for this study. The dataset was collected from frozen samples of human gastric cancer tissues in a project published in 2017 by Chenglong Sun et al., in which fresh, data uses TOF reflector as its analyzer and the sample uses MALDI as its source of ionization [12]. Four MALDI MSI data of gastric cancer samples were processed.
2.2. Data preprocessing
To perform data pre-processing, we first imported the MSI raw data in imzML formats using the cardinal package in R followed by a visual inspection of the quality of MSI data by plotting the image and the mass spectra. Several preprocessing steps were then conducted, including normalization, baseline correction, smoothing, and peak detection. As a result, spatially distributed images of metabolite intensity based on different metabolites expressed were generated.
2.3. Statistical analysis
To conduct MSI imaging segmentation, Principal Component Analysis (PCA) and spatial shrunken centroids were combined using cardinal packages in R as well. Different ways of segmentation to match the distribution of different biomarkers with different subtypes of tumor tissue were attempted concerning literature that performed histological analysis of the gastric cancer samples for MSI clustering. The spatially aware nearest shrunken centroid clustering was performed. To maximize the consensus of mass spectrometry imaging data and histological data, multiple k and s values were tested to create segmented images that separate areas of tissue based on metabolic signatures, and different tissue regions are segmented in histological images. The range of k values tested was +/- 2 of the number of different tissue sections in the histology images, and the range of s values tested was between 0 and 25 with intervals of 5. Specifically, we focused on maximizing the resemblance of the tumor tissue sections on histology images with the generated segmented images.
2.4. Functional analysis
Subsequently, lists of m/z values for each cluster were extracted and searched in the MetaboAnalyst (https://www.metaboanalyst.ca/) website to perform functional analysis with a negative ion mode and a mass tolerance of 5 ppm, ranked by t-scores. The functional analysis focused on the lipid sub-chemical class and the non-lipid sub-chemical class. From the functional analysis, we can successfully identify the metabolites detected from mass spectrometry imaging, thus enabling us to conduct pathway and network analysis of these metabolites. The functional analysis from MetaboAnalyst allows us to simultaneously identify metabolites and execute pathway analysis by unifying them under the same computational framework based on the assumption that annotations at individual compound levels can collectively predict changes at functional levels. Moreover, it also helps with reducing ambiguity in metabolite prediction as changes at the group level rely on “collective behavior” which is more tolerant to random errors in compound annotation [16].
3. Results
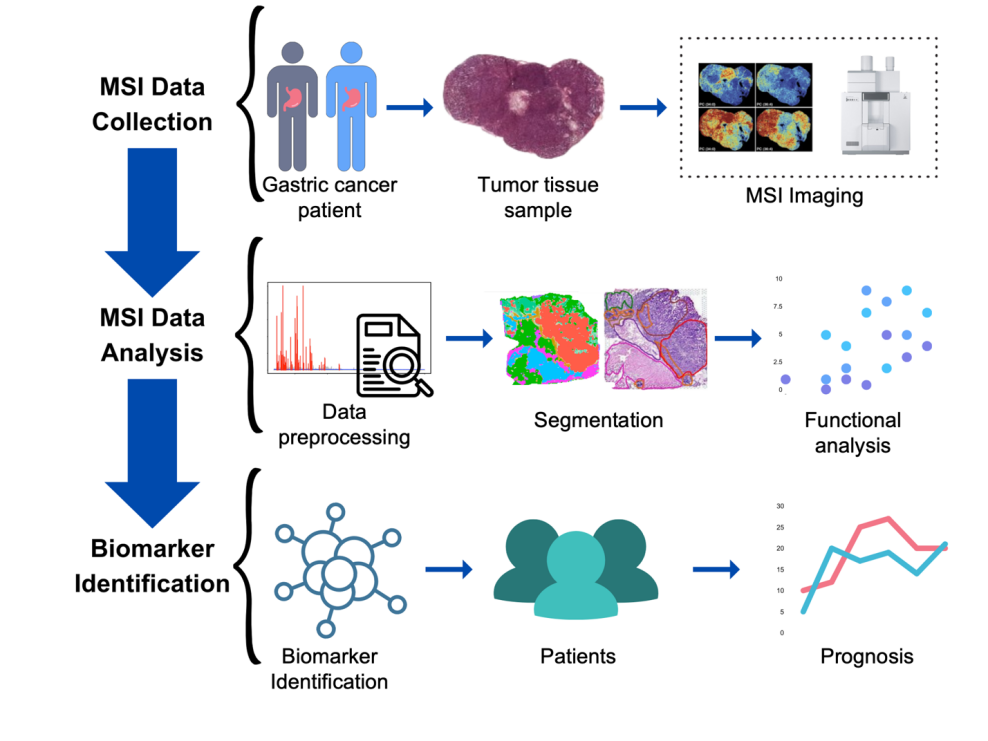
Figure 1. The framework of metabolic biomarker discovery in gastric cancer by mass spectrometry imaging metabolomics.
Figure 1 shows the framework of MSI-based metabolomics for biomarker discovery in gastric cancer. In this study, we used data collected from MSI imaging of multiple gastric cancer samples and performed a series of processing and analytical steps. Starting with data preprocessing where we first visualized the raw data downloaded and underwent peak picking processes. Subsequently, the four gastric cancer samples were segmented based on their differences in metabolic signatures. As a result, the metabolites within a sample are now separated into distinct clusters based on self-supervised methods. To further investigate the biological functions that these metabolites are correlated with, functional analysis can be carried out for the clusters that were created. In the end, this would lead to the discovery of biomarkers that could potentially be significant to the pathology of gastric cancer and could enhance our diagnosis and understanding of gastric cancer.
3.1. MSI segmentation by spatially aware nearest shrunken centroid clustering
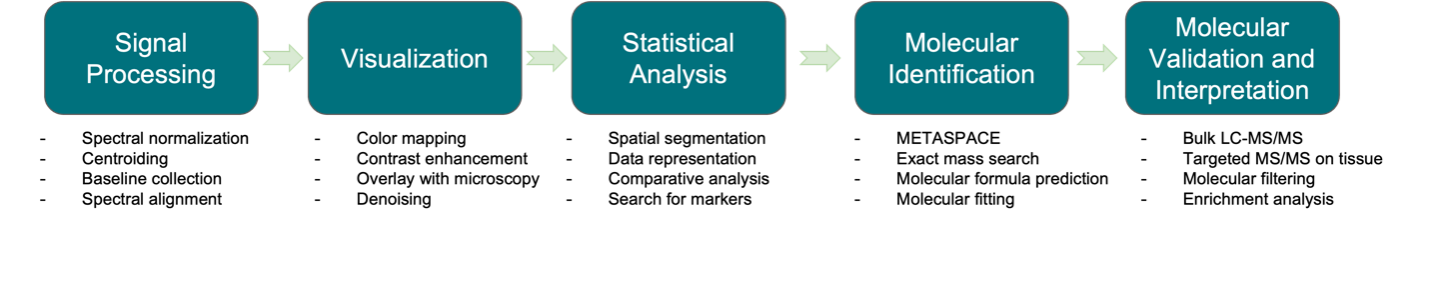
Figure 2. Data analysis pipeline of gastric cancer MSI data.
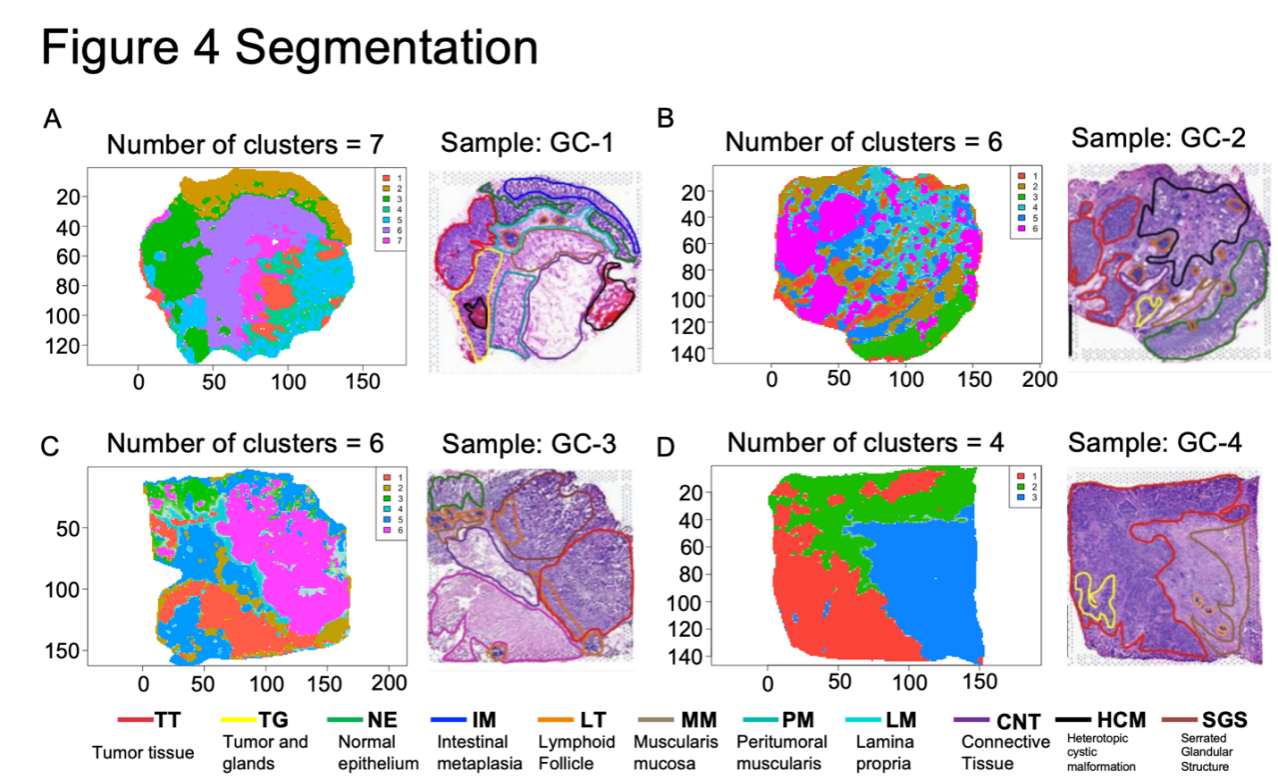
Figure 3. Segmentation results based on metabolic signatures
The complete MSI data analysis pipeline is shown in Figure 2. Specifically, to segment the datasets and distinguish them based on their metabolites concerning each sample’s spatial distribution, we used the spatially aware nearest shrunken centroid clustering provided by Cardinal. As described in Methods, we tried a variety of k and s values to maximize spatial resemblance between generated segmentation images and histological segmentation of tissue samples. As demonstrated in Figure 3, we were able to segment the images based on metabolic signatures in a way that was mostly similar to the histological sections. Especially in samples GC-1 and GC-2, the outlines of tumor tissue were almost perfectly recreated by generated segmentation images based solely on metabolic signatures. Aside from tumor tissues, some other tissue types were also matched well by the generated images. For example, the intestinal metaplasia tissue in GC-1, normal epithelium tissue in GC-2, and serrated glandular structure in GC-3 were all captured fairly accurately. The final parameters that were selected are shown in Table 1.
Table 1. Final optimized parameters in segmentation
Sample | Shrinkage/sparsity parameter (s) | Maximum numbers of segments attempted (k) | Optimized parameters |
GC-1 | 10,15,20,25 | 8, 9, 10, 11, 12 | k=7, s=0 |
GC-2 | 10,15,20,25 | 4, 5, 6, 7, 8 | k=6, s=10 |
GC-3 | 10,15,20,25 | 4, 5, 6, 7, 8 | k=6, s=25 |
GC-4 | 10,15,20,25 | 2,3,4,5,6 | k=4, s=25 |
3.2. Functional analysis of metabolic signatures in gastric cancer
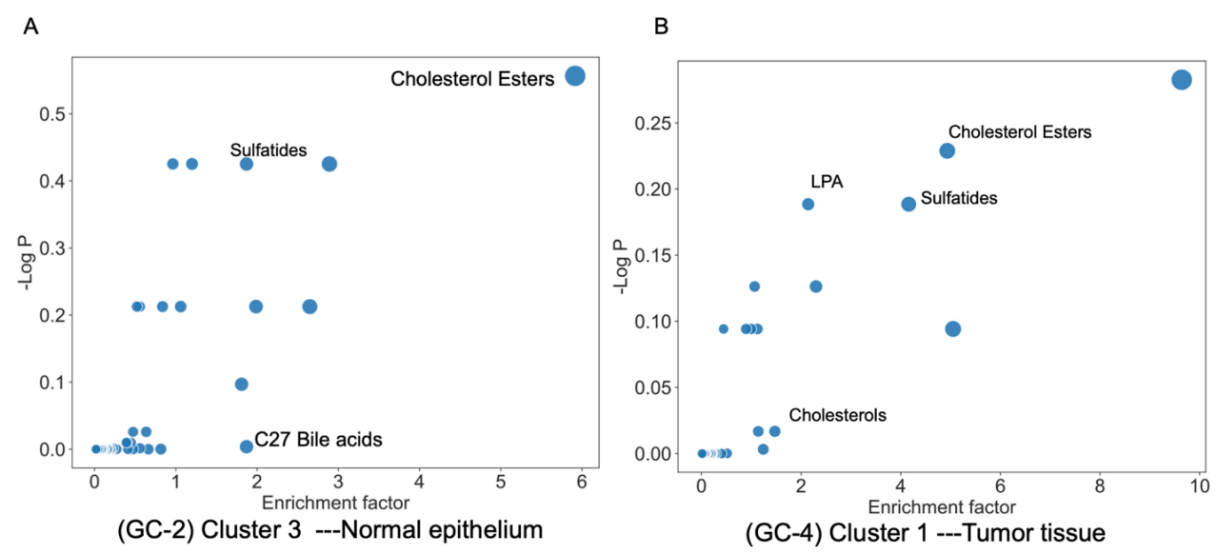
Figure 4. Functional analysis graph generated via inputting peak values into MetaboAnalyst
We generated the top 500 mass features from each cluster by the spatial shrunken centroids clustering method for each sample. Then we annotated these features to lipids using MetaboAnalyst software ranked by t scores with a negative ion mode and a mass tolerance of 5 ppm. Figure 4 and Table 2 show the major lipid categories that were matched via functional analysis for tumor tissue in sample GC-4 and muscle tissue in sample GC-2. Some of the major findings included cholesterol esters, LPA, and Sulfatides. Via investigating the correlation between the discovered lipids with gastric cancer, there have been many corroborating studies that have been found which bolster the importance of the role these molecules play in gastric cancer. For example, for cholesterol ester found in both GC-4 and GC-2, the neutral cholesterol ester hydrolase 1 has been identified by other studies to serve as a novel biomarker for early-stage gastric cancer identification [17]. Similarly, for sulfatides found in GC-2 and GC-4, there have been studies that demonstrate the ability of sulfatides to serve as major receptors for H. pylori, a pathogen that is strongly correlated with gastric cancer [18,19]. As well as LPA, which was also discovered in GC-4, induces the migration of SGC-7901 gastric cancer cells, and cholesterols, where an abundance of them will increase one’s risk of gastric cancer [20-23]. As for GC-2, bile acids were found to be positively related to cancer overall, too.
Table 2. Correlation of identified metabolic biomarkers with gastric cancer.
Sample | Tissue Type | Lipid category | Relationship with gastric cancer |
GC-4 Cluster 1 | Tumor tissue | LPA | Induces migration and attack of SGC-7901 gastric cancer cells |
GC-4 Cluster 1 | Tumor tissue | Cholesterols | High Cholesterol increases the risk for GC but also needs a moderate amount of cholesterol to suppress GC cell growth. HDL-C seems to pose good value for GC prognosis and development |
GC-4 Cluster 1 and GC-2 Cluster 3 | Tumor tissue and normal epithelium | Sulfatides | Serves as a major receptor for cell adhesion of H. pylori to GC cells. H. pylori is strongly linked to GC |
GC-4 Cluster 1 and GC-2 Cluster 3 | Tumor tissue and normal epithelium | Chol. esters | Serves as novel biomarker for early GC detection |
GC-2 Cluster 3 | Normal epithelium | C27 bile acids | C-27 bile acids are precursors to many other bile acids, which are positively related to cancer overall |
Additionally, when the detected biomarkers were plotted against the tumor histology tissue to display their spatial distribution, all of the biomarkers identified were observed to have a higher concentration in the areas labeled “tumor tissue” in the histology segmentation (Figure 5). This further corroborates the results that were obtained in functional analysis, confirming that the methodology will provide meaningful results that will enhance the efficacy of gastric cancer diagnosis.
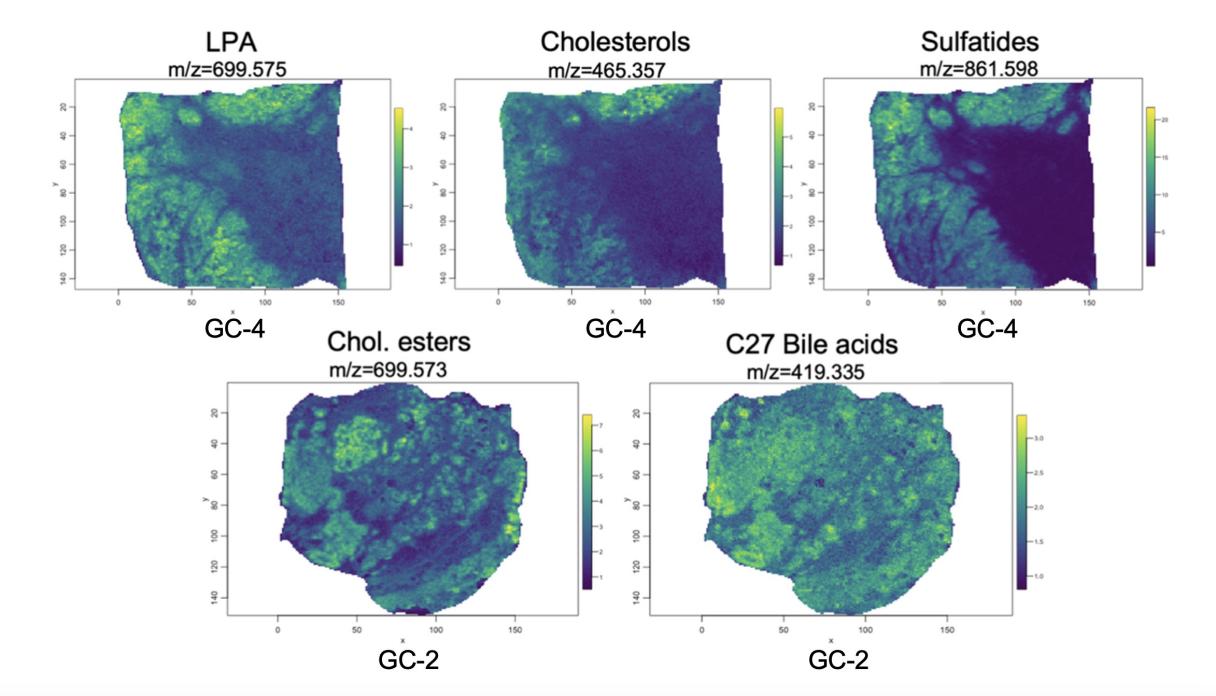
Figure 5. Spatial distribution of detected biomarkers of interest across tumor tissue
4. Conclusions
By performing a series of analyses on raw MSI data, we were able to successfully discover multiple relevant metabolic biomarkers that have a strong linkage to gastric cancer. The obtained results display the heterogeneous nature of gastric cancer tumors concerning differences in metabolic signatures. From the findings, using this pipeline of data analysis and segmentation of mass spectrometry imaging data seems to be a promising avenue for improved diagnostic accuracies and hopefully better patient outcomes for cancers in the future.
References
[1]. Wang, J. et al. Spatial Metabolomics Identifies Distinct Tumor-Specific Subtypes in Gastric Cancer Patients. Clin. Cancer Res. Off. J. Am. Assoc. Cancer Res. 28, 2865–2877 (2022).
[2]. Sitarz, R. et al. Gastric cancer: epidemiology, prevention, classification, and treatment. Cancer Manag. Res. 10, 239–248 (2018).
[3]. Topi, S. et al. Gastric Cancer in History: A Perspective Interdisciplinary Study. Cancers 12, 264 (2020).
[4]. Maconi, G., Manes, G. & Porro, G. B. Role of symptoms in diagnosis and outcome of gastric cancer. World J. Gastroenterol. WJG 14, 1149–1155 (2008).
[5]. Zali, H., Rezaei-Tavirani, M. & Azodi, M. Gastric cancer: prevention, risk factors and treatment. Gastroenterol. Hepatol. Bed Bench 4, 175–185 (2011).
[6]. Layke, J. C. & Lopez, P. P. Gastric cancer: diagnosis and treatment options. Am. Fam. Physician 69, 1133–1140 (2004).
[7]. Kadam, W., Wei, B. & Li, F. Metabolomics of Gastric Cancer. in Cancer Metabolomics: Methods and Applications (ed. Hu, S.) 291–301 (Springer International Publishing, Cham, 2021). doi:10.1007/978-3-030-51652-9_20.
[8]. Ursu, Ștefan et al. Role of Metabolomics in Pathogenesis and Prompt Diagnosis of Gastric Cancer Metastasis—A Systematic Review. Diagnostics 13, 3401 (2023).
[9]. Jayavelu, N. D. & Bar, N. S. Metabolomic studies of human gastric cancer: Review. World J. Gastroenterol. WJG 20, 8092–8101 (2014).
[10]. Antonio, M. J., Zhang, C. & Le, A. Different Tumor Microenvironments Lead to Different Metabolic Phenotypes. in The Heterogeneity of Cancer Metabolism (ed. Le, A.) 137–147 (Springer International Publishing, Cham, 2021). doi:10.1007/978-3-030-65768-0_10.
[11]. Gowda, G. A. N. & Raftery, D. NMR Based Metabolomics. Adv. Exp. Med. Biol. 1280, 19–37 (2021).
[12]. Sun, C. et al. Spatially resolved multi-omics highlights cell-specific metabolic remodeling and interactions in gastric cancer. Nat. Commun. 14, 2692 (2023).
[13]. Yuan, L.-W., Yamashita, H. & Seto, Y. Glucose metabolism in gastric cancer: The cutting-edge. World J. Gastroenterol. 22, 2046–2059 (2016).
[14]. In, H. et al. Serum Pepsinogen as a Biomarker for Gastric Cancer in the United States: A Nested Case-Control Study Using the PLCO Cancer Screening Trial Data. Cancer Epidemiol. Biomark. Prev. Publ. Am. Assoc. Cancer Res. Cosponsored Am. Soc. Prev. Oncol. 31, 1426–1432 (2022).
[15]. Rae Buchberger, A., DeLaney, K., Johnson, J. & Li, L. Mass Spectrometry Imaging: A Review of Emerging Advancements and Future Insights. Anal. Chem. 90, 240–265 (2018).
[16]. Li, S. et al. Predicting Network Activity from High Throughput Metabolomics. PLOS Comput. Biol. 9, e1003123 (2013).
[17]. NAD(P)‐dependent steroid dehydrogenase‐like protein and neutral cholesterol ester hydrolase 1 serve as novel markers for early detection of gastric cancer identified using quantitative proteomics - Xiao - 2021 - Journal of Clinical Laboratory Analysis - Wiley Online Library. https://onlinelibrary.wiley.com/doi/full/10.1002/jcla.23652.
[18]. Wroblewski, L. E., Peek, R. M. & Wilson, K. T. Helicobacter pylori and Gastric Cancer: Factors That Modulate Disease Risk. Clin. Microbiol. Rev. 23, 713–739 (2010).
[19]. Kamisago, S. et al. Role of sulfatides in adhesion of Helicobacter pylori to gastric cancer cells. Infect. Immun. 64, 624–628 (1996).
[20]. Ren, Z. et al. Lysophosphatidic acid induces the migration and invasion of SGC-7901 gastric cancer cells through the LPA2 and Notch signaling pathways. Int. J. Mol. Med. 44, 67–78 (2019).
[21]. Lim, S.-C., Parajuli, K. R., Duong, H.-Q., Choi, J. E. & Han, S. I. Cholesterol induces autophagic and apoptotic death in gastric carcinoma cells. Int. J. Oncol. 44, 805–811 (2014).
[22]. Mayengbam, S. S., Singh, A., Pillai, A. D. & Bhat, M. K. Influence of cholesterol on cancer progression and therapy. Transl. Oncol. 14, 101043 (2021).
[23]. Tamura, T., Inagawa, S., Hisakura, K., Enomoto, T. & Ohkohchi, N. Evaluation of serum high-density lipoprotein cholesterol levels as a prognostic factor in gastric cancer patients. J. Gastroenterol. Hepatol. 27, 1635–1640 (2012).
Cite this article
Wang,C. (2024). Mass spectrometry imaging metabolomics reveals the metabolic spatial heterogeneity in gastric cancer . Theoretical and Natural Science,49,39-45.
Data availability
The datasets used and/or analyzed during the current study will be available from the authors upon reasonable request.
Disclaimer/Publisher's Note
The statements, opinions and data contained in all publications are solely those of the individual author(s) and contributor(s) and not of EWA Publishing and/or the editor(s). EWA Publishing and/or the editor(s) disclaim responsibility for any injury to people or property resulting from any ideas, methods, instructions or products referred to in the content.
About volume
Volume title: Proceedings of the 4th International Conference on Biological Engineering and Medical Science
© 2024 by the author(s). Licensee EWA Publishing, Oxford, UK. This article is an open access article distributed under the terms and
conditions of the Creative Commons Attribution (CC BY) license. Authors who
publish this series agree to the following terms:
1. Authors retain copyright and grant the series right of first publication with the work simultaneously licensed under a Creative Commons
Attribution License that allows others to share the work with an acknowledgment of the work's authorship and initial publication in this
series.
2. Authors are able to enter into separate, additional contractual arrangements for the non-exclusive distribution of the series's published
version of the work (e.g., post it to an institutional repository or publish it in a book), with an acknowledgment of its initial
publication in this series.
3. Authors are permitted and encouraged to post their work online (e.g., in institutional repositories or on their website) prior to and
during the submission process, as it can lead to productive exchanges, as well as earlier and greater citation of published work (See
Open access policy for details).
References
[1]. Wang, J. et al. Spatial Metabolomics Identifies Distinct Tumor-Specific Subtypes in Gastric Cancer Patients. Clin. Cancer Res. Off. J. Am. Assoc. Cancer Res. 28, 2865–2877 (2022).
[2]. Sitarz, R. et al. Gastric cancer: epidemiology, prevention, classification, and treatment. Cancer Manag. Res. 10, 239–248 (2018).
[3]. Topi, S. et al. Gastric Cancer in History: A Perspective Interdisciplinary Study. Cancers 12, 264 (2020).
[4]. Maconi, G., Manes, G. & Porro, G. B. Role of symptoms in diagnosis and outcome of gastric cancer. World J. Gastroenterol. WJG 14, 1149–1155 (2008).
[5]. Zali, H., Rezaei-Tavirani, M. & Azodi, M. Gastric cancer: prevention, risk factors and treatment. Gastroenterol. Hepatol. Bed Bench 4, 175–185 (2011).
[6]. Layke, J. C. & Lopez, P. P. Gastric cancer: diagnosis and treatment options. Am. Fam. Physician 69, 1133–1140 (2004).
[7]. Kadam, W., Wei, B. & Li, F. Metabolomics of Gastric Cancer. in Cancer Metabolomics: Methods and Applications (ed. Hu, S.) 291–301 (Springer International Publishing, Cham, 2021). doi:10.1007/978-3-030-51652-9_20.
[8]. Ursu, Ștefan et al. Role of Metabolomics in Pathogenesis and Prompt Diagnosis of Gastric Cancer Metastasis—A Systematic Review. Diagnostics 13, 3401 (2023).
[9]. Jayavelu, N. D. & Bar, N. S. Metabolomic studies of human gastric cancer: Review. World J. Gastroenterol. WJG 20, 8092–8101 (2014).
[10]. Antonio, M. J., Zhang, C. & Le, A. Different Tumor Microenvironments Lead to Different Metabolic Phenotypes. in The Heterogeneity of Cancer Metabolism (ed. Le, A.) 137–147 (Springer International Publishing, Cham, 2021). doi:10.1007/978-3-030-65768-0_10.
[11]. Gowda, G. A. N. & Raftery, D. NMR Based Metabolomics. Adv. Exp. Med. Biol. 1280, 19–37 (2021).
[12]. Sun, C. et al. Spatially resolved multi-omics highlights cell-specific metabolic remodeling and interactions in gastric cancer. Nat. Commun. 14, 2692 (2023).
[13]. Yuan, L.-W., Yamashita, H. & Seto, Y. Glucose metabolism in gastric cancer: The cutting-edge. World J. Gastroenterol. 22, 2046–2059 (2016).
[14]. In, H. et al. Serum Pepsinogen as a Biomarker for Gastric Cancer in the United States: A Nested Case-Control Study Using the PLCO Cancer Screening Trial Data. Cancer Epidemiol. Biomark. Prev. Publ. Am. Assoc. Cancer Res. Cosponsored Am. Soc. Prev. Oncol. 31, 1426–1432 (2022).
[15]. Rae Buchberger, A., DeLaney, K., Johnson, J. & Li, L. Mass Spectrometry Imaging: A Review of Emerging Advancements and Future Insights. Anal. Chem. 90, 240–265 (2018).
[16]. Li, S. et al. Predicting Network Activity from High Throughput Metabolomics. PLOS Comput. Biol. 9, e1003123 (2013).
[17]. NAD(P)‐dependent steroid dehydrogenase‐like protein and neutral cholesterol ester hydrolase 1 serve as novel markers for early detection of gastric cancer identified using quantitative proteomics - Xiao - 2021 - Journal of Clinical Laboratory Analysis - Wiley Online Library. https://onlinelibrary.wiley.com/doi/full/10.1002/jcla.23652.
[18]. Wroblewski, L. E., Peek, R. M. & Wilson, K. T. Helicobacter pylori and Gastric Cancer: Factors That Modulate Disease Risk. Clin. Microbiol. Rev. 23, 713–739 (2010).
[19]. Kamisago, S. et al. Role of sulfatides in adhesion of Helicobacter pylori to gastric cancer cells. Infect. Immun. 64, 624–628 (1996).
[20]. Ren, Z. et al. Lysophosphatidic acid induces the migration and invasion of SGC-7901 gastric cancer cells through the LPA2 and Notch signaling pathways. Int. J. Mol. Med. 44, 67–78 (2019).
[21]. Lim, S.-C., Parajuli, K. R., Duong, H.-Q., Choi, J. E. & Han, S. I. Cholesterol induces autophagic and apoptotic death in gastric carcinoma cells. Int. J. Oncol. 44, 805–811 (2014).
[22]. Mayengbam, S. S., Singh, A., Pillai, A. D. & Bhat, M. K. Influence of cholesterol on cancer progression and therapy. Transl. Oncol. 14, 101043 (2021).
[23]. Tamura, T., Inagawa, S., Hisakura, K., Enomoto, T. & Ohkohchi, N. Evaluation of serum high-density lipoprotein cholesterol levels as a prognostic factor in gastric cancer patients. J. Gastroenterol. Hepatol. 27, 1635–1640 (2012).