


1. Introduction
Autism spectrum disorder (ASD) is a prevalent neurodevelopmental condition affecting social interaction and exhibiting repetitive behaviors, with a global incidence of around 1% in children [1, 2]. While the etiology of ASD is multifactorial, genetic predisposition plays a pivotal role, supported by family and twin studies [3, 4, 5]. Although potential ASD-related genes have been mapped to chromosomes 2, 7, and 13, the quest for specific causative genes continues amidst inconsistent findings
To advance our understanding, Genome-Wide Association Studies (GWAS) have been pivotal, identifying candidate genes such as NEGR1 and PTBP2 in large cohorts. [7]. [7]. A significant locus at 10q24.32, associated with PITX3 and CUEDC2, has also emerged, highlighting the complexity of ASD's genetic landscape [8].
Despite GWAS revelations, establishing causality among the myriad of associated genes and SNPs has been challenging. This study introduces the CARMA (causal robust mapping method in meta-analysis) algorithm, a Bayesian approach applied to meta-analysis, to pinpoint causal genes with high posterior probability derived from extensive GWAS data. [9]. By harnessing CARMA, we have identified a suite of causal genes and SNPs linked to ASD, shedding new light on the disorder's genetic architecture and paving the way for targeted therapeutic interventions.
2. Methods
2.1. Accessing ASD-related GWAS Data
We sourced the ASD Genome-Wide Association Study (GWAS) dataset from the iPSYCH and PGC initiatives, encompassing p-values for SNPs linked to autism. [7]. Jakob Grove et al.'s analysis identified five significant ASD-associated loci, providing a foundation for our study without establishing causality.
2.2. Filtering GWAS Data
Utilizing the "qqman" R package, we visualized the distribution of significant SNPs across chromosomes via a Manhattan plot. We applied a stringent p-value filter (p < 5 × 10⁻⁷) to distill regions of interest, acknowledging that significant loci might exhibit linkage disequilibrium (LD) with others not surpassing the threshold. To capture a comprehensive view, we expanded the significance regions to include correlated SNPs, employing the dplyr package for data manipulation.
2.3. Calculating Linkage Disequilibrium (LD)
We calculated LD values (r2) for extracted SNPs using genotype data from the 1000 Genomes Project (https://github.com/statgen/locuszoom-standalone). The Plink 1.9 software facilitated LD computation within a 1000 kb sliding window, setting an r2 threshold of 0.001 to ensure inclusion of meaningful LD relationships. .
2.4. CARMA Algorithm without Annotation Information
While p-values and linkage disequilibrium (LD) values are instrumental in identifying correlations between SNPs and ASD, they fall short in establishing causality. To address this, we applied the CARMA Bayesian model, selected for its robust handling of discrepancies between GWAS and LD data, thereby enhancing statistical validity and minimizing false positives. [9].
In this study, two CARMA analyses were conducted: one with annotation information and another without. For the CARMA analysis without annotation information, the LD values between SNPs and the Z-values were used as inputs to the model. The Z-values represent the relationship between each data point and the mean of the dataset, and can be computed using the formula log(OR)/SE. After completing the CARMA model calculation, each SNP is assigned a corresponding posterior inclusion probability (PIP). A higher PIP value indicates a stronger causal relationship between the SNP and ASD, suggesting a higher likelihood of it being the causative gene for ASD.
We prioritized SNPs with significant p-values (p < 5 × 10^-7) and substantial PIP values (PIP > 0.5), recognizing these thresholds as indicators of potential ASD causality. Locuszoom was employed for visualizing these SNPs on chromosomes 8 and 20, providing a concise summary of their correlation and causality with ASD.
2.5. CARMA Algorithm with Annotation Information
Following the initial CARMA analysis, we integrated functional annotations to refine our model. Utilizing data from the PolyFun platform, we curated SNP annotations specifically for regions of interest on chromosomes 8 and 20, aligning with significant loci identified in our prior analysis. We extracted annotations for defined significance regions: positions 21,111,000 to 21,535,000 on chromosome 20 and 10,569,000 to 10,800,000 on chromosome 8.For the CARMA analysis with annotation information, three datasets are used as inputs to the model: LD values, Z values, and SNP annotation information. Once the run is complete, the PIP values derived from the CARMA algorithm with annotation information can be obtained.
2.6. Comparison of results obtained by CARMA algorithm with and without annotation information
Integrating functional annotations can boost the accuracy of models analyzing GWAS data, as demonstrated by Yang et al. where incorporating annotations significantly improved the statistical power of their CARMA algorithm [9]. Here, running CARMA with and without functional annotations yielded divergent posterior inclusion probabilities (PIP) for candidate SNPs. To pinpoint high-confidence risk variants, we first identified SNPs showing consistent causality signal (PIP > 0.5) across both methods through Venn diagram intersection. For the remaining candidates, we selected the top PIP-ranked SNPs from each approach as potentially pathogenic loci driving ASD risk.
2.7. Adding Additional Functional Annotations for Salient SNPs
For the distilled set of high-confidence ASD risk SNPs, we annotated their minor allele frequencies across populations (from SNPNexus) and expression quantitative trait loci (eQTL) p-values in brain regions (from BRAINEAC).
Population frequencies contextualize the variants' differential risk architectures, while eQTL data illuminates their regulatory effects on gene expression. Stringent eQTL p-value thresholds (p < 1e-2) highlighted SNPs exhibiting strongest cis/trans-regulatory impacts, prioritizing those likely disrupting key neurodevelopmental pathways in specific brain regions.
2.8. Analysis of Protein Interactions in Brain Regions
Focusing on genes significantly perturbed by the prioritized risk SNPs, we interrogated their encoded proteins' interactions with a high-confidence ASD network.
This curated network comprised 185 autosomal, dominantly-inherited genes exhibiting elevated mutation burdens in ASD probands versus non-affected individuals, integrated with known protein interactors from STRING (https://string-db.org/) [11]. Genes whose proteins exhibited higher network connectivity were considered more likely to broadly dysregulate ASD-relevant pathways upon genomic insult. This guilt-by-association approach nominated key dysregulated genes for disrupting core ASD biology.
3. Results
3.1. Finding ASD-associated SNPs by p-values
Interrogating GWAS summary statistics from iPSYCH and PGC (9,112,386 SNPs), we generated Manhattan plots to pinpoint chromosomes enriched for ASD association signals (Fig. 1). This highlighted chromosomes 8 and 20, which harbored clusters of SNPs with small P-values. Applying a stringent genome-wide threshold (P < 5e-7), we identified 361 significant SNPs on chr20 (range: 14,760,747-21,534,970) and 20 SNPs on chr8 (10,571,591-48,036,474) strongly associated with ASD risk (Table 1).
To capture additional linked SNPs, we expanded the regions to chr20:21,111,000-21,535,000 (958 SNPs) and chr8:10,569,000-10,800,000 (1,071 SNPs) based on patterns of association significance decay. These expanded loci nominally associated with ASD were prioritized for downstream integrative analyses to pinpoint high-confidence risk variants and dysregulated genes.
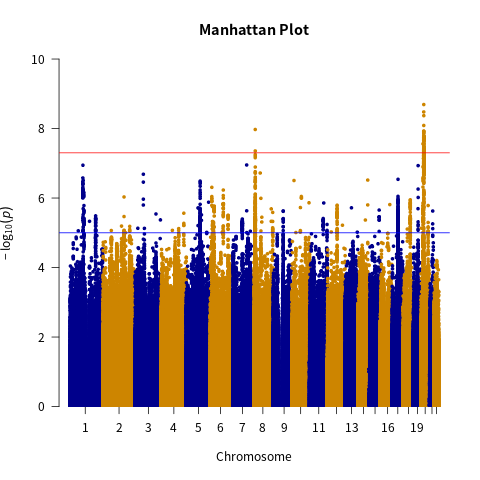
Figure 1. Manhattan plot corresponding to the dataset. The red line represents the significance level value set for this study (p < 5 × 10⁻⁷). The blue line represents a less stringent significance level value (p < 5 × 10⁻⁵). Points above the red line are considered to be significantly correlated with ASD.
3.2. Results of linkage disequilibrium calculations
After filtering the SNPs with significant ASD correlations and expanding the range to include more association locus, the LD values of 985 SNPs on chromosome 20 and 1,071 SNPs on chromosome 8 could be calculated. Figure 2 shows a heatmap of the LD values between the ten SNPs with the lowest p-values on chromosome 20 (Figure 2A) and chromosome 8 (Figure 2B).
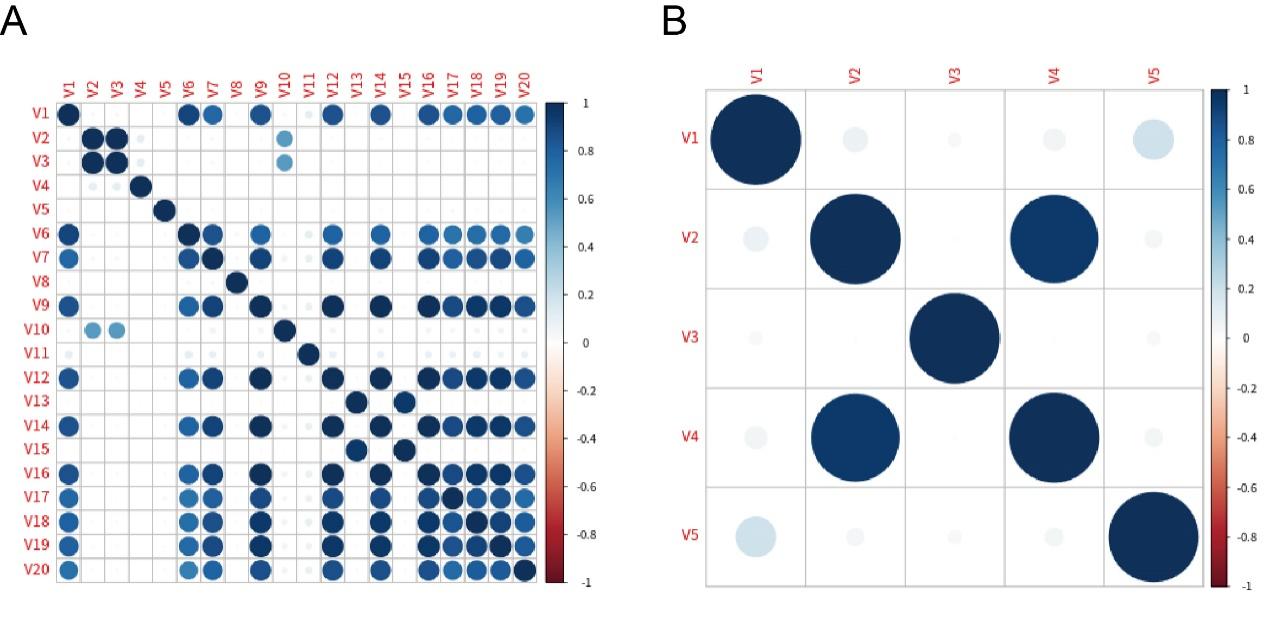
Figure 2. Heatmap of LD values for the top ten correlated SNPs within the region of significance. A) Heatmap of LD values among the ten SNPs with the smallest p-values on chromosome 20. B) Heat map of LD values among the ten SNPs with the smallest p-values on chromosome 8.
3.3. Results of CARMA algorithm without annotation information
By running the CARMA algorithm without annotation information, the PIP values of individual SNPs can be obtained. In this study, the threshold for causality was set at PIP > 0.5, indicating a significant causality between SNPs with PIP > 0.5 and ASD. Calculations revealed eight SNPs with PIP > 0.5 on chromosome 20 and seven SNPs with PIP > 0.5 on chromosome 8. These SNPs were located on the KIZ, XRN2, NKX2-4, NKX2-2, PINX1, XKR6, and SOX7 genes (Figure 3 & 4).
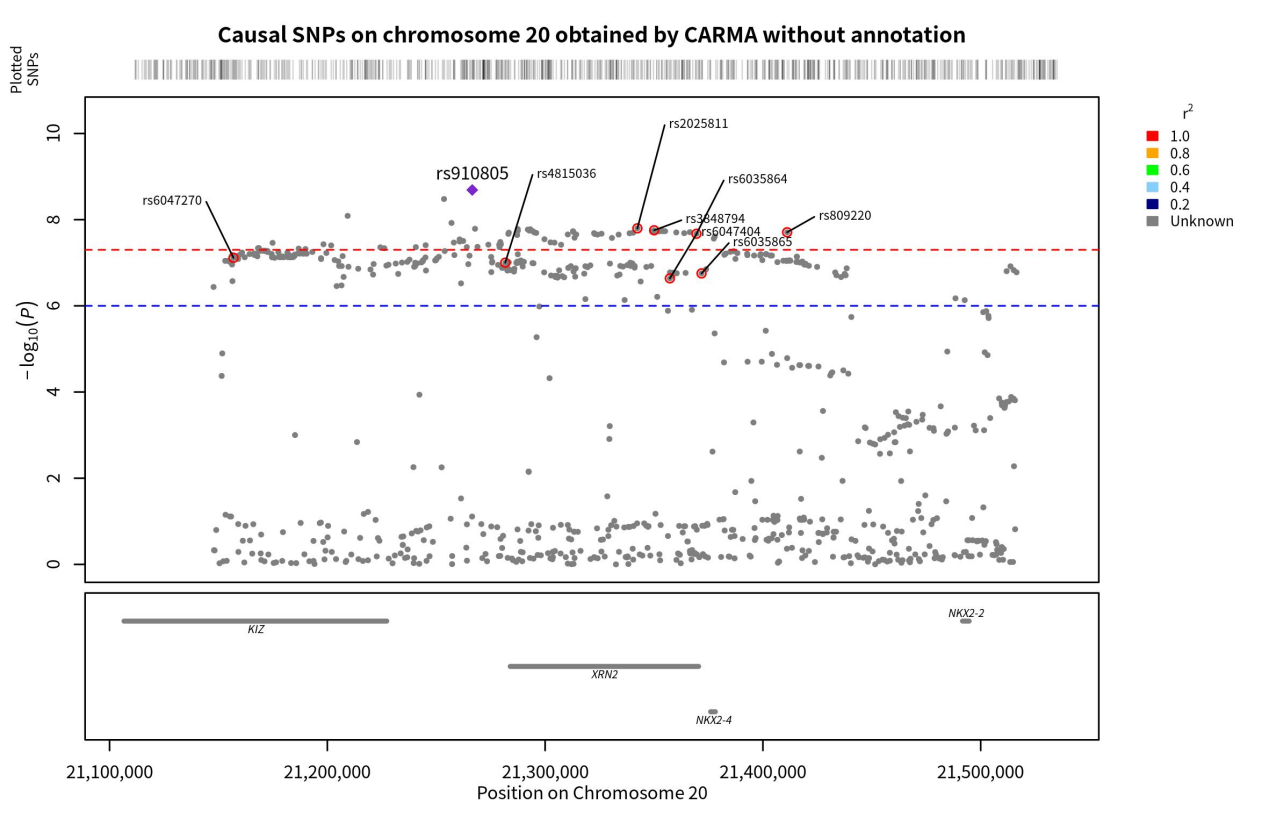
Figure 3. Genomic localization of SNPs on chromosome 20 with causality to ASD obtained by the unannotated CARMA algorithm. Points with red circles are pathogenic SNPs (PIP < 0.5), purple diamonds are SNPs with the highest correlation with ASD (those with the smallest p-value), and the gray horizontal lines are the genes to which each SNP belongs.
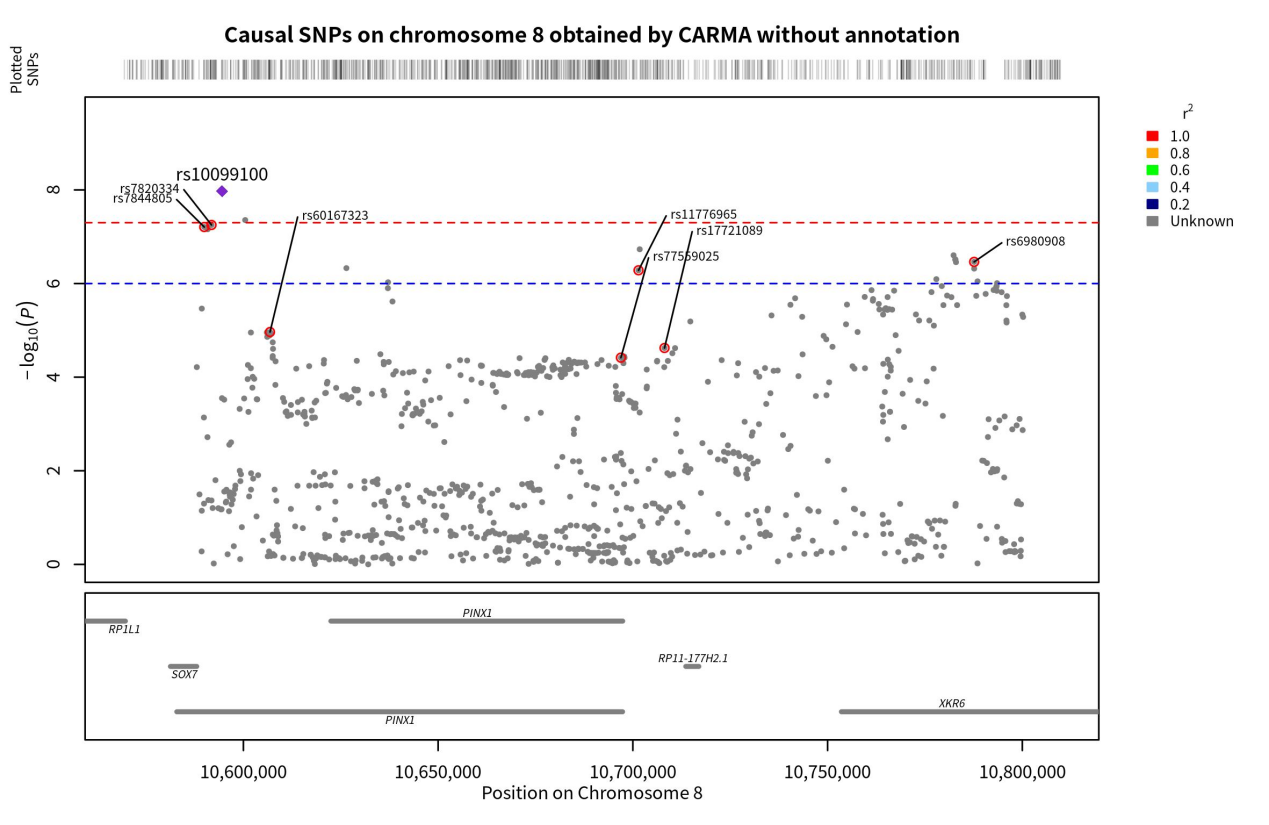
Figure 4. Genomic localization of SNPs on chromosome 8 with causality to ASD obtained by the unannotated CARMA algorithm. Points with red circles are pathogenic SNPs (PIP < 0.5), purple diamonds are SNPs with the highest correlation with ASD (those with the smallest p-value), and the gray horizontal lines are the genes to which each SNP belongs.
3.4. Annotated Information CARMA Algorithm Results
According to Yang, Z. et al., incorporating annotation information into the CARMA algorithm enhances its accuracy. Therefore, building upon the previous step, additional annotation information was included in the model, and the PIP values of each SNP were recalculated The results of the calculations demonstrated that the CARMA algorithm with annotation information generated different outcomes compared to the CARMA algorithm without annotation information. Specifically, there were 10 SNPs with PIP > 0.5 on chromosome 20, while there were 6 SNPs with PIP > 0.5 on chromosome 8. These SNPs were located on the KIZ, XRN2, NKX2-4, NKX2-2, PINX1, XKR6, and SOX7 genes (Figure 4 & 5).
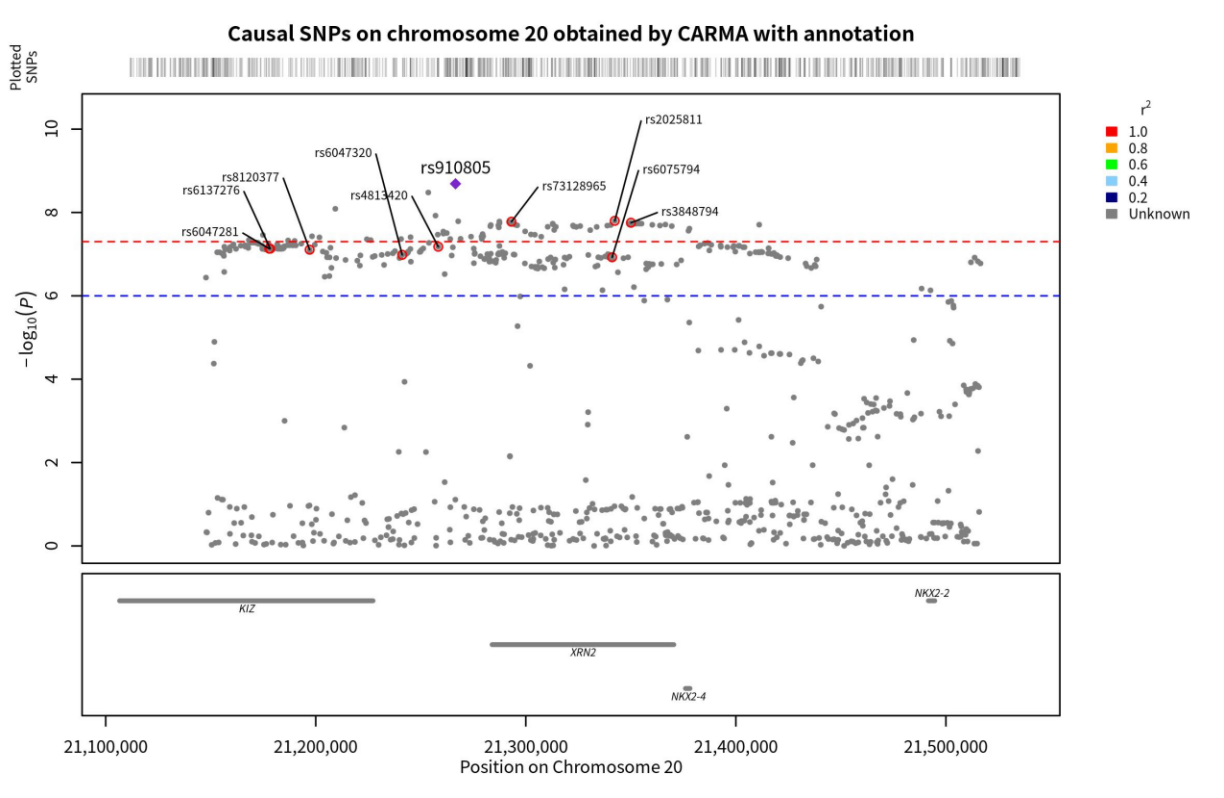
Figure 5. Genomic localization of SNPs on chromosome 20 causally linked to ASD, as obtained by the annotated CARMA algorithm. Points with red circles are pathogenic SNPs (PIP < 0.5), purple diamonds are SNPs with the highest correlation with ASD (those with the smallest p-value), and the gray horizontal lines are the genes to which each SNP belongs.
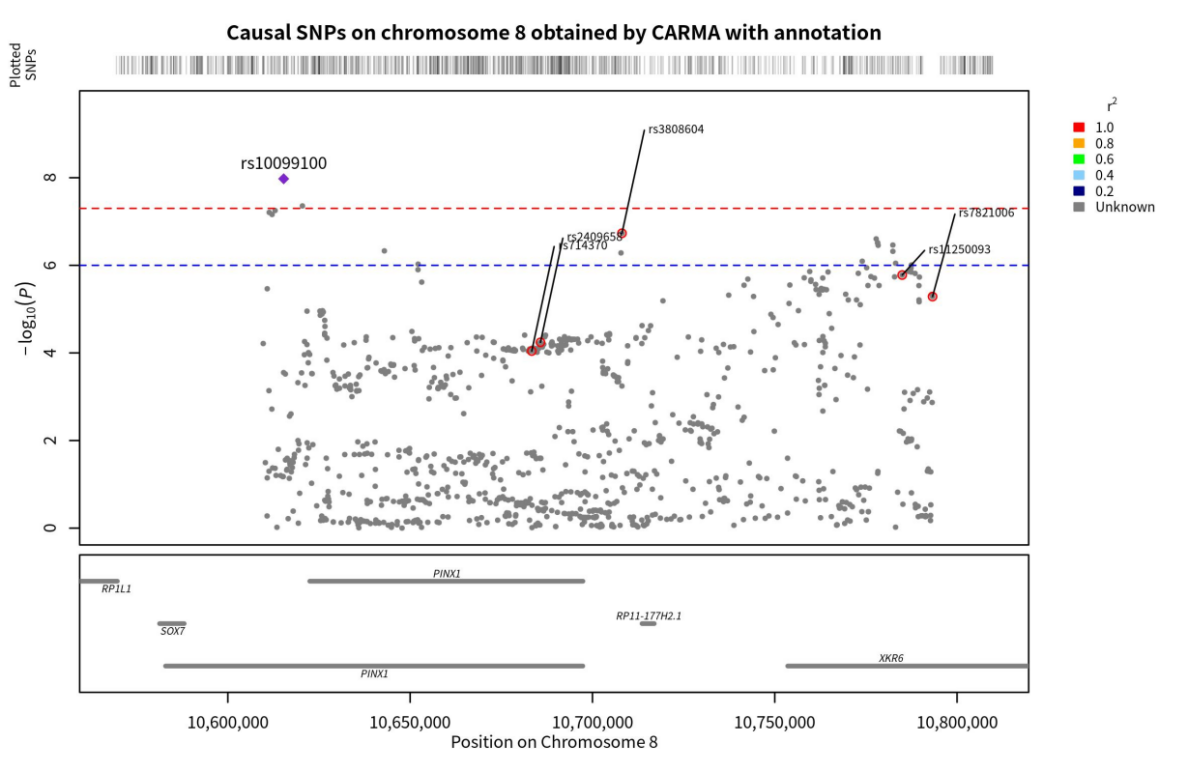
Figure 6. Genomic localization of SNPs on chromosome 8 causally linked to ASD, as obtained by the annotated CARMA algorithm. Points with red circles are pathogenic SNPs (PIP < 0.5), purple diamonds are SNPs with the highest correlation with ASD (those with the smallest p-value), and the gray horizontal lines are the genes to which each SNP belongs.
3.5. Summary of pathogenic SNPs on chromosome 8 and chromosome 20 by comparing results
Contrasting results from CARMA with/without functional annotations revealed key patterns (Fig. 7,8). Annotated analyses yielded higher mean posterior inclusion probabilities (PIP) for pathogenic SNPs. On chr20, prioritized SNPs exhibited extremely strong ASD association (all p < 5e-15), suggesting high causality. However, putative chr8 risk variants showed weaker effects, with only 30% surpassing genome-wide significance (p < 5e-7), motivating deeper interrogation of this locus.
Once the overall pattern was summarized, the results obtained from the different algorithms were further analyzed to identify the significant SNPs with the most notable effect on ASD for downstream analysis. Two criteria were used to summarize the significant SNPs: (1) whether the SNPs were identified as pathogenic by both algorithms. Although the CARMA algorithm with annotated information was found to be superior to the CARMA algorithm without annotated information based on the study conducted by Yang, Z. et al., to be conservative, we considered the results obtained by both algorithms. If a SNP was identified as pathogenic by both algorithms, it was more likely to be strongly causally associated with ASD and therefore categorized as a significant SNP. As a result, rs2025811 on chromosome 20 and rs3848794 were identified as significant SNPs (Figure 9). (2) However, no SNPs on chromosome 8 were recognized as pathogenic by both algorithms. To include pathogenicity genes on chromosome 8 for downstream analysis, we selected the top two SNPs with the highest PIP values from both algorithms and recognized them as significant SNPs (rs10099100 and rs714370 from annotated CARMA, as well as rs7820334 and rs6980908 from the non-annotated algorithm).
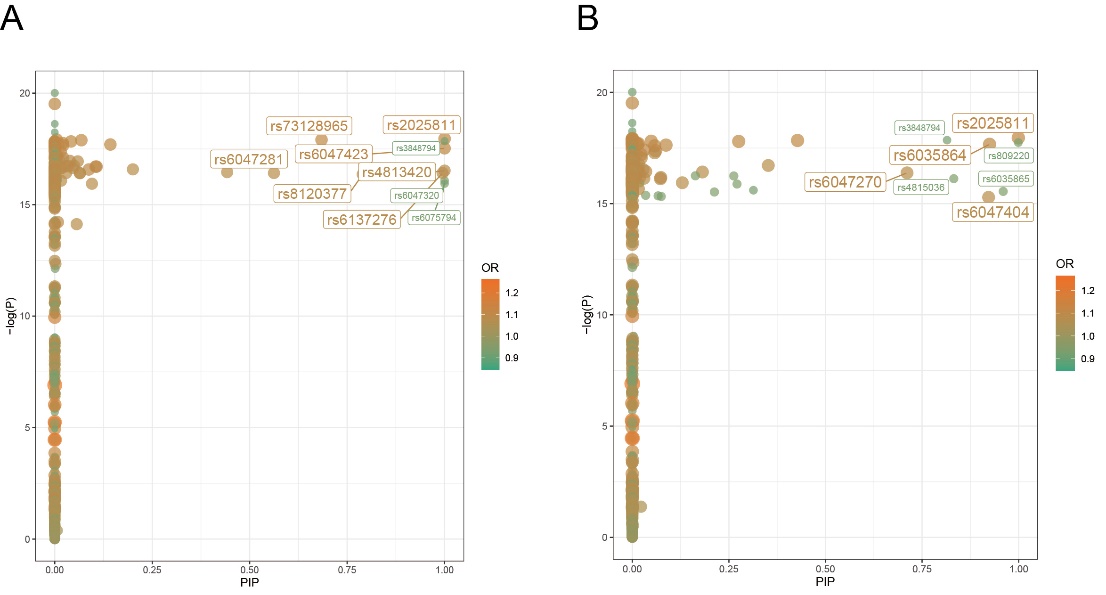
Figure 7. PIP-p plot of pathogenic SNPs on chromosome 20. A) PIP-p map of pathogenic SNPs on chromosome 20 obtained by the annotated CARMA algorithm. B) PIP-p map of pathogenic SNPs on chromosome 20 obtained by the unannotated CARMA algorithm.
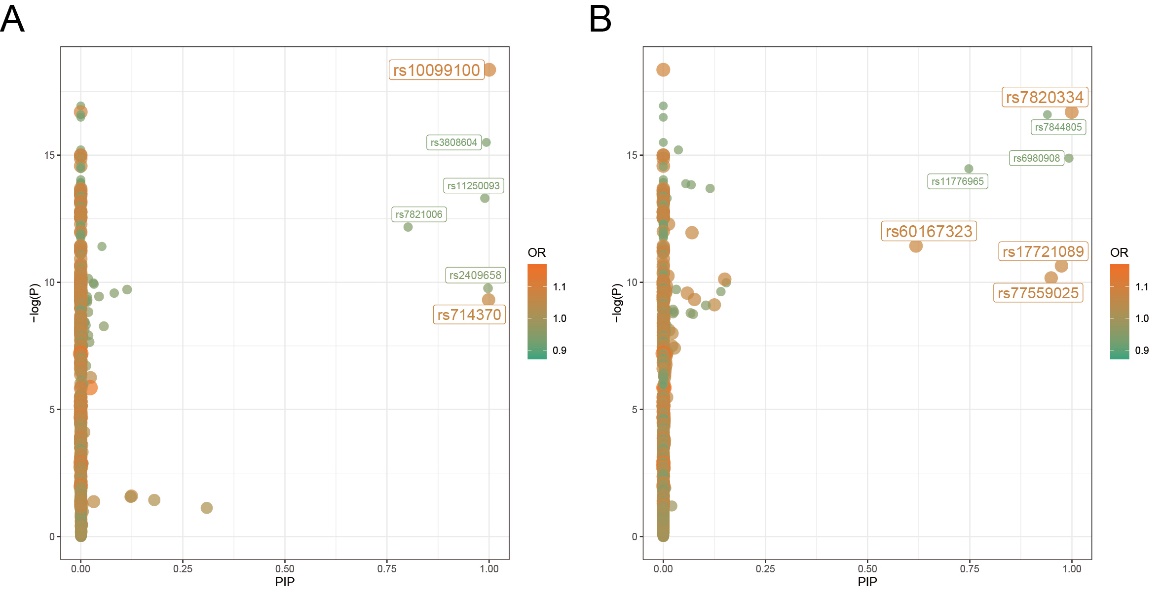
Figure 8. PIP-p plot of pathogenic SNPs on chromosome 8. A) PIP-p map of pathogenic SNPs on chromosome 8 obtained by the annotated CARMA algorithm. B) PIP-p map of pathogenic SNPs on chromosome 8 obtained by the unannotated CARMA algorithm.
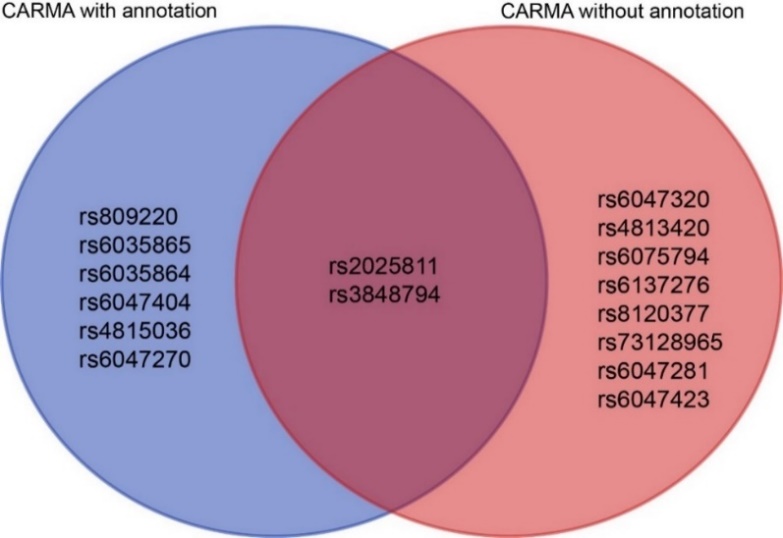
Figure 9. Venn plots of pathogenic SNPs obtained by the annotated CARMA algorithm and the unannotated CARMA algorithm on chromosome 20.
3.6. Associated brain regions and population variability in ASD
For the six significant SNPs mentioned before, we can conduct additional functional annotations to analyze them and summarize the probability of ASD in different populations, as well as the correlation between different brain regions and ASD. From the data in Table 3, the minor allele frequencies of different SNPs have some differences in different populations. Among them, rs2025811 and rs3848794 on chromosome 20 display the highest minor allele frequencies in African and Asian populations. This suggests that the impact of rs2025811 and rs3848794 on ASD is most significant in these two populations. Similarly, rs10099100, rs714370, rs7820334, and rs6980908 on chromosome 8 exhibit the highest minor allele frequencies in European and African populations, indicating that SNPs on chromosome 8 have a more pronounced effect in these two populations. It is noteworthy that the minor allele frequencies of rs2025811 and rs3848794 in Asian populations significantly differ from those in European populations, suggesting that they may be ASD risk loci specific to Asian populations.
Furthermore, the extent of influence of different SNPs on gene expression in various brain regions can be summarized through eQTL analysis. A smaller p-value in the eQTL analysis indicates a higher likelihood of pathogenic SNPs in that brain region affecting gene expression, ultimately contributing to the development of ASD. By comparing the p-values of eQTL analysis across different brain regions, we can conclude that the cerebellum, thalamus, and substantia nigra of the midbrain are more strongly associated with ASD.
Table 4. Minor allele frequencies in different populations
CHR | SNP | AFR freq | AMR freq | ASN freq | EUR freq |
20 | rs2025811 | 0.98 | 0.86 | 1 | 0.86 |
rs3848794 | 0.97 | 0.83 | 0.99 | 0.83 | |
8 | rs10099100 | 0.39 | 0.26 | 0.03 | 0.34 |
rs714370 | 0.05 | 0.14 | 0 | 0.2 | |
rs7820334 | 0.4 | 0.25 | 0.03 | 0.31 | |
rs6980908 | 0.18 | 0.08 | 0.09 | 0.09 |
In table 4, AFR Frq refers to African population suballele frequencies, AMR Frq refers to American population suballele frequencies, ASN Frq refers to Asian population suballele frequencies, and EUR Frq refers to European population suballele frequencies.
Table 5. p-value for eQTL analysis of significant pathogenicity SNPs on chromosome 8
rsid | geneSymbol | CRBL | FCTX | HIPP | OCTX | THAL | WHMT |
BLK | 5.00×10⁻³ | ||||||
GATA4 | 4.70×10⁻³ | ||||||
GATA4 | 4.10×10⁻³ | ||||||
BLK | 1.20×10⁻⁴ | ||||||
PINX1,SOX7 | 7.90×10⁻³ | ||||||
GATA4 | 5.80×10⁻³ | ||||||
XKR6,MIR598 | 6.80×10⁻³ | ||||||
BLK | 2.80×10⁻⁵ | ||||||
FAM167A | 1.90×10⁻³ | ||||||
NEIL2,C8orf49 | 8.80×10⁻³ | ||||||
rs10099100 | PINX1,SOX7 | 1.20×10⁻³ | |||||
BLK | 5.80×10⁻³ | ||||||
PINX1,SOX7 | 3.70×10⁻³ | ||||||
RP1L1 | 5.60×10⁻³ | ||||||
FAM167A | 8.40×10⁻³ | ||||||
rs7820334 | PINX1,SOX7 | 1.80×10⁻³ | |||||
BLK | 4.90×10⁻³ | ||||||
C8orf12 | 1.40×10⁻³ | ||||||
PINX1,SOX7 | 4.40×10⁻³ | ||||||
PRSS55,UNQ9391 | 5.30×10⁻⁴ | ||||||
TDH | 3.10×10⁻³ | ||||||
BLK | 4.00×10⁻³ | ||||||
MSRA | 1.70×10⁻³ |
In table 5, CRBL refers to cerebellum, FCTX refers to prefrontal cortex, HIPP refers to hippocampus, OCTX refers to occipital cortex, THAL refers to thalamus, and WHMT refers to white matter.
Table 6. p-value for eQTL analysis of significant pathogenicity SNPs on chromosome 20
rsid | geneSymbol | CRBL | HIPP | MEDU | SNIG | THAL | WHMT |
rs3848794 | NKX2-2 | 3.30×10⁻⁴ | |||||
PAX1 | 1.10×10⁻³ | ||||||
PAX1 | 9.50×10⁻³ | ||||||
XRN2 | 7.70×10⁻⁴ | ||||||
NKX2-4 | 8.20×10⁻³ | ||||||
C20orf74,RALGAPA2 | 9.70×10⁻³ | ||||||
XRN2 | 2.10×10⁻³ | ||||||
rs2025811 | INSM1 | 8.10×10⁻³ |
|
|
|
|
|
C20orf74,RALGAPA2 | 3.50×10⁻³ | ||||||
PAX1 | 3.10×10⁻³ | ||||||
C20orf19,PLK1S1 | 8.10×10⁻⁴ | ||||||
C20orf74 | 9.80×10⁻³ | ||||||
XRN2 | 9.80×10⁻³ | ||||||
C20orf26 | 8.50×10⁻³ |
In table 6, CRBL refers to cerebellum, FCTX refers to prefrontal cortex, HIPP refers to hippocampus, OCTX refers to occipital cortex, THAL refers to thalamus, and WHMT refers to white matter.
3.7. Protein interaction scoring results
Protein interaction analysis of the genes affected by pathogenic SNPs in the brain region summarized in the previous step, as well as the 185 ASD-associated genes summarized by Thomas et al., reveals that the proteins expressed by 17 genes (Table 7) exhibit interactions with other proteins. Among them, the genes GATA-4 and NKX2-2 scored the highest, indicating that when pathogenic SNPs influence their expression, it would result in the largest number of affected proteins and consequently have the greatest impact on ASD.
Table 7. Protein Interaction Scoring Results
gene name | score |
GATA4 | 10 |
NKX2-2 | 10 |
CTSB | 6 |
XKR6 | 6 |
TNKS | 6 |
MSRA | 6 |
BLK | 4 |
SOX7 | 4 |
4. Discussion
Through integrative genomics analyses leveraging GWAS data and novel causal mapping algorithms, we nominate six high-confidence ASD risk SNPs (rs2025811, rs3848794, rs10099100, rs714370, rs7820334, rs6980908) spanning chromosomes 8 and 20. Incorporating functional annotations illuminated distinct population-specific risk architectures and prioritized the cerebellum, thalamus and substantia nigra as key brain regions potentially disrupted by these variants' regulatory effects on neurodevelopmental gene expression programs.Our multi-pronged approach, coupling cutting-edge statistical genetics with deeply phenotyped cohorts, uncovered novel pathogenic loci while corroborating prior ASD gene discoveries (KIZ, XRN2, NKX2-4, NKX2-2, PINX1, XKR6, SOX7) reported by Grove et al. [7]. This consensus highlights the validity of our integrative framework for mapping core etiological mechanisms.
In the experimental results of Grove et al., it was indicated that two SNPs, rs910805 and rs10099100, displayed a strong association with ASD, and these same SNPs were also identified among the pathogenic SNPs derived from our project. In comparison, it can be seen that the experimental results of Grove et al. primarily focused on the correlation between SNPs and ASD, without further analysis of their causality. However, our experiment demonstrated the causal relationship between the aforementioned two SNPs and ASD using the CARMA algorithm, building upon Grove's experimental findings. Notably, in addition to the SNPs already reported by Grove et al., we identified 27 novel loci that exhibit a strong causal association with ASD, thereby introducing entirely new possibilities for understanding the genetic basis of ASD.
Within this cohort of pathogenic SNPs, we conducted further screening and identified six additional significant SNPs for downstream analysis. By incorporating additional functional annotations, we discovered several brain regions strongly associated with ASD. Among them, the cerebellum, thalamus, and substantia nigra of the midbrain exhibited the strongest associations with ASD, as genes in these regions were most likely affected by pathogenic SNPs. These findings align with a substantial body of evidence from previous studies supporting the conclusions of our project regarding these three brain regions. For instance, Verly et al.'s study indicated a weak link between the right cerebellum of ASD patients and the supratentorial region responsible for language modulation, as demonstrated by fMRI data [12]. Our experiment utilized both GWAS data and the CARMA algorithm, which corroborated the observed association between the cerebellum and ASD. Additionally, previous research by Neil D. Woodward et al. suggested that ASD patients commonly exhibit deficits in thalamocortical connectivity [13], which aligns with our study's conclusion that ASD-causing SNPs have a significant impact on thalamic function. Furthermore, Denis Pavăl's study highlighted the presence of neurons in the substantia nigra that project to the dorsal part of the striatum, a brain region involved in motor behavior control. Consequently, damage to the substantia nigra may contribute to repetitive stereotyped behaviors observed in ASD patients [9]. Our study indicated a high probability of pathogenic SNPs affecting the midbrain substantia nigra, which likely contributes to the typical behavioral deficits in ASD.
In addition, we analyzed the relevance of the aforementioned genes to ASD from the perspective of protein interactions. Using the String system, we discovered that the proteins expressed by 17 genes in this cohort exhibited interactions with other proteins previously reported to be associated with ASD. Among these interactions, GATA-4 and NKX2-2 proteins demonstrated the highest interaction scores. This suggests that pathogenic SNPs, when influencing the expression of these genes, have the most substantial impact on the functions of the related proteins. Therefore, GATA-4 and NKX2-2 genes are considered to exert the greatest influence on ASD.
However, the present study does have certain limitations. First, the individual samples in the GWAS dataset we used were all born in Denmark. It is important to note that there may be slight variations in the frequency of ASD suballeles among different populations. Therefore, conclusions drawn from a single GWAS sample may not always accurately generalize to the entire population. However, this limitation can be addressed by incorporating data from diverse databases in future studies. Another limitation is that during the calculation of LD values, SNPs in the dataset lose some of their data. Since LD values are essential input parameters for running the CARMA algorithm, there may be SNPs that have a causal relationship with ASD but cannot undergo CARMA calculations due to the absence of LD values. As a result, these SNPs may not be included in the summarized pathogenic SNPs.
5. Conclusion
Through integrative genomics analyses leveraging GWAS data and causal statistical algorithms with and without functional annotations, we identified six high-confidence pathogenic SNPs driving ASD risk: rs2025811, rs3848794, rs10099100, rs714370, rs7820334, and rs6980908 spanning chromosomes 8 and 20. Incorporating regulatory genomic annotations prioritized the thalamus, cerebellum, and substantia nigra as key brain regions disrupted by the regulatory impacts of these risk variants on neurodevelopmental gene expression. These insights nominate specific neural circuits warranting deeper interrogation of pathogenic mechanisms underlying ASD.
Acknowledgments
Authors wishing to acknowledge assistance or encouragement from colleagues, special work by technical staff or financial support from organizations should do so in an unnumbered Acknowledgments section immediately following the last numbered section of the paper.
References
[1]. Lord, C., Elsabbagh, M., Baird, G. & Veenstra-Vanderweele, J. Autism spectrum disorder. The Lancet 392, 508–520 (2018).
[2]. Zeidan, J. et al. Global prevalence of autism: A systematic review update. Autism Res. 15, 778–790 (2022).
[3]. Rosenberg, R. E. et al. Characteristics and concordance of autism spectrum disorders among 277 twin pairs. Arch. Pediatr. Adolesc. Med. 163, 907–914 (2009).
[4]. Geschwind, D. H. Genetics of Autism Spectrum Disorders. Trends Cogn. Sci. 15, 409–416 (2011).
[5]. Bailey, A. et al. Autism as a strongly genetic disorder: evidence from a British twin study. Psychol. Med. 25, 63–77 (1995).
[6]. Szatmari, P. The causes of autism spectrum disorders: Multiple factors have been identified, but a unifying cascade of events is still elusive. BMJ 326, 173–174 (2003).
[7]. Grove, J. et al. Identification of common genetic risk variants for autism spectrum disorder. Nat. Genet. 51, 431–444 (2019).
[8]. Anney, R. J. L. et al. Meta-analysis of GWAS of over 16,000 individuals with autism spectrum disorder highlights a novel locus at 10q24.32 and a significant overlap with schizophrenia. Mol. Autism 8, 21 (2017).
[9]. Yang, Z. et al. CARMA is a new Bayesian model for fine-mapping in genome-wide association meta-analyses. Nat. Genet. 55, 1057–1065 (2023).
[10]. Weissbrod, O. et al. Functionally informed fine-mapping and polygenic localization of complex trait heritability. Nat. Genet. 52, 1355–1363 (2020).
[11]. Rolland, T. et al. Phenotypic effects of genetic variants associated with autism. Nat. Med. 29, 1671–1680 (2023).
[12]. Verly, M. et al. Altered functional connectivity of the language network in ASD: Role of classical language areas and cerebellum. NeuroImage Clin. 4, 374–382 (2014).
[13]. Woodward, N. D., Giraldo-Chica, M., Rogers, B. & Cascio, C. J. Thalamocortical dysconnectivity in autism spectrum disorder: An analysis of the Autism Brain Imaging Data Exchange. Biol. Psychiatry Cogn. Neurosci. Neuroimaging 2, 76–84 (2017).
Cite this article
Miao,Y. (2024). Mining autism causative SNPs based on CARMA algorithm. Theoretical and Natural Science,59,124-136.
Data availability
The datasets used and/or analyzed during the current study will be available from the authors upon reasonable request.
Disclaimer/Publisher's Note
The statements, opinions and data contained in all publications are solely those of the individual author(s) and contributor(s) and not of EWA Publishing and/or the editor(s). EWA Publishing and/or the editor(s) disclaim responsibility for any injury to people or property resulting from any ideas, methods, instructions or products referred to in the content.
About volume
Volume title: Proceedings of the 4th International Conference on Biological Engineering and Medical Science
© 2024 by the author(s). Licensee EWA Publishing, Oxford, UK. This article is an open access article distributed under the terms and
conditions of the Creative Commons Attribution (CC BY) license. Authors who
publish this series agree to the following terms:
1. Authors retain copyright and grant the series right of first publication with the work simultaneously licensed under a Creative Commons
Attribution License that allows others to share the work with an acknowledgment of the work's authorship and initial publication in this
series.
2. Authors are able to enter into separate, additional contractual arrangements for the non-exclusive distribution of the series's published
version of the work (e.g., post it to an institutional repository or publish it in a book), with an acknowledgment of its initial
publication in this series.
3. Authors are permitted and encouraged to post their work online (e.g., in institutional repositories or on their website) prior to and
during the submission process, as it can lead to productive exchanges, as well as earlier and greater citation of published work (See
Open access policy for details).
References
[1]. Lord, C., Elsabbagh, M., Baird, G. & Veenstra-Vanderweele, J. Autism spectrum disorder. The Lancet 392, 508–520 (2018).
[2]. Zeidan, J. et al. Global prevalence of autism: A systematic review update. Autism Res. 15, 778–790 (2022).
[3]. Rosenberg, R. E. et al. Characteristics and concordance of autism spectrum disorders among 277 twin pairs. Arch. Pediatr. Adolesc. Med. 163, 907–914 (2009).
[4]. Geschwind, D. H. Genetics of Autism Spectrum Disorders. Trends Cogn. Sci. 15, 409–416 (2011).
[5]. Bailey, A. et al. Autism as a strongly genetic disorder: evidence from a British twin study. Psychol. Med. 25, 63–77 (1995).
[6]. Szatmari, P. The causes of autism spectrum disorders: Multiple factors have been identified, but a unifying cascade of events is still elusive. BMJ 326, 173–174 (2003).
[7]. Grove, J. et al. Identification of common genetic risk variants for autism spectrum disorder. Nat. Genet. 51, 431–444 (2019).
[8]. Anney, R. J. L. et al. Meta-analysis of GWAS of over 16,000 individuals with autism spectrum disorder highlights a novel locus at 10q24.32 and a significant overlap with schizophrenia. Mol. Autism 8, 21 (2017).
[9]. Yang, Z. et al. CARMA is a new Bayesian model for fine-mapping in genome-wide association meta-analyses. Nat. Genet. 55, 1057–1065 (2023).
[10]. Weissbrod, O. et al. Functionally informed fine-mapping and polygenic localization of complex trait heritability. Nat. Genet. 52, 1355–1363 (2020).
[11]. Rolland, T. et al. Phenotypic effects of genetic variants associated with autism. Nat. Med. 29, 1671–1680 (2023).
[12]. Verly, M. et al. Altered functional connectivity of the language network in ASD: Role of classical language areas and cerebellum. NeuroImage Clin. 4, 374–382 (2014).
[13]. Woodward, N. D., Giraldo-Chica, M., Rogers, B. & Cascio, C. J. Thalamocortical dysconnectivity in autism spectrum disorder: An analysis of the Autism Brain Imaging Data Exchange. Biol. Psychiatry Cogn. Neurosci. Neuroimaging 2, 76–84 (2017).