


1.Introduction
The violin, with its unique timbre and rich emotional expression, holds an unparalleled position in the world of music. Central to this expressive power is the bow—not merely an accessory, but an essential bridge between the musician and the instrument. Through the bow, emotions are conveyed, and the composer's intentions are interpreted. However, mastering the control of the interaction between the bow and the strings is a challenge that every violinist must confront. Specifically, how can the force applied by the bow be controlled to optimize the violin’s timbre? This question forms the foundation of this study: how do the characteristics of the bow influence timbre control during performance, and thereby the playability of the violin?
When the bow draws across the string, an alternating process of adhesion and friction occurs, causing the string to vibrate [1]. If the vibration frequency matches the string's natural frequency, significant lateral oscillations arise, which in turn stimulate the violin body’s vibrations [2]. Thus, the production of sound in the violin is intrinsically linked to factors such as the bow's adhesion to the string, the magnitude of the friction force, and the vibration frequencies generated. Therefore, this research aims to investigate the physical characteristics of the bow and the string and establish a correlation between the bow's playability and the violin’s timbre.
The Helmholtz motion model, first proposed by Helmholtz [3], describes the string's motion when pulled by the bow, where the string takes on a V-shape. As the bow moves, when the bow force equals the static friction force, the string adheres to the bow. Raman[4] experimentally measured the friction force and found that under adhesive conditions, the friction force between the bow and the string remains nearly constant. Schelleng[5] investigated the effect of bowing position on string vibration. His model assumed that the string motion is constrained to a plane, the bow hair moves at a constant speed, and the bow-string contact involves single-point friction. Friedlander[6] explored the relationship between bow speed and friction force, concluding that the bow slides for as long as possible within a range of increasing friction forces, optimizing adhesion. Cremer[7] examined the relationship between bow force and string smoothness, noting that lower bow force yields smoother bow speed waveforms, producing sound with higher harmonic content and less energy. He also identified a hysteresis effect when the bow speed varies.
Despite substantial research on violin sound production, relatively few studies have focused on the bow’s own characteristics and their impact on the sound. This study will delve into the relationship between bow playability and tonal quality. In Section 2, finite element analysis, theoretical modeling, and experimental techniques will be applied to analyze the initial shaping of the bow. Section 3 will focus on the bow's stiffness through force and displacement tests, along with finite element optimization and reverse engineering to assess the physical properties of the bow’s material. In Section 4, we will investigate the resonance frequency and its corresponding mode shape of the bow under varying pretension forces, examining whether different pretension levels and bows affect the repeatability of the violin's tone. The final section will summarize the findings and provide an outlook for future research directions.
2.Research on the Initial Deformation of the Bow
Violinists generally believe that the shape of the bow has a significant influence on its sound production [8]. Therefore, studying how the initial deformation of the bow is formed is a crucial step in understanding its acoustic characteristics. Different manufacturers apply various force methods when crafting bows, leading to differences in the initial shape and pretension force of the bow. This section discusses the response of the bow under different force-loading methods and the influence of varying pretension forces on the bow's shape.
During the process of making a bow, the maker locks in internal stress by adjusting the bow's curvature. After doing so, they typically assume that the bow stick is upright and that the force is evenly distributed when the bow is drawn. Therefore, an equal force is applied in the opposite direction to restore the bow to a straight state. There are three main methods of applying force to bend the bow: mirroring, coupling, and stretching.
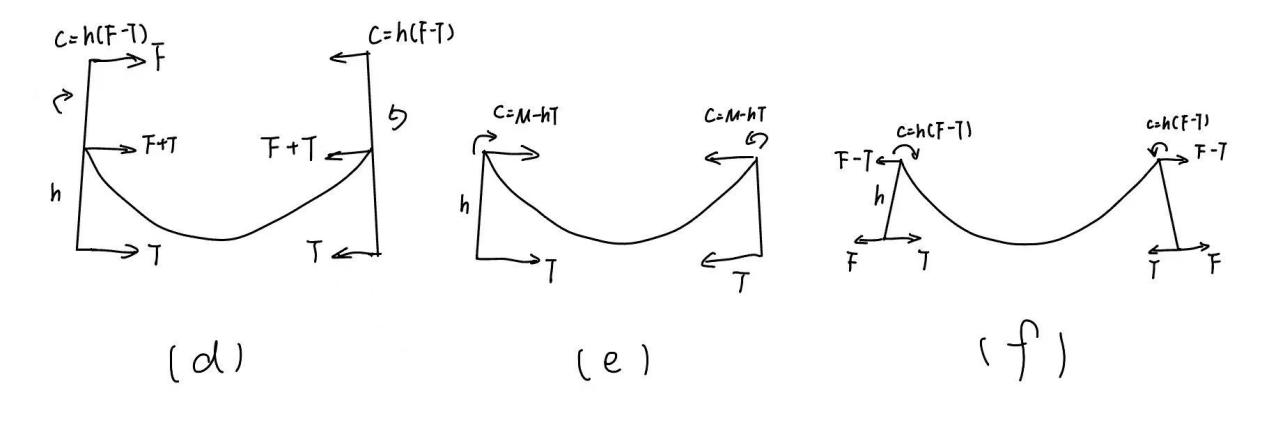
Figure 1: Schematic Diagram of Three Force Application Methods: Mirroring, Coupling, and Stretching
Figure 1 illustrates these three force application methods. The mirroring method (Figure 1a) involves inverting a straightened bow after normal tightening to reveal its curvature. The coupling method (Figure 1b) applies equal and opposite forces at both ends of the bow. The stretching method (Figure 1c) applies outward forces at both ends of the bow, opposite to the tension exerted by the bow hair.
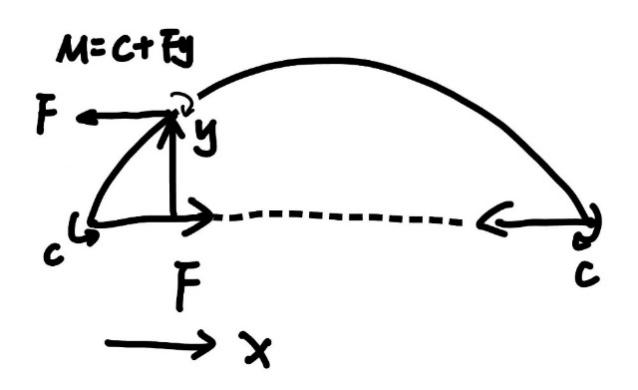
Figure 2: Free body diagram of a Bow
When making a bow, the force analysis of the bow stick is shown in Figure 2. Assuming that the bow stick experiences a force at a specific point, different force application methods lead to distinct deformation curves. In the three methods—mirroring, coupling, and stretching—the deflection of the bow stick varies. Since the displacement must be symmetrical and zero at both ends, each method affects the bow's shape differently. Using the moment balance equation:
\( \frac{{d^{2}}y}{d{x^{2}}}+{k^{2}}y=-\frac{C}{EI} \)(1)
Under different force application methods, such as mirroring, coupling, and stretching, the deflection patterns change. The boundary conditions are x(0)=x(l)=0, meaning the displacement at both ends is zero.
For the mirroring case, the equation is:
\( {y_{\frac{1}{2}}}=\frac{C}{F}∙\frac{1}{cos\frac{-{cos^{-1}}(\frac{4}{3l})l}{2}}∙[cos\frac{-{cos^{-1}}(\frac{4}{3l})l}{2}-x] \)(2)
In the coupling case, the equation is:
\( {y_{\frac{1}{2}}}=\frac{C}{F}∙\frac{3}{2}∙[\frac{3}{2}-x] \)(3)
After deriving the equations for the mirroring and coupling cases, which describe the relationship between deflection and various factors under different force application methods, it is essential to explore how these theoretical models align with real-world conditions.
To compare the actual bending shape of the bow with the theoretical model, we conducted a study using image processing technology. First, we captured photos of the bow without bow hair, alongside a ruler, using a mobile phone. Edge detection was performed through mobile phone software using the Sobel operator to extract the bow’s contours and ruler, which were then placed on a white background for MATLAB identification. The Sobel operator is a classic image edge detection algorithm based on the gray-weighted difference of pixel points, effectively identifying edge structures. By applying this operator, we can achieve more accurate three-dimensional modeling of the bow.
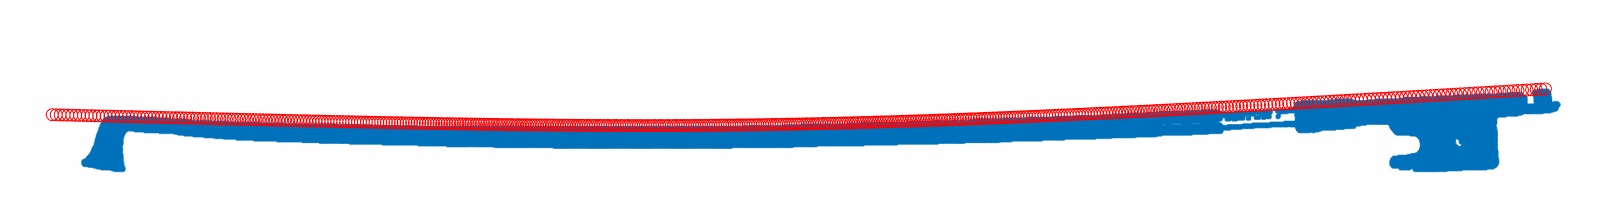
Figure 3: Fitted Curve and Bow
Figure 3 shows the basic alignment between the fitted curve and the bow’s edge curve.
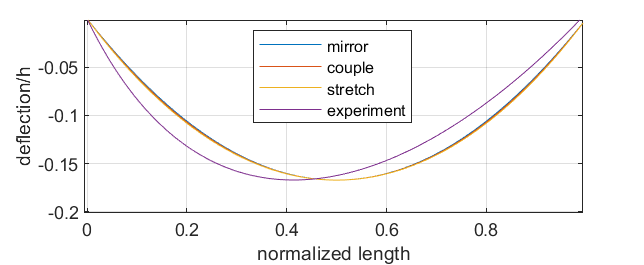
Figure 4: Comparison Between the Actual Bow Bending and the Theoretical Model
Figure 4 compares the initial bending of the actual bow and the theoretical model. It is evident that the actual bow's bending is more biased to one side than predicted by the theoretical model. Due to the variable cross-sectional structure of the bow, the bending stiffness varies along its length, causing the bow to deviate to one side when bending. A finite element buckling analysis was introduced to further investigate. Figure 5 shows the diameters in the horizontal and vertical directions at different cross-sectional points.
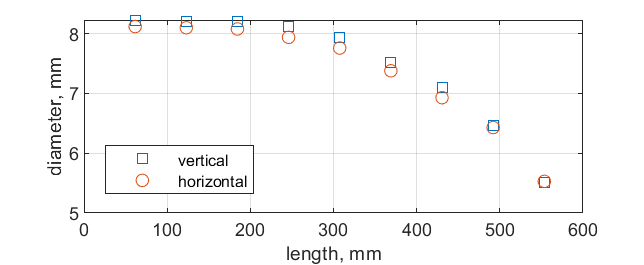
Figure 5: Cross-sectional Diameters of the Bow at Different Positions
Measurements reveal that the diameters in the horizontal and vertical directions are similar at each position. Figure 6 presents the simplified geometry of the bow.
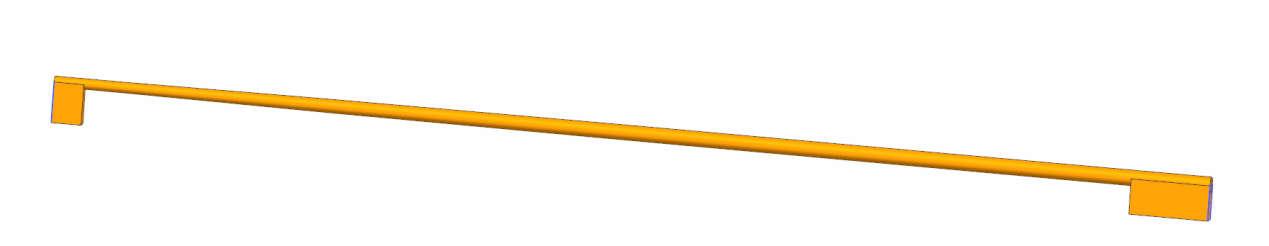
Figure 6: Simplified 3D Model of the Bow
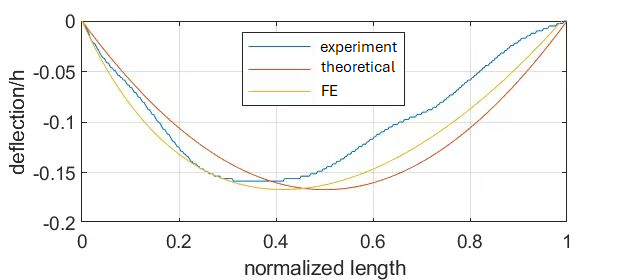
Figure 7: Comparison of Finite Element Analysis, Theoretical Model, and Experimental Results
Figure 7 shows a comparison of finite element analysis, the theoretical model, and experimental results. It can be observed that the midpoint of the finite element and experimental curves is shifted to the left compared to the theoretical model, indicating that when considering the variable cross-section of the bow, the midpoint deflects leftward. The trends of the three curves are similar, but the finite element curve is slightly lower than the theoretical and experimental curves near the right side of the bow. This discrepancy may be due to the finite element analysis accounting for the material’s Young’s modulus and density, factors not considered in the theoretical and experimental results. Additionally, the theoretical model does not factor in the bow's head and tail, which contributes to the discrepancies between the model and the actual structure. Further tests and material property measurements are needed to better verify the bow’s deformation profile.
3.Experimental investigation of the elastic properties of the bow and the pretension on the string
In this section, an experimental measurement platform is constructed for force and displacement. For the modelling of the bow, the Young's modulus of the wood used in the bow and the applied pretension force remained unclear. To address this, finite element analysis (FEA) is introducted to inversely estimate the Young's modulus of the wood and calculate the pretension force of the bow, thereby gaining a deeper understanding of the bow's vibration properties.
3.1.Experimental Setup
The overall design of the experimental device is shown in Figure 8. The bow is placed onto the test rig, the load-deflection curve for the bow with and without string is obtained experimentally.
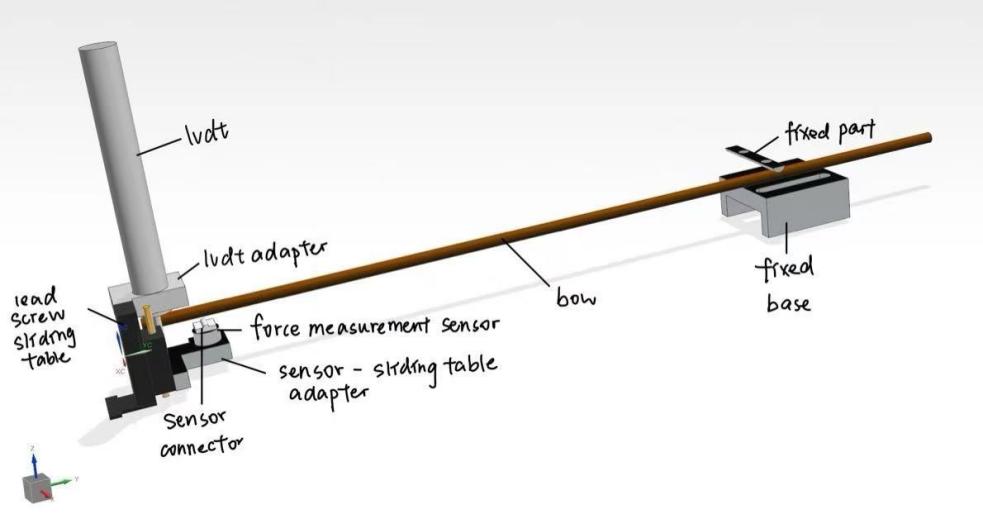
Figure 8: The platform for force and displacement measurement is shown on the left, the device for fixing the tail of the bow is on the right, and the brown component represents the simulated bow.
3.2.Estimation of the elastic modulus of the bow
A static structural finite element analysis is conducted to optimize and inversely deduce the material properties of the bow. By analyzing the deflection curve obtained from the experiment, we applied a known displacement and identified the corresponding maximum force. In the FEA, by iteratively testing different combinations of Poisson’s ratios, Young's moduli, and densities, we eventually found a set of parameters that aligned the FEA deflection curve with the experimental results, allowing us to deduce the Young's modulus.
The optimal Young’s modulus is obtained from the in-plane deformation and subsequently verified it using the outer surface data. The Ansys platform and the Multi-Objective Genetic Algorithm (MOGA) were used to rapidly adjust the parameters. The MOGA algorithm initially selected ten groups of Young’s moduli and Poisson’s ratios, ranking them based on the force discrepancy under a displacement of 13 mm. Crossover and mutation operations were then applied to generate new matrices of Young's moduli and densities. This iterative process continued until termination conditions—such as the number of iterations or the target reaction force—were met.
The optimized Young’s modulus and density are listed in the table below:
Table 1: Optimized Density and Young's Modulus of the Bow Material
|
Density\( ρ \)(\( kg{m^{-3}} \)) |
593.41 |
|
Young’s modulus E(GPa) |
12.665 |
After optimizing the material properties, we verified the Young’s modulus using displacement data from the outer surface (horizontal direction). Since the bow’s position in the coordinate system was neither fully horizontal nor vertical, the local coordinate system used the center of the bow tip's side as the origin.
Figure 9 shows the comparison between the deflection curves derived from FEA and experimental results.
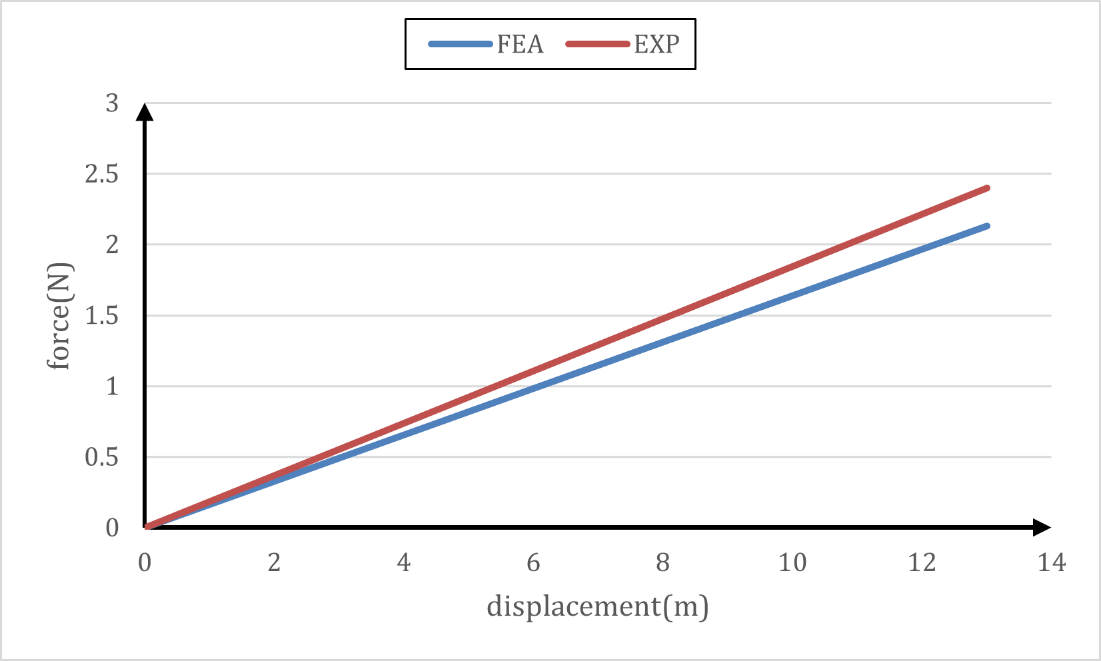
Figure 9: Comparison of Deflection Curves between Finite Element Analysis and Experimental Results
As seen in Figure 9, there is a slight difference between the experimental and FEA results. This discrepancy, likely caused by the inhomogeneity of the real bow wood’s Young’s modulus, amounts to about 0.3N, which has a minimal impact on the overall experimental accuracy.
3.3.Estimation of the pretension of the bow
A static structural analysis was performed on the bow without pretension force, and the pretension force was deduced by comparing the change in distance between two specific points during the bow's deformation.
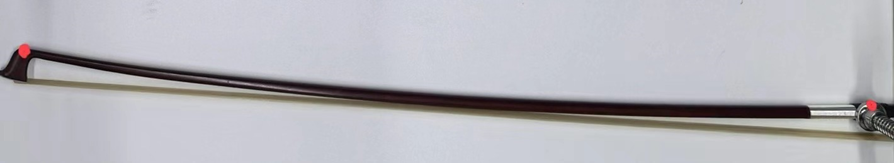
Figure 10: Illustration of the two specified points (marked by red dots)
By analyzing the bow’s maximum deformation, we determined the corresponding time during the loading in the FEA model and calculated the pretension force for each rotation of the locking bolt. The relationship between the degree of deformation and pretension force is illustrated in Figure 11.
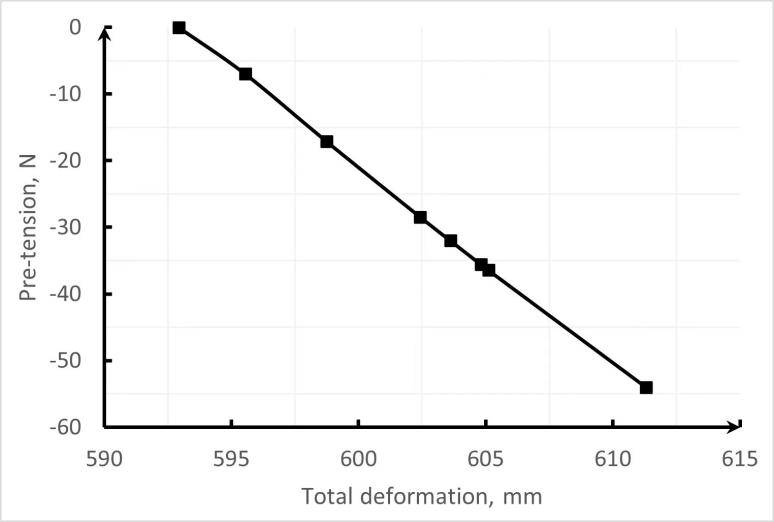
Figure 11: Diagram showing the relationship between the degree of deformation and the pretension force
The relationship between the number of turns and the pretension force is shown in Figure 12.
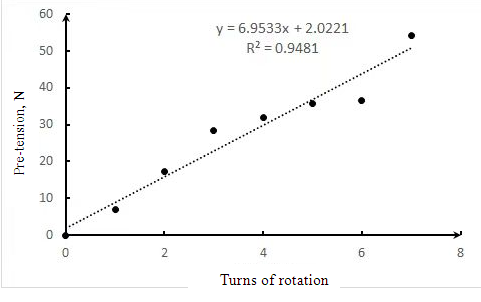
Figure 12: Diagram showing the relationship between the number of turns and the pretension force
Through the research in this section, we successfully deduced the Young's modulus of the bow's wood and calculated the bow’s pretension force when subject to different turns of the locking bolt, thus further refining our understanding of the bow's dynamic properties.
4.Influence of Different Pretension Forces on the playability of the Violin
In this section, we explore the effects of different pretension forces on the playability of the bow and the tone of the violin. By performing modal analysis, we exclude potential errors caused by the bow’s vibration modes, ensuring the reliability of our experimental results. The goal is to reveal the critical role of pretension force in violin playing by adjusting the bow’s tension and analyzing the resulting sound waveforms.
4.1.Modal Analysis
When playing the violin, the bow’s vibration frequency may approach a certain fixed frequency. To investigate whether the bow's vibration mode affects this frequency, we conducted a modal analysis under various pretension forces.
For each bow image analyzed, we calculated the first 10 modes and selected the 7th mode, which is close to 440 Hz, for comparison. The results are shown in the Figure 13 and 14.
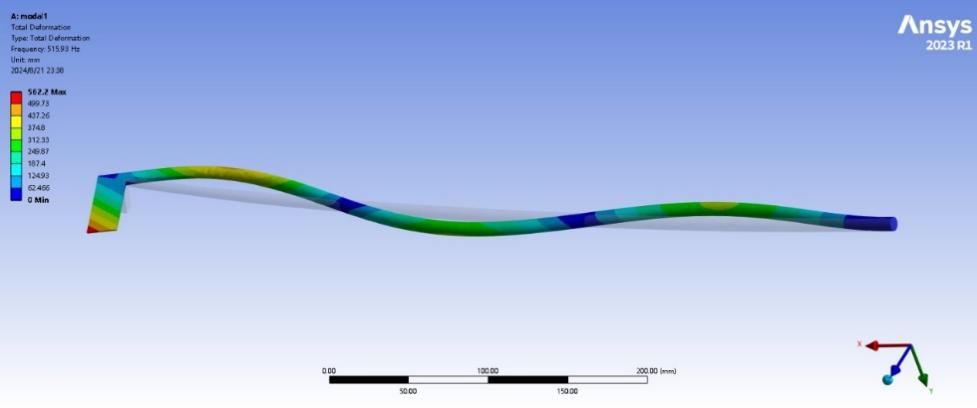
Figure 13: Mode shape of the bow (7th mode)
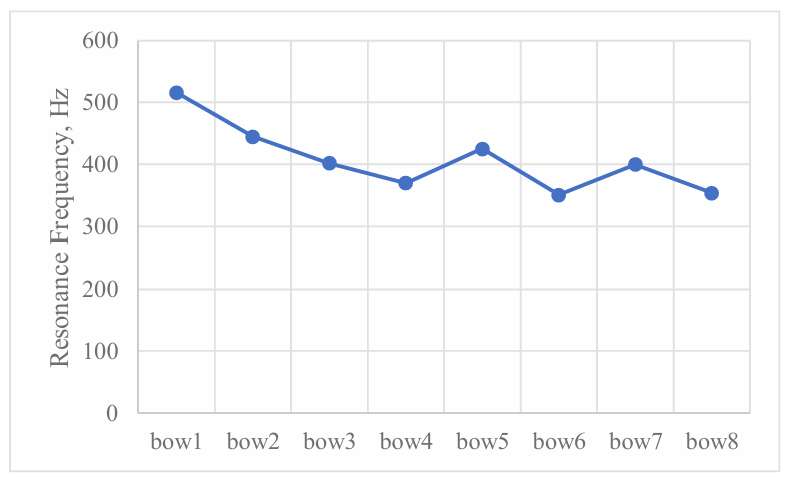
Figure 14: Changes in resonance frequencies under different pretension forces
As shown in Figure 14, the overall trend of the curve is downward, with a slight upward trend in the fifth and seventh images. This may be due to two potential factors: 1) slight deformation of the bow shape when the photos were taken, introducing errors, and 2) inaccuracies in point selection at the edge during modeling.
4.2.Experimental Design and Data Acquisition
In the experiment, three microphones were positioned 1 meter away from the sound production point of the violin, with a 120-degree angle between each adjacent pair, and the microphone height was aligned with the height of the violin head. This setup ensured that sound from all angles could be evenly captured.

Figure 15: Experimental configuration for the sound evaluation of the violin bow subject to different pretension
During violin playing, the pretension force (tightness) of the bow significantly influences sound generation. Since directly measuring the pretension force is difficult, we deduced the force on the bow hair by adjusting the number of turns when tightening or loosening the bow, and used the finite element analysis results from the previous section. To capture the violin sound accurately, a high-precision capacitive sound pressure sensor was used. The microphone signal was processed via an amplification and conditioning device, connected to a data acquisition card, and converted into a time signal for sound pressure, which was transmitted to the computer for analysis.
The experiment recorded 10 sets of violin sounds by pulling the A string (II string), with a sampling frequency of 51,200 Hz for each set. Each set consisted of five tests, with a 10-second pause between each set to allow the violin sound to decay to the background noise level.
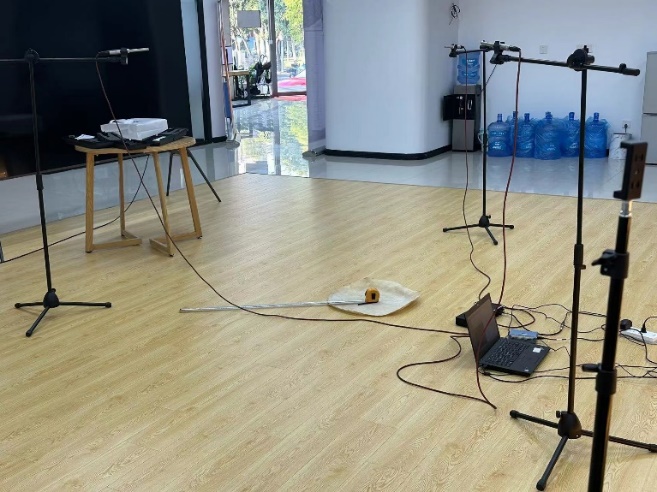
Figure 16: Typical Time Signal of the Microphone
4.3.Analysis of the Influence of the Main Frequency and Harmonics
Figure 17 shows a typical spectrum function of the microphone sound pressure signal. It can be seen that the main frequency of the violin sound (440 Hz) is the most easily excited, and its harmonics are integer multiples of the main frequency, though with lower amplitudes.
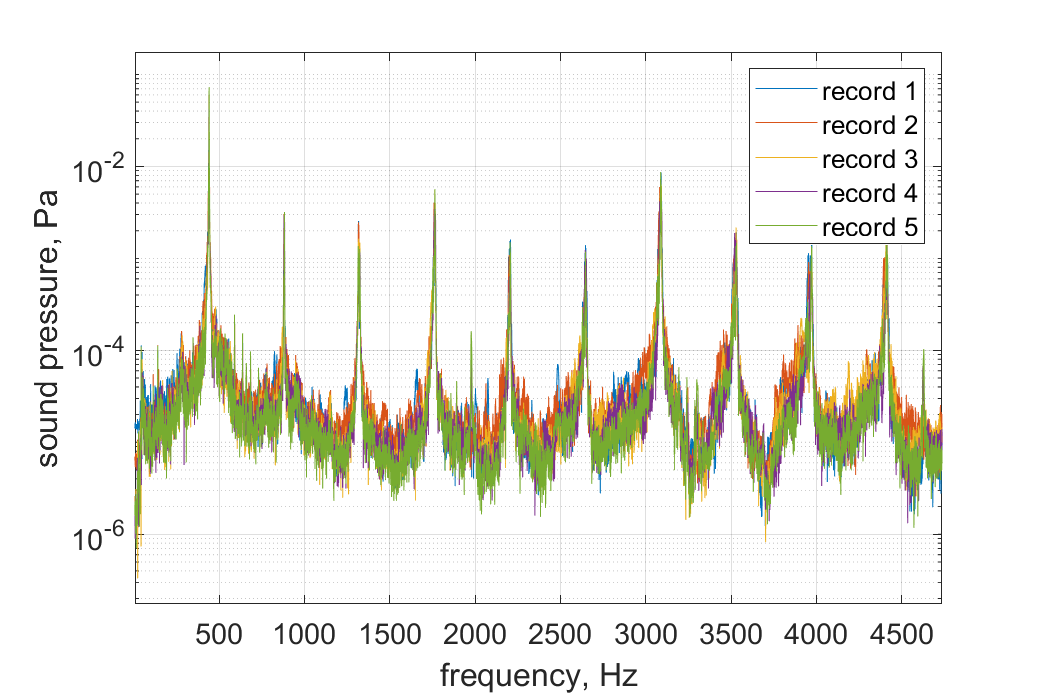
Figure 17: Frequency Response Function of the Microphone Sound Pressure Signal
According to White's research [8], the main frequency determines pitch, while harmonics influence timbre. This research focuses on how different bow tightness affects both the main frequency and harmonics.
To assess the repeatability of violin sound without pretension force, we conducted five tests on the same note. When the bow had no pretension force, the main frequency fluctuated slightly (±1 Hz), and the amplitude varied between 0.06 and 0.071—changes small enough to be imperceptible to the human ear.
To explore how different pretension forces affect the repeatability of violin playing, we analyzed changes in sound pressure and amplitude under different pretension conditions. Figure 18 shows the spectrum of the main frequency. As the pretension force increases, the variation in the maximum sound pressure level at 440 Hz becomes more uniform. However, when the natural frequency of the bow approaches the sound production frequency, the change becomes more pronounced, reducing controllability.
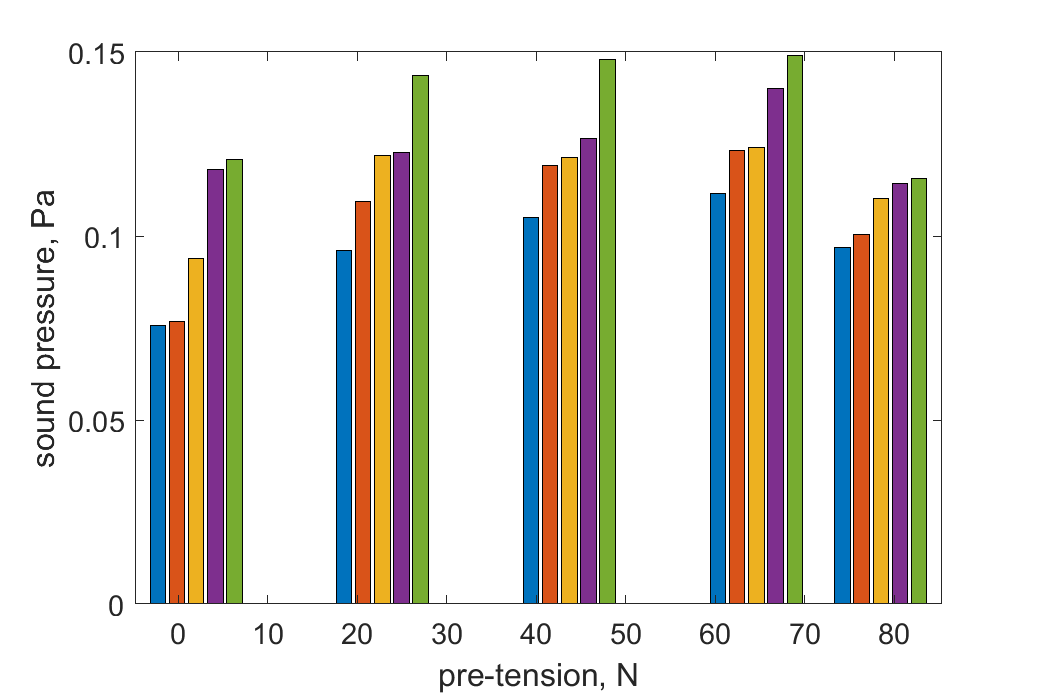
Figure 18: Spectrum of the Main Frequency Amplitude (different color refers to different runs)
This chapter experimentally examined the influence of different pretension forces on the violin’s sound spectrum. The results show that excessive pretension force significantly impacts the harmonics of the bow, altering the timbre, while too little pretension force leads to poor repeatability of the violin sound. Therefore, the pretension force of the bow must be moderate to ensure optimal timbre and stable playing performance.
5.Conclusion
This study comprehensively investigated the influence of bow pretension force on violin performance through theoretical modeling, finite element analysis, and experimental verification, alongside an in-depth analysis of the material properties of the bow.
First, theoretical modeling established the initial shape of the violin bow and described its bending behavior. Using a multi-objective genetic algorithm, we optimized the Young's modulus of the bow's wooden material and obtained a deflection curve that closely matched the actual measurements.
The experimental phase further examined the effect of different pretension forces on the violin's tone. The results indicate that higher pretension force increases the amplitude of harmonics, thereby altering the timbre. However, the experiments also revealed that both excessively high and low pretension forces negatively impact the controllability of the bow and the stability of the performance.
By integrating theoretical modeling, finite element analysis, and experimental data, this study concludes that moderate pretension force optimally balances timbre and playing stability, ensuring the best performance on the violin. This research not only enhances our understanding of the bow's acoustic characteristics but also provides a scientific basis for violinists when selecting and adjusting their bows.
References
[1]. Saunders F A. The mechanical action of violins[J]. The Journal of the Acoustical Society of America, 1937, 9(2): 81-98.
[2]. Rossing T D, Fletcher N H. Principles of vibration and sound[M]. Springer Science & Business Media, 2012.
[3]. Helmholtz H v and Ellis A J 1954 On the sensations of tone as a physiological basis for the theory of music (New York: Dover Publications)
[4]. Raman C V 1918 On the mechanical theory of vibrations of bowed strings Bulletin of the Indian Association for the Cultivation of Science 15 1-158
[5]. Schelleng J C 1973 Bowed String and Player J Acoust Soc Am 53 26-41
[6]. Friedlander F G 1953 On the oscillations of the bowed string Proceedings of the Cambridge Philosophical Society 49 516-30
[7]. Cremer L 1974 Influence of Bow Pressure on Self-Excited Vibrations of Stringed Instruments Acustica 30 119-36
[8]. White H E, White D H. Physics and music: the science of musical sound[M]. Courier Corporation, 2014.
Cite this article
Zhao,X. (2025). Influence of Bow Pretension Force on Violin Performance. Theoretical and Natural Science,87,71-81.
Data availability
The datasets used and/or analyzed during the current study will be available from the authors upon reasonable request.
Disclaimer/Publisher's Note
The statements, opinions and data contained in all publications are solely those of the individual author(s) and contributor(s) and not of EWA Publishing and/or the editor(s). EWA Publishing and/or the editor(s) disclaim responsibility for any injury to people or property resulting from any ideas, methods, instructions or products referred to in the content.
About volume
Volume title: Proceedings of the 4th International Conference on Computing Innovation and Applied Physics
© 2024 by the author(s). Licensee EWA Publishing, Oxford, UK. This article is an open access article distributed under the terms and
conditions of the Creative Commons Attribution (CC BY) license. Authors who
publish this series agree to the following terms:
1. Authors retain copyright and grant the series right of first publication with the work simultaneously licensed under a Creative Commons
Attribution License that allows others to share the work with an acknowledgment of the work's authorship and initial publication in this
series.
2. Authors are able to enter into separate, additional contractual arrangements for the non-exclusive distribution of the series's published
version of the work (e.g., post it to an institutional repository or publish it in a book), with an acknowledgment of its initial
publication in this series.
3. Authors are permitted and encouraged to post their work online (e.g., in institutional repositories or on their website) prior to and
during the submission process, as it can lead to productive exchanges, as well as earlier and greater citation of published work (See
Open access policy for details).
References
[1]. Saunders F A. The mechanical action of violins[J]. The Journal of the Acoustical Society of America, 1937, 9(2): 81-98.
[2]. Rossing T D, Fletcher N H. Principles of vibration and sound[M]. Springer Science & Business Media, 2012.
[3]. Helmholtz H v and Ellis A J 1954 On the sensations of tone as a physiological basis for the theory of music (New York: Dover Publications)
[4]. Raman C V 1918 On the mechanical theory of vibrations of bowed strings Bulletin of the Indian Association for the Cultivation of Science 15 1-158
[5]. Schelleng J C 1973 Bowed String and Player J Acoust Soc Am 53 26-41
[6]. Friedlander F G 1953 On the oscillations of the bowed string Proceedings of the Cambridge Philosophical Society 49 516-30
[7]. Cremer L 1974 Influence of Bow Pressure on Self-Excited Vibrations of Stringed Instruments Acustica 30 119-36
[8]. White H E, White D H. Physics and music: the science of musical sound[M]. Courier Corporation, 2014.