


1. Introduction
Formula 1 racing is an extreme sport with very high technical requirements, where wind speed is one of the key factors affecting the performance of the race cars. Since air resistance is proportional to the square of velocity, an increase in wind speed leads to greater resistance. Aerodynamic accessories such as spoilers, side skirts, and front and rear wings are designed to perform optimally within specific wind speed ranges, and changes in wind speed can affect their efficiency. For drivers, sudden changes in wind speed can affect their reaction times, especially on corners and at high speeds, where extreme wind speeds add to the challenge of controlling the race car.
The impact of wind speed on the aerodynamic characteristics of F1 cars has been extensively discussed in numerous studies. For instance, Preosti pointed out in his research that F1 cars are highly sensitive to wind speed, and changes in wind speed can significantly affect the downforce and balance of the car [1]. Al Muharrami et al. studied the aerodynamic characteristics of GT2 and F1 cars at different speeds [2]. Abdulwahab and Chen explored the effects of different flap angles and wind speeds on the aerodynamic performance of F1 cars [3]. Additionally, Tan et al. analyzed the aerodynamic characteristics of the front wing of F1 cars, particularly the impact of wind speed on static pressure, lift, downforce, and drag [4]. These studies indicate that the influence of wind speed on the aerodynamics of F1 cars is complex and multidimensional.
It is evident that wind speed prediction has significant practical value in F1 racing, especially in Grand Prix events, where changes in wind speed directly affect the speed and stability of the race cars, thereby impacting the race results. Traditional wind speed forecasting methods include statistical and machine learning approaches, such as random forests and gradient boosting decision trees [5-6]. However, these methods often have limitations when dealing with wind speed data characterized by nonlinearity and non-stationarity. For example, Younis et al. noted that traditional statistical methods using the Weibull distribution model perform poorly in predicting low wind speeds, struggling to capture the variations in complex wind speed patterns, with significant biases particularly in predictions below 2 m/s [7]. Rangaraj et al. further pointed out that although statistical methods using Weibull and log-normal distributions can provide good predictions in some cases, their model biases remain a fundamental limitation, especially when the models are applied to different geographical areas or extreme weather conditions, leading to a marked decrease in prediction accuracy [8].
In recent years, with the gradual maturation of deep learning methods, the Long Short-Term Memory network (LSTM) has demonstrated superior performance in handling time series data [9]. However, the single LSTM model also has insufficient predictive accuracy when dealing with complex wind speed data. For instance, Cho et al. studied multi-step forecasting systems and found that single LSTM models face challenges in capturing long-term dependencies [10]. Joseph et al. noted that although LSTM excels in processing nonlinear and time series data, its predictive accuracy still needs improvement when dealing with highly complex and multivariate datasets [11].
Therefore, this paper proposes a method that combines Empirical Mode Decomposition (EMD) with Long Short-Term Memory networks for wind speed prediction in F1 Grand Prix events. By using EMD to decompose complex time series data into several Intrinsic Mode Functions (IMFs), which have different frequencies and time scales, an LSTM model is applied to predict each IMF component. The predictions are then reconstructed to obtain the final wind speed forecast. To study the effectiveness of this method, actual wind speed data from F1 Grand Prix events are used for experiments, and comparisons are made with traditional LSTM, random forest, and GBDT methods. The experimental results show that the wind speed prediction method based on EMD-LSTM is superior to traditional methods in terms of prediction accuracy and stability, providing an effective solution for wind speed prediction in F1 Grand Prix events. This study offers a new perspective and approach in the field of wind speed prediction for F1 Grand Prix, with significant theoretical significance and practical application value.
2. Description of data
The wind speed data utilized in this study were recorded at the racetracks during the Formula 1 Grand Prix from 2018 to 2023. The data encompasses wind speed variations across multiple seasons, with a total of 18,214 sets of wind speed data collected, sampled at a frequency of once per minute. These data are characterized by high temporal resolution and continuity. To better comprehend the distribution and time series characteristics of the wind speed data, this study conducted a visual analysis of the data. The following is a description and analysis of the histogram and time series plot of the data. The histogram of the raw wind speed data is shown in Figure 1, and the visualization of the raw wind speed data is depicted in Figure 2.
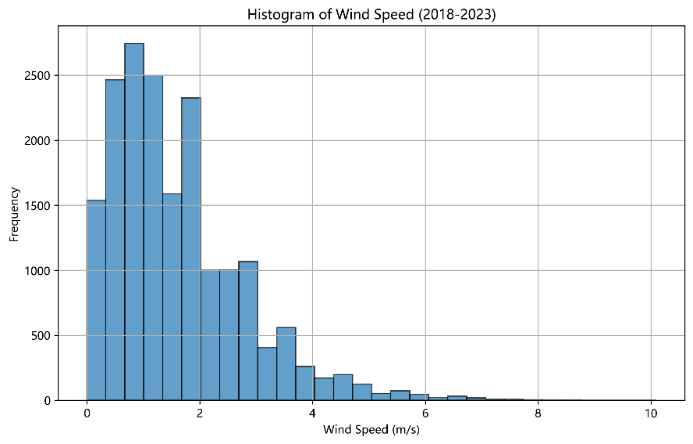
Figure 1. Histogram of Wind Speed Data During the Formula 1 Grand Prix from 2018 to 2023
As shown in Figure 1, it illustrates the frequency distribution of the wind speed data, which exhibits a skewed distribution. The vast majority of wind speed values are concentrated between 0 to 4 m/s, with the highest frequency occurring at wind speeds of 1 to 2 m/s. The basic statistical characteristics of the data are shown in Table 1:
Table 1. Basic Statistical Features of Wind Speed Data
Statisic | Value |
Count | 18214 |
Mean | 1.617058 m/s |
Standard Deviation | 1.171512 |
Minimum | 0 m/s |
Median | 1.3 m/s |
Maximum | 10.1 m/s |
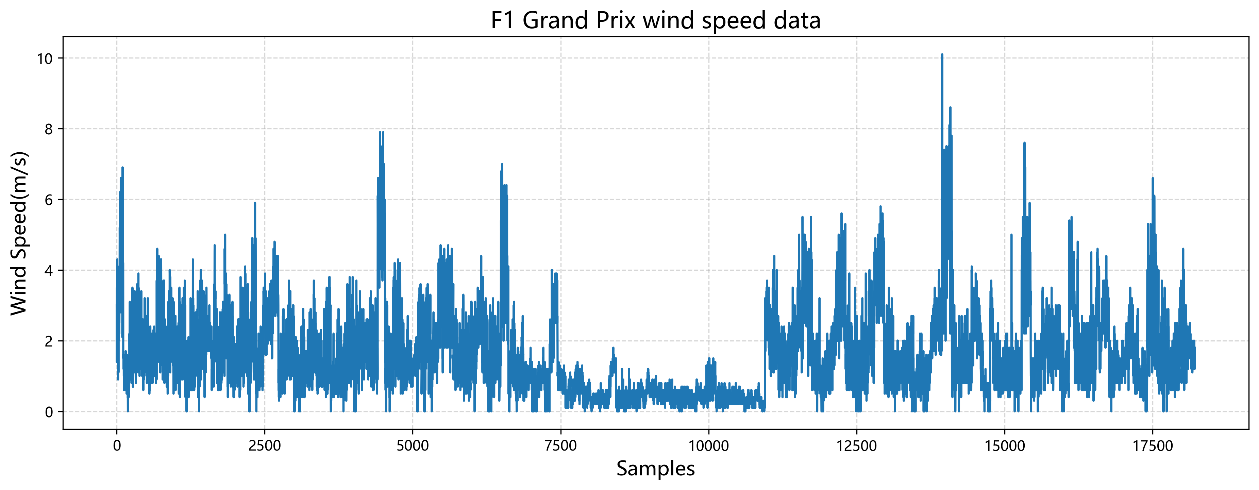
Figure 2. Visualization of Wind Speed Data During the Formula 1 Grand Prix from 2018 to 2023
As depicted in Figure 2, the graph illustrates significant fluctuations in wind speeds at various time points, with multiple peaks in wind speed values. The occurrence of high wind speeds (exceeding 6 m/s) is relatively infrequent. Overall, the Formula 1 Grand Prix dataset encompasses six years of wind speed data, totaling 18,214 sets, providing the model with a substantial sample size that aids in capturing the subtle characteristics and patterns of wind speed variation. Through the analysis and visualization of the data, this study found that these wind speed data exhibit notable features that support effective forecasting by the EMD-LSTM model. The richness, diversity, and pronounced temporal characteristics of the data provide a solid foundation for the model, contributing to enhanced accuracy and robustness in predictions.
3. Methodology
3.1. EMD (Empirical Mode Decomposition)
Empirical Mode Decomposition (EMD) is an adaptive data analysis method primarily used for processing nonlinear and non-stationary time series. EMD can decompose a complex time series signal into several Intrinsic Mode Functions (IMFs) and a residual component. Each IMF represents oscillation components of different scales within the original signal, enabling multi-scale analysis of the data. In recent years, EMD has been widely applied in the analysis of various time series data [12].
The basic steps of EMD decomposition are as follows:
(1) Identify all local maxima and minima in the wind speed data sequence x(t).
(2) Construct an envelope by using cubic spline interpolation for both the local maxima and minima to form the upper and lower envelopes.
(3) Calculate the mean curve by averaging the upper and lower envelopes.
\( m(t)=\frac{u(t)+l(t)}{2} \ \ \ (1) \)
In Equation (1), u(t) is the upper envelope, and l(t) is the lower envelope.
(4) To obtain the initial Intrinsic Mode Function (IMF), calculate the difference between the signal and the mean envelope curve:
\( h(t)=x(t)-m(t)\ \ \ (2) \)
(5) Treat h(t) as the new signal and repeat steps (1) to (4) until h(t) meets the two criteria for an Intrinsic Mode Function (IMF): the number of extrema and the number of zero-crossings are either equal or differ at most by one; at any given time, the local mean of its envelopes is zero. The obtained h(t) is the first IMF, denoted as IMF1(t).
(6) Extract the first IMF from the original signal:
\( {r_{1}}(t)=x(t)-IM{F_{1}}(t) \ \ \ (3) \)
Take the residual signal r1(t) as the new signal and repeat the aforementioned process until the residual signal rn(t) no longer contains any meaningful oscillatory components. Eventually, the original signal x(t) is decomposed into several Intrinsic Mode Functions (IMFs) and a residual component rn(t):
\( x(t)=\sum _{i=1}^{n}IM{F_{i}}(t)+{r_{n}}(t) \ \ \ (4) \)
3.2. Z-Score Normalization
In this study, the z-score normalization method is applied to each Intrinsic Mode Function (IMF) component data obtained after EMD decomposition. This method transforms the data into a standard normal distribution with a mean of 0 and a standard deviation of 1, ensuring that each feature contributes equally to the analysis and model training.
\( Z=\frac{X-μ}{σ}\ \ \ (5) \)
In Equation (1), Z is the value after normalization, X is the original value, μ is the mean of the dataset, and σ is the standard deviation of the dataset.
3.3. Wind Speed Prediction Model
3.3.1. LSTM Neural Network Model
The Long Short-Term Memory (LSTM) neural network is a special kind of recurrent neural network designed to address the issues of gradient vanishing and gradient explosion that standard RNNs encounter when dealing with long-term dependencies. LSTM effectively captures and retains long-term dependencies in sequence data by introducing a gating mechanism, which includes the input gate, forget gate, and output gate. As shown in Figure 3, it illustrates the basic structure of the LSTM neural network.
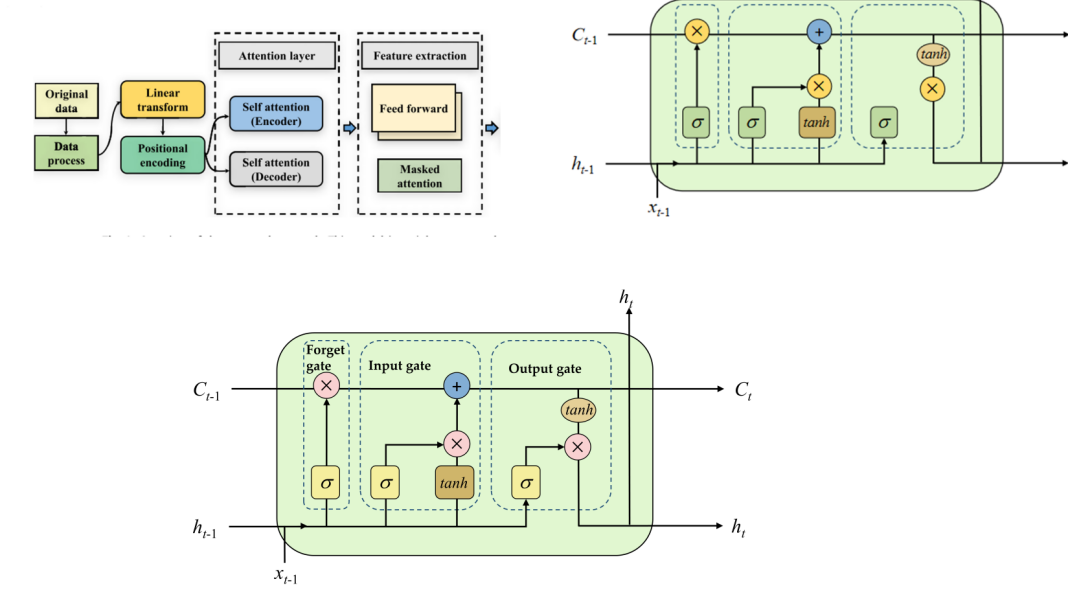
Figure 3. Structure of LSTM neural network
As shown in Figure 3, the LSTM unit comprises three gating mechanisms and a cell state, whereCt-1, ht-1 and xt-1 represent the inputs from the previous moment, and Ct, ht and xt represent the outputs at the current moment.
The forget gate determines how much information to discard from the cell state.
\( {f_{t}}=σ({W_{f}}\cdot [{h_{t-1}},{x_{t}}]+{b_{f}})\ \ \ (6) \)
In Equation (6), σ represents the Sigmoid function, Wf is the weight matrix, ht-1 is the hidden state from the previous moment, xt is the current input, and bf is the bias term.
The input gate determines which new information needs to be incorporated into the current cell state.
\( \begin{matrix}{i_{t}}=σ({W_{i}}\cdot [{h_{t-1}},{x_{t}}]+{b_{i}}) \\ {\widetilde{C}_{t}}=tanh{({W_{C}}\cdot [{h_{t-1}},{x_{t}}]+{b_{C}})} \\ \end{matrix}\ \ \ (7) \)
In Equation (7), it is the activation value of the input gate and \( {\widetilde{C}_{t}} \) represents the new candidate values. tanh is the hyperbolic tangent function, Wi and Wc are weight matrices, and bi and bc are bias terms. The output gate determines which parts of the current cell state will be outputted.
\( \begin{matrix}{O_{t}}=σ({W_{o}}[{h_{t-1}},{x_{t}}]+{b_{O}}) \\ {h_{t}}=O_{t}^{*}tanh{({C_{t}})} \\ \end{matrix}\ \ \ (8) \)
In Equation (8), ot is the activation value of the output gate, ht is the hidden state at the current moment, and Ct is the updated cell state.
Wind Speed Prediction Model Based on EMD-LSTM
This study proposes a wind speed prediction model based on Empirical Mode Decomposition (EMD) and Long Short-Term Memory (LSTM) neural networks. The model consists of a data decomposition module (Empirical Mode Decomposition), a time-sequence dependency extraction module (LSTM neural network), and a prediction output module, among others.
By employing EMD to enhance the representation of data features, an LSTM neural network is set up to extract temporal dependencies from time series data. The feature-extracted data is then further modeled for its temporal dependencies through LSTM layers, with the number of neurons in the LSTM layers being 32 and 64, respectively. An Adam optimizer with adaptive learning rate and gradient scaling is chosen for network training. Utilizing EMD, the wind speed data is decomposed from a complex signal with insufficient features into several Intrinsic Mode Functions (IMFs) with local feature representation, and the decomposed IMFs encompass all features of the original signal. Consequently, the subsequent model more readily obtains features conducive to wind speed prediction from the decomposed multivariate signals.
The overall process is as follows: The original wind speed data is decomposed using EMD to obtain 14 IMF components. These IMF components, derived from EMD, are taken as inputs and sequentially pass through two LSTM layers for temporal feature extraction, with the first LSTM layer having an output dimension of 32 and the second an output dimension of 64. A linear layer is used to map the features extracted by LSTM, culminating in the final prediction output. Figure 4 illustrates the model's structure.
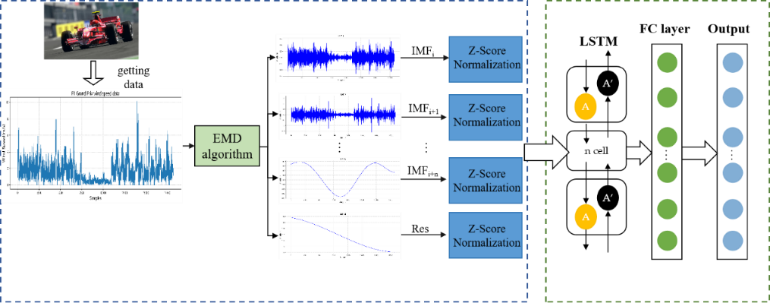
Figure 4. Structure of EMD-LSTM forecast model
3.4. Performance Index
This article uses Mean Absolute Error (MAE), Mean Squared Error (MSE), Root Mean Squared Error (RMSE), and the coefficient of determination (R^2) to measure the accuracy of wind speed forecasting. The definitions of these metrics are as shown in equations (9-12).
\( MAE=\frac{1}{n}\sum _{s=1}^{n}|{y_{s}}-{\hat{y}_{s}}|\ \ \ (9) \)
\( MSE=\frac{1}{n}\sum _{i=1}^{n}{({y_{s}}-{\hat{y}_{s}})^{2}}\ \ \ (10) \)
\( RMSE=\sqrt[]{\frac{1}{n}\sum _{s=1}^{n}{({y_{s}}-{\hat{y}_{s}})^{2}}}\ \ \ (11) \)
\( {R^{2}}=1-\frac{\sum _{s=1}^{s}{({y_{s}}-\bar{{\hat{y}_{s}}})^{2}}}{\sum _{s=1}^{s}{({y_{s}}-{\bar{y}_{s}})^{2}}}\ \ \ (12) \)
In the aforementioned formulas, \( {\hat{y}_{s}} \) represents the predicted wind speed, \( {y_{s}} \) represents the actual wind speed, \( \bar{{\hat{y}_{s}}} \) represents the mean of the predicted wind speeds, and \( {\bar{y}_{s}} \) represents the mean of the actual wind speeds.
4. Analysis of Prediction Results
The EMD-LSTM model is used to train, validate, and test the wind speed data of the F1 Grand Prix to assess the rationality of the model establishment.
4.1. EMD Data Decomposition
The original wind speed data is decomposed into 14 sets of Intrinsic Mode Functions (IMFs). By observing the IMF images, it can be seen that the data gradually becomes more stable from a fluctuating state, with the variation characteristics being basically consistent. This indicates that after the wind speed data is decomposed by EMD, it can be fully extracted and expressed, thereby effectively improving the prediction accuracy of subsequent models such as the LSTM neural network. The results are shown in Figure 5.
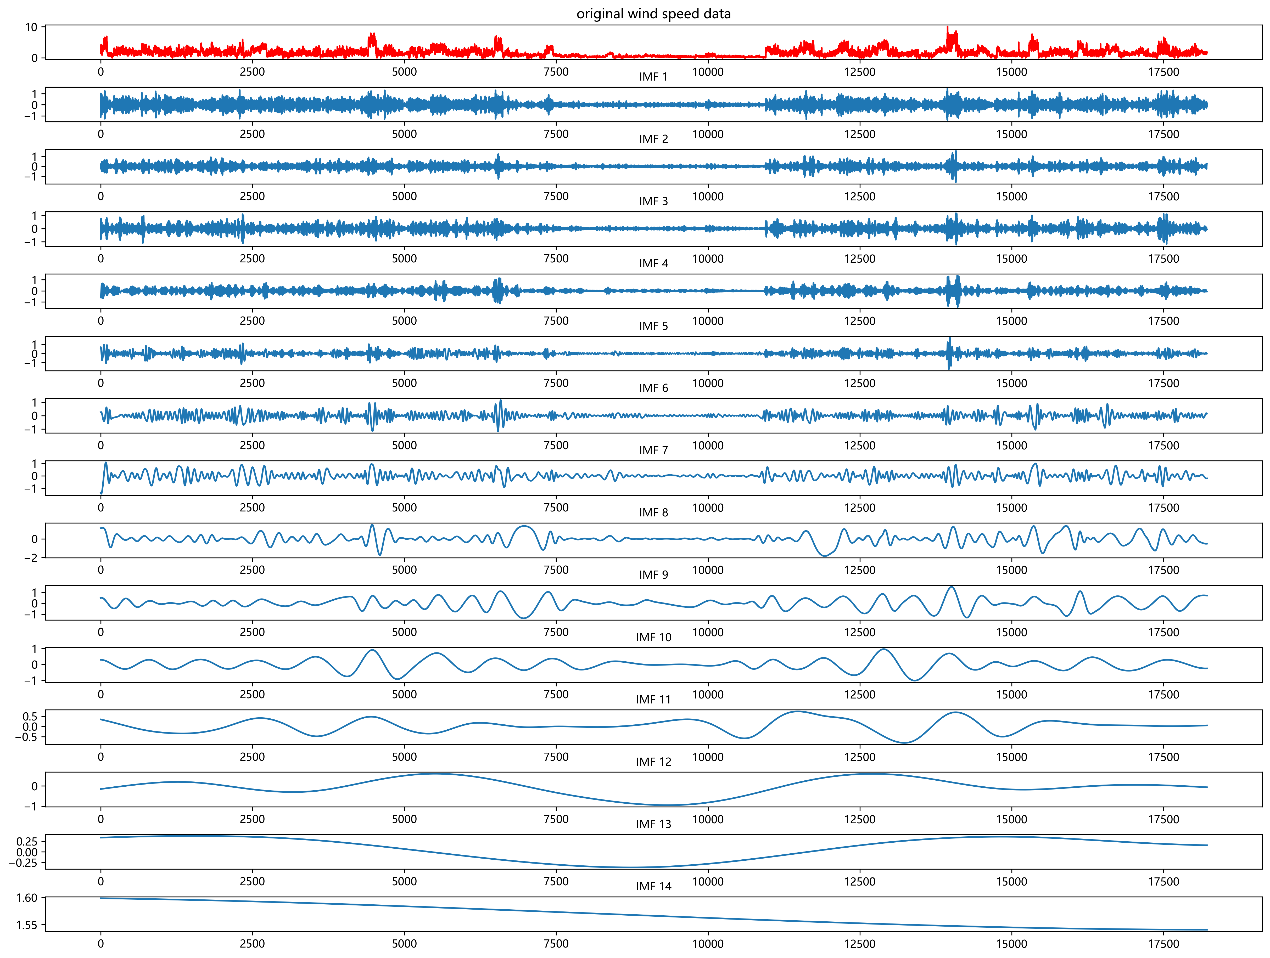
Figure 5. Visualization of EMD Decomposition of Original Wind Speed Data
4.2. Model Performance Evaluation
4.2.1. EMD-LSTM Model Parameters
In this experiment, the Pytorch 2.1.0 framework is selected for model construction. In terms of parameter settings, the number of LSTM neurons in the first layer is 32, and in the second layer, it is 64. The input is a 14-dimensional IMF component, and the output dimension is also 14, which facilitates a clear observation of the model's predictive effect on each IMF component. In terms of model training, 70% of the data is selected as the training set, 20% as the validation set, and the remaining 10% as the test set. The LSTM network training step is 7, the batch size is 64, and the training is set for 100 epochs. The initial learning rate is 0.0001, and the optimizer is the Adam optimizer.
4.2.2. Model Validation Results
During the model validation phase, predictions were made on the test set, and the predicted results were compared with the actual data. Gradient-free prediction is used during the validation phase, which means that gradients are not calculated during the evaluation process, thus saving memory and accelerating computation speed. When performing data transformation and reconstruction, the two-dimensional list is first converted into an array and the dimensions are adjusted. The previously saved normalization parameters (mean and standard deviation) are loaded to de-normalize the predicted results, restoring them to the original scale. The same normalization parameters are used to de-normalize the original and predicted component data. During data reconstruction, the original component data of the test set is summed by column to reconstruct the original wind speed data. The predicted component data is also summed by column to reconstruct the predicted wind speed data. Finally, the predictive effect of each IMF component is shown in Figure 6. It can be seen that the predicted data has a high degree of coincidence with the original data, proving that this model effectively utilizes the multi-scale characteristics of EMD decomposition, enabling the model to extract data features at different time scales, thereby improving the accuracy and stability of wind speed forecasting.
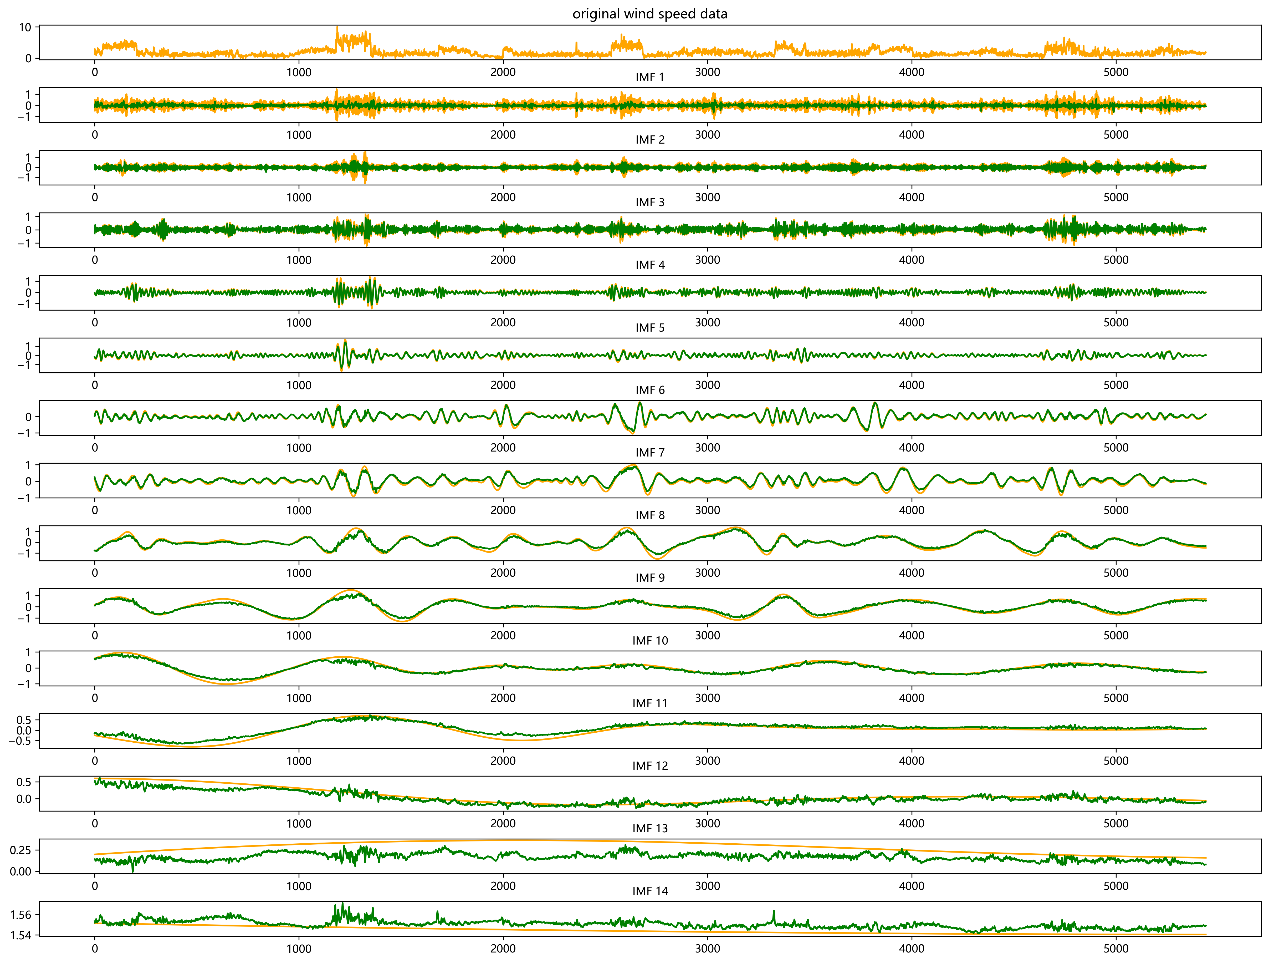
Figure 6. Visualization of the Predictive Effect of IMF Components
To further verify the model's validation effect and to propose the rationality of the model, the test results were compared with those of an LSTM model with the same parameter settings and the same number of neurons, as well as the EMD-optimized Random Forest and GBDT, which are two machine learning methods. The comparison results are shown in Figure 7.
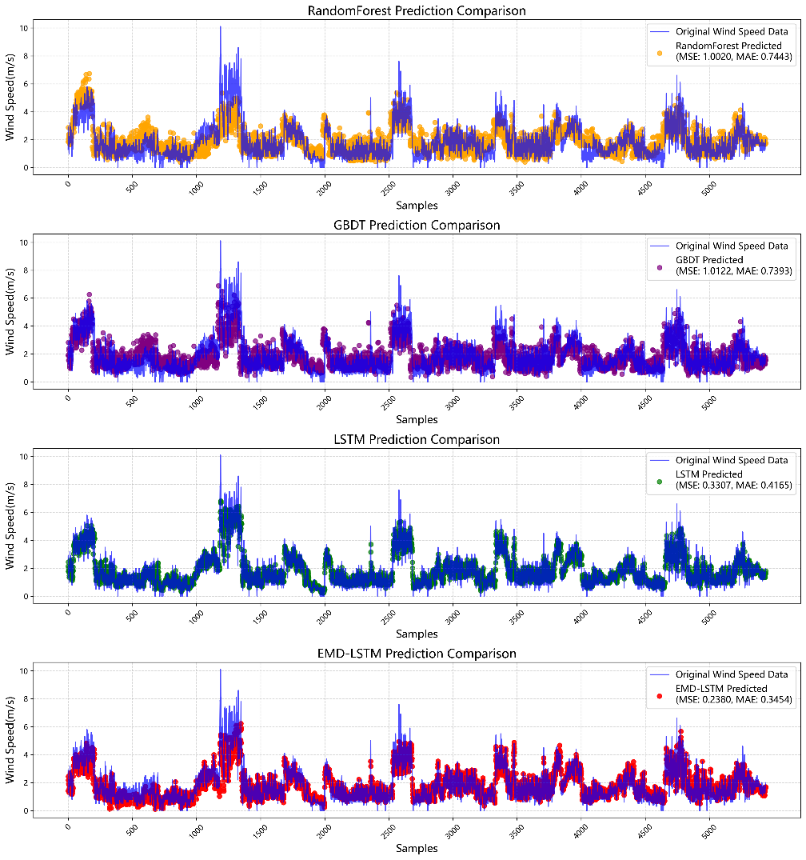
Figure 7. Visualization of Model Comparison Prediction Effects
From the first part of Figure 7, it can be observed that the prediction values of the Random Forest model, when compared with the original wind speed data, show that the model is capable of capturing some trends in the wind speed data. However, there are significant deviations at many data points, indicating noticeable prediction errors. The Mean Squared Error (MSE) is 1.002, and the Mean Absolute Error (MAE) is 0.7443, suggesting that the model has certain limitations in capturing the dynamic changes of the wind speed data. The second part of the figure presents a comparison between the prediction values of the GBDT model and the original wind speed data. Compared to the Random Forest model, the GBDT model shows some improvement in prediction for certain segments of the data, but overall, there is still a considerable prediction bias, especially in areas where the wind speed changes sharply. The MSE is 1.0122, and the MAE is 0.7393, which is slightly better than the Random Forest model, but the overall prediction effect is still not ideal. The third part of the figure shows a comparison between the prediction effect of the LSTM model and the original wind speed data. Compared to the first two models, the LSTM model has significantly improved in capturing the dynamic changes of the wind speed data, especially in areas where the wind speed is relatively stable, with the prediction results being close to the original data. The MSE of the LSTM model is 0.3307, and the MAE is 0.4165, indicating that it has a high degree of accuracy and reliability in the task of wind speed prediction. The last part of the chart shows the comparison between the prediction effect of the EMD-LSTM model and the original wind speed data. By introducing Empirical Mode Decomposition (EMD) for preprocessing of the original data, the EMD-LSTM model can more effectively extract the multi-scale features of the wind speed data, significantly improving the prediction accuracy. It can be seen that the model performs well in capturing both sharp and slow changes in wind speed, with the prediction results almost completely matching the original data. The MSE of the EMD-LSTM model is 0.2380, and the MAE is 0.3454, which is significantly better than the other three models, proving the outstanding performance of the EMD-LSTM in the task of wind speed prediction.
Table 2. Modeling performance comparison
Model | MAE | MSE | RMSE | R2 |
RandomForest | 0.7443 | 1.0020 | 1.3903 | 0.7196 |
GBDT | 0.7393 | 1.0122 | 1.3607 | 0.8216 |
LSTM | 0.4165 | 0.3307 | 0.6737 | 0.7858 |
EMD-LSTM | 0.3454 | 0.2380 | 0.4878 | 0.8459 |
By comparing the predictive effects of different models on the test set in Table 2, it can also be concluded that the EMD-LSTM model achieves the optimal prediction effect after completing the process of multi-scale decomposition combined with time series neural networks.
In summary, the LSTM model combined with EMD significantly improves the prediction accuracy by performing multi-scale decomposition and feature extraction on wind speed data, showing the best predictive effect. Comparative analysis indicates that the EMD-LSTM model has a distinct advantage in wind speed prediction tasks for non-stationary time series data.
5. Conclusion
This study proposes a method for wind speed prediction based on Empirical Mode Decomposition (EMD) and Long Short-Term Memory (LSTM) networks for the wind speed data of the F1 Grand Prix. By decomposing the wind speed data with EMD, the complex non-linear and non-stationary time series data is broken down into several Intrinsic Mode Functions (IMFs) with different time scales. Subsequently, the LSTM model is used to predict each IMF component, and the final prediction results are reconstructed to obtain the overall wind speed prediction. To verify the effectiveness of this method, this paper uses actual wind speed data from the F1 Grand Prix from 2018 to 2023 for experiments and compares it with traditional models such as Random Forest, GBDT, and a single LSTM model.
The experimental results show that the wind speed prediction method based on EMD-LSTM is significantly superior to traditional methods in terms of prediction accuracy and stability. Specifically, the EMD-LSTM model can better capture the non-linear and multi-time scale characteristics in complex wind speed data, thereby enhancing the accuracy of the prediction. This study provides a new idea and method for wind speed prediction in the F1 Grand Prix, which has important theoretical significance and application value.
However, there are still some shortcomings in this study. First, although EMD-LSTM performed well on the experimental data, the generalization ability of the model needs further verification in practical applications. Second, this study only considered wind speed as a single variable, and future research could combine more meteorological variables, such as temperature, humidity, and air pressure, to further improve the performance of the prediction model. Finally, the real-time performance and computational efficiency of the model are also issues that need to be considered, especially in the actual competition environment, where it is necessary to ensure that the model can respond quickly and provide accurate prediction results.
In conclusion, the wind speed prediction method based on EMD-LSTM provides an effective solution for the F1 Grand Prix, but it still needs further optimization and verification to better meet the needs of practical applications.
References
[1]. Preosti, E. Data Analysis for Formula 1. Berkeley Scientific Journal 2021, 25, 1-12.
[2]. Al Muharrami, M.S.; Almousa, S.M. Study of Open and Closed Wheels Aerodynamic of Racing Cars in Wind Tunnels with Movable Ground at Different Car Speeds. In Proceedings f the 18th Australasian Fluid Mechanics Conference, Launceston, Australia, 3-7 December 012.
[3]. Abdulwahab, S.F.; Chen, Y. Aerodynamic Evaluation of Racing Wings of a Formula Car. ournal of Applied Mechanics and Materials 2015, 776, 352-356.
[4]. Tan, J.J.; Myler, P.; Tan, W.A. Investigation and Analysis on Racing Car Front Wings. DEStech Transactions on Engineering and Technology Research 2017, 45, 132-138.
[5]. H.; Tian, H.Q.; Chen, C.; Li, Y. A Hybrid Statistical Method to Predict Wind Speed and Wind Power. Renewable Energy 2010, 35, 1857-1861.
[6]. Ye, X.W.; Ding, Y.; Wan, H.P. Machine Learning Approaches for Wind Speed Forecasting Using Long-Term Monitoring Data: A Comparative Study. Smart Structures and Systems 2019, 23, 375-386.
[7]. Younis, A.; Belabbes, F.; Cotfas, P.A.; Cotfas, D.T. Utilizing the Honeybees Mating-Inspired Firefly Algorithm to Extract Parameters of the Wind Speed Weibull Model. Forecasting 2024, 6, 20-30.
[8]. Rangaraj, A.G.; Srinath, Y.; Boopathi, K. Statistical Post-Processing of Numerical Weather Prediction Data Using Distribution-Based Scaling for Wind Energy. Wind Engineering 2024, 48, 145-160.
[9]. Kim, D.; Seomun, G.; Lee, Y.; Cho, H.; Chin, K.; Kim, M.H. Forecasting Building Energy Demand and On-Site Power Generation for Residential Buildings Using Long and Short-Term Memory Method with Transfer Learning. Applied Energy 2024, 343, 121025.
[10]. Cho, D.; Lee, S.; Im, J. Urban Summer Air Temperature Forecasting Through a Fusion of a Numerical Weather. In Handbook of Geospatial Approaches to Environmental Modeling; Springer: Berlin/Heidelberg, Germany, 2024; pp. 245-259.
[11]. Joseph, L.P.; Deo, R.C.; Casillas-Perez, D.; Prasad, R. Multi-Step-Ahead Wind Speed Forecast System: Hybrid Multivariate Decomposition and Feature Selection-Based Gated Additive Tree Ensemble Model. IEEE Transactions on Sustainable Energy 2024, 15, 105-120.
[12]. Ghose, B.; Pandit, P.; Mazumder, C.; Sinha, K. Comparative Study of EMD based Modelling Techniques for Improved Agricultural Price Forecasting. Journal of the Indian Society of Agricultural Statistics 2023, 77, 151432.
Cite this article
Chen,H.;Zhao,E. (2025). Research on wind speed prediction for Formula 1 grand prix based on multi-scale decomposition and time series neural network model. Theoretical and Natural Science,95,8-17.
Data availability
The datasets used and/or analyzed during the current study will be available from the authors upon reasonable request.
Disclaimer/Publisher's Note
The statements, opinions and data contained in all publications are solely those of the individual author(s) and contributor(s) and not of EWA Publishing and/or the editor(s). EWA Publishing and/or the editor(s) disclaim responsibility for any injury to people or property resulting from any ideas, methods, instructions or products referred to in the content.
About volume
Volume title: Proceedings of the 2nd International Conference on Applied Physics and Mathematical Modeling
© 2024 by the author(s). Licensee EWA Publishing, Oxford, UK. This article is an open access article distributed under the terms and
conditions of the Creative Commons Attribution (CC BY) license. Authors who
publish this series agree to the following terms:
1. Authors retain copyright and grant the series right of first publication with the work simultaneously licensed under a Creative Commons
Attribution License that allows others to share the work with an acknowledgment of the work's authorship and initial publication in this
series.
2. Authors are able to enter into separate, additional contractual arrangements for the non-exclusive distribution of the series's published
version of the work (e.g., post it to an institutional repository or publish it in a book), with an acknowledgment of its initial
publication in this series.
3. Authors are permitted and encouraged to post their work online (e.g., in institutional repositories or on their website) prior to and
during the submission process, as it can lead to productive exchanges, as well as earlier and greater citation of published work (See
Open access policy for details).
References
[1]. Preosti, E. Data Analysis for Formula 1. Berkeley Scientific Journal 2021, 25, 1-12.
[2]. Al Muharrami, M.S.; Almousa, S.M. Study of Open and Closed Wheels Aerodynamic of Racing Cars in Wind Tunnels with Movable Ground at Different Car Speeds. In Proceedings f the 18th Australasian Fluid Mechanics Conference, Launceston, Australia, 3-7 December 012.
[3]. Abdulwahab, S.F.; Chen, Y. Aerodynamic Evaluation of Racing Wings of a Formula Car. ournal of Applied Mechanics and Materials 2015, 776, 352-356.
[4]. Tan, J.J.; Myler, P.; Tan, W.A. Investigation and Analysis on Racing Car Front Wings. DEStech Transactions on Engineering and Technology Research 2017, 45, 132-138.
[5]. H.; Tian, H.Q.; Chen, C.; Li, Y. A Hybrid Statistical Method to Predict Wind Speed and Wind Power. Renewable Energy 2010, 35, 1857-1861.
[6]. Ye, X.W.; Ding, Y.; Wan, H.P. Machine Learning Approaches for Wind Speed Forecasting Using Long-Term Monitoring Data: A Comparative Study. Smart Structures and Systems 2019, 23, 375-386.
[7]. Younis, A.; Belabbes, F.; Cotfas, P.A.; Cotfas, D.T. Utilizing the Honeybees Mating-Inspired Firefly Algorithm to Extract Parameters of the Wind Speed Weibull Model. Forecasting 2024, 6, 20-30.
[8]. Rangaraj, A.G.; Srinath, Y.; Boopathi, K. Statistical Post-Processing of Numerical Weather Prediction Data Using Distribution-Based Scaling for Wind Energy. Wind Engineering 2024, 48, 145-160.
[9]. Kim, D.; Seomun, G.; Lee, Y.; Cho, H.; Chin, K.; Kim, M.H. Forecasting Building Energy Demand and On-Site Power Generation for Residential Buildings Using Long and Short-Term Memory Method with Transfer Learning. Applied Energy 2024, 343, 121025.
[10]. Cho, D.; Lee, S.; Im, J. Urban Summer Air Temperature Forecasting Through a Fusion of a Numerical Weather. In Handbook of Geospatial Approaches to Environmental Modeling; Springer: Berlin/Heidelberg, Germany, 2024; pp. 245-259.
[11]. Joseph, L.P.; Deo, R.C.; Casillas-Perez, D.; Prasad, R. Multi-Step-Ahead Wind Speed Forecast System: Hybrid Multivariate Decomposition and Feature Selection-Based Gated Additive Tree Ensemble Model. IEEE Transactions on Sustainable Energy 2024, 15, 105-120.
[12]. Ghose, B.; Pandit, P.; Mazumder, C.; Sinha, K. Comparative Study of EMD based Modelling Techniques for Improved Agricultural Price Forecasting. Journal of the Indian Society of Agricultural Statistics 2023, 77, 151432.