


1. Introduction
Social networks have become a prominent part of modern society, existing in every aspect of people’s lives [1,2]. There are billions of users on platforms like Facebook, Twitter and Instagram, which forms sophisticated networks where information and thoughts are spread rapidly. Analyzing these social networks can offer a useful approach to investigate aspects like, human behavior, information dissemination and community formation. Celebrities, for example, can be advantageous for businesses to promote their goods and services more efficaciously during marketing campaigns [3]. Additionally, social network analysis gives people access to understanding how diseases spread among individuals [4]. Public health official can predict the spread of contagious diseases and implement targeted prevention policies, by investigating the probability of one person to infect another one [5,6].
The primary objective of this research is to incorporate Maximum Likelihood Estimation (MLE) to estimate the connection probability parameter \( p \) for Erdős–Rényi graph in social network analysis [7,8]. The Erdős–Rényi graph provides a mathematical framework to visualize the structure and model social networks, and obtaining the estimation of \( p \) is vital in understanding the network’s structure and behavior. The research is significant, since it offers an efficient method for analyzing social networks, which may substantially assist in making decisions in various fields, like business, public health and so on.
2. Theoretical Foundations
2.1. Erdős–Rényi Graph Models: Mechanisms and Properties
The Erdős–Rényi graph, which is named after mathematicians Paul Erdős and Alfred Rényi, is a random graph model, specializing in analyzing the structure and behavior of social networks. There are two basic forms of expression which are \( G (n, m) \) and \( G (n, p) \) respectively and the \( G (n, p) \) is the focus of the study, consisting of \( n \) nodes. In this model, each pair of nodes is connected by an edge with a probability \( p \) . To exemplify, if a social network is expressed as a \( G (n, p) \) graph with \( n=40 \) and \( p=0. \) 3, it means that the average probability of each person getting connected to another person in the network of 40 individuals is 30%. With the help of Python program, three visualizations are presented below given that \( n=40 \) but different parameters p.
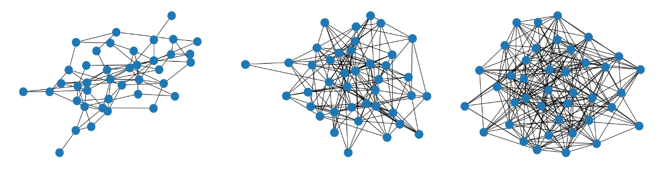
Figure 1: Three visualizations presented below given that n=40 but different parameters p. (Picture credit : Original)
As shown in Figure 1, from left to right, parameter p increases from 0.1 to 0.2 to 0.3, leading to a continuous increase in density of connections which are represented by black lines between blue nodes. Blue nodes represent 40 individuals in total which are randomly distributed every single time on the plane [9].
For a graph with N nodes, it can be mathematically represented by an N*N adjacency matrix denoted by X. For two nodes i and j, the element \( {X_{ij}} \) is situation of connection. \( {X_{ij}} \) is either 1 or 0, since there are only two options which are being connected or not being connected. In simple terms, element \( {X_{ij}} \) follows Bernoulli distribution and the adjacency matrix obeys the rules:
\( P({X_{ij}}=1)=p \) (1)
\( P({X_{ij}}=0)=1-p \) (2)
The probability density function of the entire graph can be expressed as:
\( {f_{X}}(x;p)=\prod _{i=1}^{N} \prod _{j=1}^{N} {p^{{x_{ij}}}}(1-p{)^{1-{x_{ij}}}} \) (3)
2.2. Maximum Likelihood Estimation: Principles and Derivation
Maximum Likelihood Estimation is a powerful statistical method for parameter estimation. Given a set of independent and identically distributed observed data \( {x_{1}},{x_{2}},…,{x_{n}} \) from a probability distribution \( {f_{X}}(x;p) \) with parameter \( θ \) , the likelihood function is derived as:
\( L(θ;x)=\prod _{j=1}^{n}f({x_{i}};θ) \) (4)
2.3. Derivation of MLE for Erdős–Rényi Graphs
However, if directly deal with the probability mass function, it might be computationally difficult. Therefore, taking logarithm of the function successfully turns a product to a sum, which is a lot easier to perform subsequent calculations. The log-likelihood function is defined as [10]:
\( logL(p|X)=\sum _{i=1}^{N} \sum _{j=1}^{N} \lbrace {x_{ij}}logp+(1-{x_{ij}})log(1-p)\rbrace \) (5)
In order to figure out the maximum of the log-likelihood function, taking the derivative with respect to \( p \) is necessary. Using rules of differentiation, derivative is expressed as:
\( \frac{d}{dp}logL(p|x)=\frac{d}{dp}\lbrace \sum _{i=1}^{N} \sum _{j=1}^{N} \lbrace {x_{ij}}logp+(1-{x_{ij}})log(1-p)\rbrace \rbrace =\sum _{i=1}^{N} \sum _{j=1}^{N} (\frac{{x_{ij}}}{p}-\frac{1-{x_{ij}}}{1-p}) \) (6)
Then, set the derivative equal to zero to find the maximum estimation of \( p \) :
Let \( S=\sum _{i=1}^{N} \sum _{j=1}^{N} {x_{ij}} \) , which represents the total number of edges meaning connections between individuals. Substituting S into the equation and perform several algebraic manipulations, it becomes:
\( \frac{S}{p}-\frac{{N^{2}}-S}{1-p}=0 \) (7)
\( (1-p)S-p({N^{2}}-S)=0 \) (8)
\( S-Sp-{N^{2}}p+Sp=0 \) (9)
\( S={N^{2}}p \) (10)
Therefore, the estimation of probability can be written as:
\( {\hat{p}_{ML}}=\frac{S}{{N^{2}}}=\frac{1}{{N^{2}}}\sum _{i=1}^{N} \sum _{j=1}^{N} {x_{ij}} \) (11)
The \( {\hat{p}_{ML}} \) is the maximum-likelihood estimation of the connection probability \( p \) in the Erdős–Rényi graph.
3. Application Analysis in MLE for Erdős–Rényi
3.1. Case Study
Having comprehensively delved into the theoretical basis, a connection between theory and a real-world scenario is indispensable, since the true value of a theoretical framework lies in its ability and to be applied and tested under practical backgrounds [11]. An appropriate practical instance is related to a virus transmission within a city during the epidemic. Suppose the study monitors 500 individuals who are infected or in close contact to the infected.
For each pair of individuals, if there is evidence of a risky contact that could potentially lead to virus transmission, a connection is established between them. These relationships are manipulated in a 500*500 adjacency matrix, where a value of 1 at position \( (i,j) \) indicates a potential transmission link between individual \( i \) and \( j \) , and 0 indicates no such link.
The Maximum Likelihood Estimation (MLE) approach is incorporated to calculated the connection probability \( {\hat{p}_{ML}} \) . After carefully counting all the potential transmission links, the total number of potential transmission edges S = 6000, Then:
\( {\hat{p}_{ML}}=\frac{s}{{N^{2}}}=\frac{6000}{{500^{2}}} \) (12)
3.2. Accuracy exploration
After incorporating such an approach to a real-world case, the accuracy of this methodology is focused on. In this study, the relationship between the value of N which represents the total number of nodes and the percentage error [12]. Here, percentage error is defined as the absolute value of the difference between the estimated connection probability ( \( {\hat{p}_{ML}} \) ) obtained via the Maximum Likelihood Estimation methodology and the true connection probability, relative to the true connection probability \( (p) \)
Percentage error = \( |\frac{{\hat{p}_{ML}}-p}{p}|×100\% \) (13)
To further investigate the relationship, set N to a great variety of values from 50 to 600 at the interval of 50, visualizing the trend clearly. Multiple parameters \( p \) ranging from 0.1 to 0.9 are chosen to construct the image. The number of simulations under the context of each N value and each parameter \( p \) is set highly to 1500, so that average percentage error can be figured out, enhancing the reliability of the result. Though utilization of python program, the relationship between N and average percentage error is illustrated as a graph:
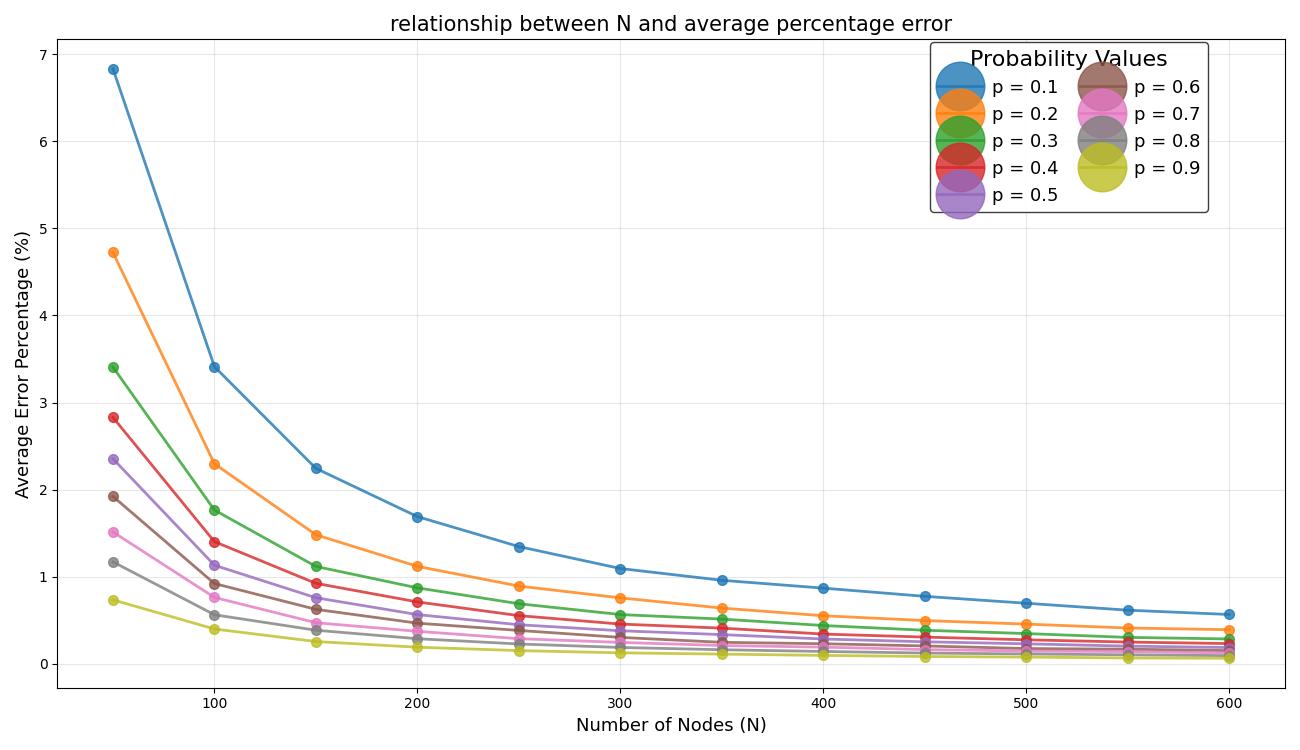
Figure 2: Relationship between N and average percentage error. (Picture credit : Original)
As shown in Figure 2, the graph is drawn by linking the dots which represent the average error percentage under a specific parameter and the relationship is visualized by colorful lines. After multiple trials of code execution, there is a consistent trend showing that the percentage error falls with the increase in number of nodes under all parameter values. This suggests that the methodology's error minimizes if N is a huge number, which simultaneously gives us some valuable insights that should guarantee that N is large enough when utilizing this approach to avoid significant errors.
4. Advantages and disadvantages
4.1. Advantages
The most conspicuous superiority is the simplicity. The concept of Maximum Likelihood Estimation is relatively straight forward, and the calculation of \( {\hat{P}_{ML}} \) is computationally efficient. This gives researchers and practitioners access to different levels of mathematical and computational expertise. For instance, a social scientist with basic statistical knowledge can easily understand and apply Maximum Likelihood Estimation to analyze social network data
The second upside worthing mentioning is the statistical rigor. Maximum Likelihood Estimation provides a powerful statistical framework for parameter estimation and it possesses several desirable properties in Statistics, such as consistency and asymptotic normality. Consistency means that as sample size expands, the estimation \( {\hat{p}_{ML}} \) tends to infinitely approach the actual probability. Asymptotic normality implies that the distribution of \( {\hat{p}_{ML}} \) for a large sample size could be approximately regarded as the normal distribution, which is conducive to statistical inference.
4.2. Disadvantages
The first downside is the assumption of uniform connection probability. The Erdős–Rényi graph model assumes a uniform connection probability between all pairs of nodes, which in fact is impossible. In real-world social networks, the connection probability will definitely be affected by other factors instead uniform. For example, when it comes to a case about friendship, the probability of any two students to cultivate friendship is never supposed to be uniform in practice, since elements such as age, hobby and personality are not taken into account. To be more specific, an extroverted possesses a stronger tendency to make friends with those who are extroverted. Hence, this assumption causes estimated \( {\hat{p}_{ML}} \) to deviate substantially from the true connection probability in different networks.
Another drawback is the limitation of the static model. The Erdős–Rényi Graph is static, while social networks are dynamic, meaning that nodes and edges may change overtime in real world. Continuing with that friendship example, it is entirely possible for new friendships to form and existing friendship to vanish. The current models and Maximum Likelihood Estimation have nothing to do with these dynamic alterations, confining the effectiveness in analyzing dynamic social network. Therefore, the insights obtained from a static model may not comprehensively analyze the social network, especially in the long term.
5. Future research directions
A promising future research direction is to incorporate age and personality factors into social network analysis, especially when studying friendships, since these factors will greatly influence a person’s friend making choice.
Take a school as an example, the students' ages will potentially divide them into different age groups. More specifically, younger students tend to form friendships more easily with those in the same grade since they have similar classes and daily schedules. When it comes to personality, outgoing students are often more likely to make friends quickly at school events, while introverted students may form closer connection with quieter classmates.
Mathematically, new elements can be added to the Erdős–Rényi graph model. The connection probability p as a function \( p(a1, a2, per1, per2) \) . Here, \( a1 \) and \( a2 \) are the ages of two people and \( per1 \) and \( per2 \) stand for their personalities. This new function can show how likely two people are to become friends based on their ages and personalities which can be directly added to the previous model. Therefore, the model is optimized by adding more functions and manages to give a more holistic result in a real-world scenario [13]. The model is further optimized by incorporating additional factors like shared hobbies; for example, a mutual interest in playing basketball can increase the likelihood of friendship. This approach not only aids in understanding how friendship social networks develop but can also be utilized in schools to arrange activities that foster friendships and in social apps to refine friend recommendation systems. Future research might explore advanced visualization techniques to better understand the structure and dynamics of social networks. Visualization plays a crucial role in revealing hidden patterns from data and presenting results clearly. Interactive visualizations could allow users to delve into network structures and observe changes over time, while 3D visualizations might offer a more comprehensive view of large-scale social networks.
6. Conclusion
In this essay, it is discovered that the use of Maximum Likelihood Estimation (MLE) incorporated in the Erdős–Rényi graph model is an effective approach to estimate connection probabilities in social networks. Besides, the Maximum Likelihood Estimation formula for the Erdős–Rényi model is derived and applied to a real-world scenario about the virus transmission.
A major focus of this study is to examine accuracy. Extensive simulations are performed to see how the average percentage error changes in response to sample size changes. The results clearly show that when the number of nodes grows, the percentage error in estimating the connection probability consistently decreases, which proves that Maximum Likelihood Estimation works the most accurately for large sized networks. Furthermore, the visual graph, showing the relationship between the number of nodes and average percentage error, produced by utilizing python program clearly display this trend, which confirms that larger networks lead to better estimation accuracy.
In terms of advantages, the strength of MLE lies in its simplicity and ease of use with large data sets. The method uses an adjacency matrix, where each entry indicates whether a connection between two nodes exists, with the connections following a simple probability rule. This straightforward approach makes it accessible to researchers in many fields, even those who are not experts in advanced statistics.
References
[1]. Lambert, J., Barnstable, G., Minter, E., Cooper, J., & McEwan, D. (2022). Taking a one-week break from social media improves well-being, depression, and anxiety: A randomized controlled trial. Cyberpsychology, Behavior, and Social Networking, 25(6), 287–293.
[2]. Vanden Abeele, M. M. P., & Nguyen, M. H. (2024). Digital media as ambiguous goods: Examining the digital well-being experiences and disconnection practices of Belgian adults. European Journal of Communication, 39(1), 122–144.
[3]. Maganioti, A.E., Chrissanthi, H.D., Charalabos, P.C., Andreas, R.D., George, P.N. and Christos, C.N. (2010) Cointegration of Event-Related Potential (ERP) Signals in Experiments with Different Electromagnetic Field (EMF) Conditions. Health, 2, 400-406.
[4]. Zhu, X., Liu, Z., Cambria, E., Yu, X., Fan, X., Chen, H., & Wang, R. (2025). A client–server based recognition system: Non-contact single/multiple emotional and behavioral state assessment methods. Computer Methods and Programs in Biomedicine, 260, 108564.
[5]. Wang, R., Zhu, J., Wang, S., Wang, T., Huang, J., & Zhu, X. (2024). Multi-modal emotion recognition using tensor decomposition fusion and self-supervised multi-tasking. International Journal of Multimedia Information Retrieval, 13(4), 39.
[6]. Bootorabi, F., Haapasalo, J., Smith, E., Haapasalo, H. and Parkkila, S. (2011) Carbonic Anhydrase VII—A Potential Prognostic Marker in Gliomas. Health, 3, 6-12.
[7]. Koonin LM, Bialek S, et al. (2022). Building a New Generation of Public Health Leaders Forged in a Pandemic. JAMA Network Open, 5(5), e2213677.
[8]. Glendinning, I. (2013). Comparison of policies for academic integrity in higher education across the European Union.
[9]. Peng, P., Qu, L., Wang, Q., Wang, S., & Yan, T. (2025). Maximum likelihood estimation in the sparse Rasch model. arXiv preprint arXiv:2501.07770.De Ayala, R. J. (2019). The Rasch model in educational assessment: A primer. Measurement: Interdisciplinary Research and Perspectives, 17(2), 105-118.
[10]. Tarima, S., & Flournoy, N. (2019). Asymptotic properties of maximum likelihood estimators with sample size recalculation. Statistical Papers, 60(2), 373-394.
[11]. Wang, F., Ju, M., Zhu, X., Zhu, Q., Wang, H., Qian, C., & Wang, R. (2025). A Geometric algebra-enhanced network for skin lesion detection with diagnostic prior. The Journal of Supercomputing, 81(1), 1-24.
[12]. Zhao, Z., Zhu, X., Wei, X., Wang, X., & Zuo, J. (2021, June). Application of Workflow Technology in the Integrated Management Platform of Smart Park. In 2021 IEEE 4th Advanced Information Management, Communicates, Electronic and Automation Control Conference (IMCEC) (Vol. 4, pp. 1433-1437). IEEE.
[13]. Zhang, Y., Zhao, H., Zhu, X., Zhao, Z., & Zuo, J. (2019, October). Strain Measurement Quantization Technology based on DAS System. In 2019 IEEE 3rd Advanced Information Management, Communicates, Electronic and Automation Control Conference (IMCEC) (pp. 214-218). IEEE
Cite this article
Tao,C. (2025). Optimal Inference of Social Network Structure: A Maximum Likelihood Framework for Erdős–Rényi Models. Theoretical and Natural Science,100,164-170.
Data availability
The datasets used and/or analyzed during the current study will be available from the authors upon reasonable request.
Disclaimer/Publisher's Note
The statements, opinions and data contained in all publications are solely those of the individual author(s) and contributor(s) and not of EWA Publishing and/or the editor(s). EWA Publishing and/or the editor(s) disclaim responsibility for any injury to people or property resulting from any ideas, methods, instructions or products referred to in the content.
About volume
Volume title: Proceedings of the 3rd International Conference on Mathematical Physics and Computational Simulation
© 2024 by the author(s). Licensee EWA Publishing, Oxford, UK. This article is an open access article distributed under the terms and
conditions of the Creative Commons Attribution (CC BY) license. Authors who
publish this series agree to the following terms:
1. Authors retain copyright and grant the series right of first publication with the work simultaneously licensed under a Creative Commons
Attribution License that allows others to share the work with an acknowledgment of the work's authorship and initial publication in this
series.
2. Authors are able to enter into separate, additional contractual arrangements for the non-exclusive distribution of the series's published
version of the work (e.g., post it to an institutional repository or publish it in a book), with an acknowledgment of its initial
publication in this series.
3. Authors are permitted and encouraged to post their work online (e.g., in institutional repositories or on their website) prior to and
during the submission process, as it can lead to productive exchanges, as well as earlier and greater citation of published work (See
Open access policy for details).
References
[1]. Lambert, J., Barnstable, G., Minter, E., Cooper, J., & McEwan, D. (2022). Taking a one-week break from social media improves well-being, depression, and anxiety: A randomized controlled trial. Cyberpsychology, Behavior, and Social Networking, 25(6), 287–293.
[2]. Vanden Abeele, M. M. P., & Nguyen, M. H. (2024). Digital media as ambiguous goods: Examining the digital well-being experiences and disconnection practices of Belgian adults. European Journal of Communication, 39(1), 122–144.
[3]. Maganioti, A.E., Chrissanthi, H.D., Charalabos, P.C., Andreas, R.D., George, P.N. and Christos, C.N. (2010) Cointegration of Event-Related Potential (ERP) Signals in Experiments with Different Electromagnetic Field (EMF) Conditions. Health, 2, 400-406.
[4]. Zhu, X., Liu, Z., Cambria, E., Yu, X., Fan, X., Chen, H., & Wang, R. (2025). A client–server based recognition system: Non-contact single/multiple emotional and behavioral state assessment methods. Computer Methods and Programs in Biomedicine, 260, 108564.
[5]. Wang, R., Zhu, J., Wang, S., Wang, T., Huang, J., & Zhu, X. (2024). Multi-modal emotion recognition using tensor decomposition fusion and self-supervised multi-tasking. International Journal of Multimedia Information Retrieval, 13(4), 39.
[6]. Bootorabi, F., Haapasalo, J., Smith, E., Haapasalo, H. and Parkkila, S. (2011) Carbonic Anhydrase VII—A Potential Prognostic Marker in Gliomas. Health, 3, 6-12.
[7]. Koonin LM, Bialek S, et al. (2022). Building a New Generation of Public Health Leaders Forged in a Pandemic. JAMA Network Open, 5(5), e2213677.
[8]. Glendinning, I. (2013). Comparison of policies for academic integrity in higher education across the European Union.
[9]. Peng, P., Qu, L., Wang, Q., Wang, S., & Yan, T. (2025). Maximum likelihood estimation in the sparse Rasch model. arXiv preprint arXiv:2501.07770.De Ayala, R. J. (2019). The Rasch model in educational assessment: A primer. Measurement: Interdisciplinary Research and Perspectives, 17(2), 105-118.
[10]. Tarima, S., & Flournoy, N. (2019). Asymptotic properties of maximum likelihood estimators with sample size recalculation. Statistical Papers, 60(2), 373-394.
[11]. Wang, F., Ju, M., Zhu, X., Zhu, Q., Wang, H., Qian, C., & Wang, R. (2025). A Geometric algebra-enhanced network for skin lesion detection with diagnostic prior. The Journal of Supercomputing, 81(1), 1-24.
[12]. Zhao, Z., Zhu, X., Wei, X., Wang, X., & Zuo, J. (2021, June). Application of Workflow Technology in the Integrated Management Platform of Smart Park. In 2021 IEEE 4th Advanced Information Management, Communicates, Electronic and Automation Control Conference (IMCEC) (Vol. 4, pp. 1433-1437). IEEE.
[13]. Zhang, Y., Zhao, H., Zhu, X., Zhao, Z., & Zuo, J. (2019, October). Strain Measurement Quantization Technology based on DAS System. In 2019 IEEE 3rd Advanced Information Management, Communicates, Electronic and Automation Control Conference (IMCEC) (pp. 214-218). IEEE