


1. Introduction
A group is an ordered pair (Z, ∗) where Z is a set and ∗ is a binary operation on Z satisfying the following axioms:
(p ∗ q) ∗ r = p ∗ (q ∗ r), for all a, b, c ∈ Z
(ii) all e ∈ Z such that for all p ∈ Z we have p ∗ e = e ∗ p = p
(iii) for each p ∈ Z, p−1∈ Z such that p ∗ p−1 = p −1 ∗ p = e
Given a group Z of Z and a subset S of Z, the Cayley graph Cay (Z, S) is an undirected graph where the set of vertices Z and the set of edges contain an edge from Z to sz and an edge from Z to s-1z. When z ∈ Z and s ∈ S, the edges from Z → sz and S→ s-1z are the same if | z | = 2, that gives us an edge. An undirected, linked, acyclic graph is called a tree. In Z, every pair of vertices has a different path. E(Z) = V(Z) -1 represents the (N−1) edges that make up a tree with N vertices [1-3].
Group actions are shown geometrically in Cayley graphs. We will review the essential basic knowledge of group and graph theory to investigate this fully. Although Cayley graphs are commonly employed to depict the abstract structure of a group in graph form, we will mainly concentrate on Cayley graphs rather than Cayley digraphs with directed edges. A Cayley graph is an illustration of a group that is created with a collection of generators that specify the composition and functions of the group. Using these generators illustrates how the group's members interact. Cayley graphs show the group structure and the relationships between the members under group operations. The Cayley type of graphic is the source of Cayley graphs. Cayley color diagrams, first introduced by Arthur Cayley in 1878, are the source of Cayley graphs. Its formulation is based on the Cayley theorem, which states that every group G is isomorphic to a subgroup of the symmetric group acting on Z, Sym (Z). Finds a directed graph, also known as a Cayley graph, for each finite group G and generating set Φ. In essence, the generator set selection determines its structure. The Cayley graph is a key tool for fusing group theory and graph theory because it can turn abstract groups into visible graphs. They visually capture the essence of a group by mapping its structure and relationships based on its generators. Cayley graphs are a powerful tool for understanding and analyzing group properties in various mathematical and scientific contexts. Take into consideration the Z6 group of integers under addition, modulo 6. The elements of this group are {0,1,2,3,4,5}. The Cayley graph for \( {Z_{6}} \) would have 6 vertices, each labeled by these integers. An edge between vertices g and h would be labeled by \( {h^{-g}} \) mod 6 [4-6].
2. Symmetry and regularity of graphs
Let Γ be a simple finite graph (V, E). If each vertex of a graph Γ has a degree of k, it is considered a k-regular graph. Otherwise, it is considered a regular graph of degree k. When a regular graph has degree 3, it is called a cubic graph. The automorphism expressed by σ is a permutation of the set of vertices of the graph Γ, such that if and only if {σ(u), σ(v)} is an edge of Γ, then {u, v} is an edge of Γ. If an automorphism σ(u) = v exists for any two vertices u and v of Γ, the graph Γ is marked as a vertex-transitive graph. Each vertex-transitive graph is a regular graph. However, it is important to note the distinction between regular and transitive graphs. As Figure 1 shows, Frucht graphs, for example, are not transitive. An automorphism σ(Γ) mapping x to y occurs for any pair of edges x and y of Γ. In this case, Γ is a transitive edge graph. The two qualities are not interchangeable because these symmetry properties show that every vertex and edge on the Γ graph looks the same. As the edges {u, v} and {u’, v’} are not automorphic, Γ in Figure 2 is transitive instead of transitive. An example of a non-vertex-transitive edge graph is a complete bipartite graph Kp,q, where p ≠ q. [5,7-10].

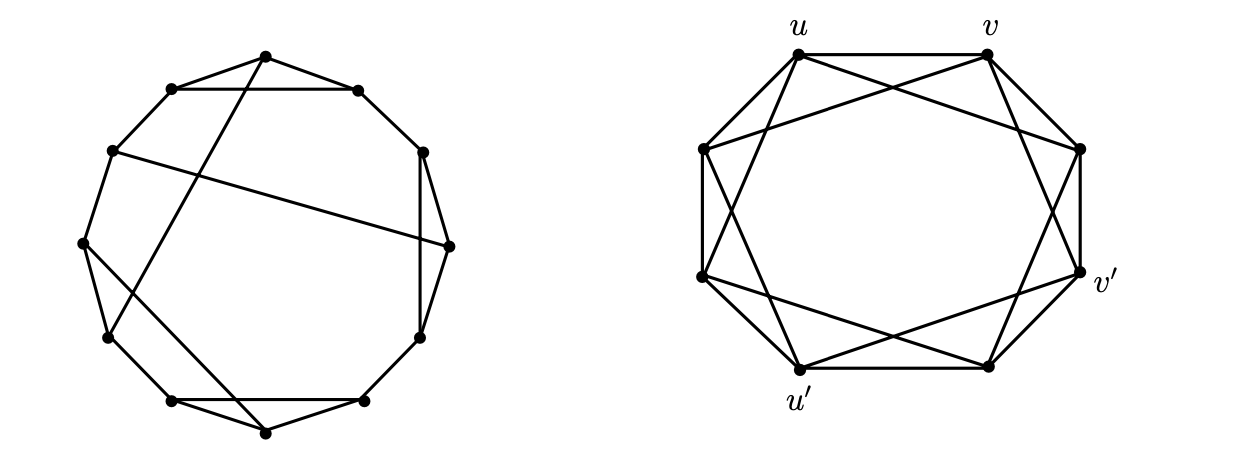
Figure 1: Frucht graph 1 Figure 2: Frucht graph 2
The Frucht graph: A cubic graph with 12 vertices, 18 edges, and no nontrivial symmetries is known as a Frucht graph in graph theory. Frucht graphs are regular but not vertex-transitive; A graph Γ in which vertices pass but not edges [11].
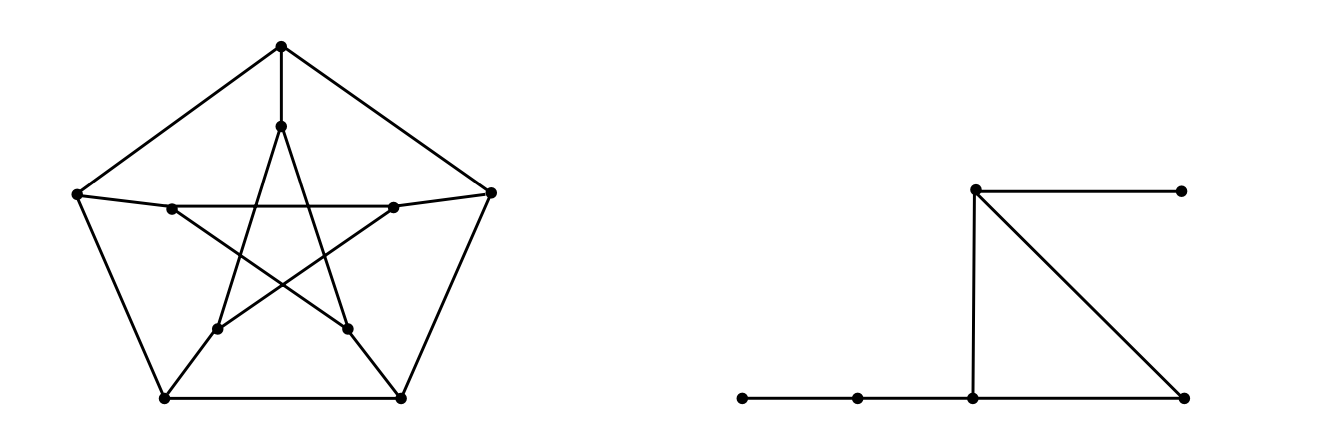
Figure 3: The petersen graph
An undirected graph with ten vertices and fifteen edges is known as a Petersen graph in graph theory. The graph Γ for passing neither vertices nor edges and the Petersen graph for passing both vertices and edges are depicted in Figure 3 [8].
3. Atom tracking using cayley graphs
Cayley graphs can represent molecules where vertices correspond to atoms and edges represent bonds between them. By analyzing these graphs, one can track how atoms are connected and how these connections change in various chemical reactions or structural transformations.
Directed and undirected graphs can have labels on either vertices or edges. From a chemical perspective, referring to undirected labeled graphs as molecules is often more intuitive. In this case, the vertex represents the atom and the label represents the atom type. Edges represent keys, and labels distinguish single, double, triple, and aromatic keys. Despite this chemical framework, using standard graph terminology in mathematical descriptions is more accurate.
The structure of molecules can be likened to undirected labeled graphs, which allows us to view chemical reactions as transformations of these graphs. This approach involves transforming a set of initial graphics (educts) into a new set of graphs (products) using the double pushout (DPO) method. To fully understand the DPO approach and its variations. In this case, the DPO will specifically outline how chemical reactions can be modeled as rules within the framework of the DPO. This involves considering a rule, expressed as p, which describes the transformation of graph Z to graph H, expressed as Z \( \unknownGroupChar8658{p} \) H. In our setup, p represents the chemical mechanism, Z \( \unknownGroupChar8658{p} \) H represents the reaction, and G and H linking components represent the molecules that are converted from reactants to products in the reaction. The number of atoms in the starting material (extract) and the reaction product must be the same. This means that the number of vertices in the graph representing the starting material (Z) must be the same as the number of vertices in the graph representing the product (H), expressed as |V(Z)| = |V(H)|. We can create a one-to-one mapping or bijection, denoted φ: V(Z)→V(H), to show where the vertices of Z can be found in H after a graph transformation Z \( \unknownGroupChar8658{p} \) H. It is important to note that only vertices with the same label can map to each other. The mapping φ is not unique, and there can be several different mappings for a given graph transformation. We use tr(Z \( \unknownGroupChar8658{p} \) H) to represent all such mappings. Each edge (e+, e-) is a pair of subsets of vertices in a directed hypergraph. We represent it by letting Ye = e+ ∪ e-, which is the set of vertices contained in the starting vertex e+ and the ending vertex e- of the edge e. A chemical network (CN) is a hypergraph where each vertex represents a molecule, and each super edge represents a chemical reaction. In this case, each hyperedge e of CN corresponds to a set of direct transformations that convert the input vertices of the hyperedge to the output vertices. For a given set of sides E of CN, D is the set of all direct Sp derivatives obtained by E. Then, \( tr \) (E) = \( \bigcup _{Z\unknownGroupChar8658{p}H∈D}tr(Z\unknownGroupChar8658{p}H) \) and \( tr \) (CN) = \( tr \) (E(CN) [7,12,13]
4. Hamiltonian path in cayley graphs
A path in Γ that visits each vertex precisely once is called a Hamiltonian path, and a closed Hamiltonian path is called a Hamiltonian cycle. It has been conjectured that every Cayley graph is Hamiltonian. Interest in this and other closely related questions has grown in recent years. Finding Hamiltonian cycles in graphs is a challenging task. We surveyed several results and then found three theories about the specific conditions under which the Cayley graph is Hamiltonian [9].
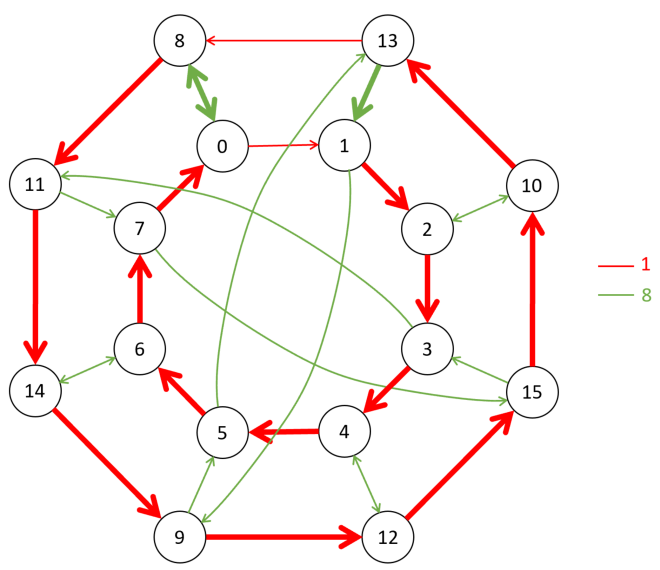
Figure 4: Cayley graph with vertices and directed edges (corresponding to elements of a group and their generators)
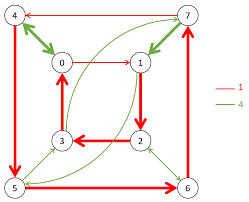
Figure 5: Another example
Figure 4 represents a Cayley graph with vertices and directed edges corresponding to elements of a group and their generators. The red arrows denote one generator (labeled “1”), and the green arrows denote another generator (labeled “8”). This graph illustrates the relationships between group elements when acted on by these generators.
Figure 5 is similar but simpler, with fewer vertices and arrows representing a different group or generating set. Here, the generators appear to be “1” (red) and “4” (green), and it shows how elements of the group are connected through these generators.
4.1. Theorem 1
As Pak and Radoičić mentioned, a Hamiltonian cycle can be found in the appropriate Cayley graph Γ (Z, S) for every finite group Z of size |Z| ≥ 3 if its generating set S has a size of |S| < \( {log_{2}}{|Z|} \) .
The claim that most, if not all, Cayley graphs of finite groups are Hamiltonian graphs cannot be proven. Nevertheless, Theorem 1 establishes the existence of a Hamilton Cayley graph with a generated set of modest dimensions for any finite group G. This demonstration is based on a corollary to the classification of finite simple groups and an explicit combinatorial construction.
For the other results, if Z is allowed to be a finite group and S to be a symmetrical generating set, a Cayley graph γ = γ (Z, S) is defined as a graph with vertices z ∈ Z, and edges (Z, zs), (Z, z \( {s^{-1}} \) )) ∈ Z 2, where s ∈ S. Obviously, γ is d-regular, where d = \( |S| \) . And then we can only consider Cayley's graphs. For a finite group G, let n(Z) be the number of constituent factors of G. h(Z) and k(Z) represent, respectively, the number of Abelian and non-abelian constituent factors. Obviously, n(Z) = h(Z) + k(Z) [8,14-17].
4.2. Theorem 2
According to Pak and Radoičić, in the finite group Z, n(Z), and l(Z), as defined above, there exists a generator set S, |S| ≤ n(Z) + 2l(Z). The set S corresponds to a Cayley graph Γ (Z, S) containing a Hamiltonian path.
We label ∂X as the set of vertices v ∈ Z−X connected to X by an edge, for any subset of vertices X∧Z. If the total number of vertices in a subset X is half or less of the total number of vertices in Z, then the graph is considered an ε-expander. We have the property that for some fixed ε > 0 the magnitude of the boundary of X (denoted by |∂X|) is greater than ε times the magnitude of X (denoted by |X|).
Let's consider a prime number p, which has the property of being congruent to 1 modulo 4. We have a finite field, denoted as Fp, which contains p elements. In this field, an element 'a' exists such that a2 = -1.
We can look at the group SL(2,p), which consists of 2×2 matrices over Fp with determinant equal to 1. Additionally, we have the quotient group denoted as PSL (2,p), obtained by dividing SL(2,p) by the subgroup of diagonal matrices {±1}. For the elements α, β, γ in PSL (2,p), we can represent them using matrices: α= , β=, γ=
These elements form group Z: PSL (2, p) = < α, β, γ >. We can verify that α²= β²= γ²= 1. Now consider the Cayley graph Γp =Γ(PSL (2, p),{α, β, γ}) [8,14,15].
4.3. Theorem 3
As Pak and Radoičić (2009) said, the diagram of Cayleys Γp is an ε-expander for ε > 0, and by definition, it has a Hamiltonian cycle, regardless of the prime p 1 mod 4 [14].
4.4. Proof of theorem 1
Assuming that G is a complicated series, let n = n(Z) and l= l(Z). Make use of Kr, L₁, and... The Abelian and non-Abelian parts of G are represented by Lm. Observe that |Lj| ≥ 60 > 4. We've got: 2n+2l= 2n4l \( \prod _{i=1}^{n}| \) Ki| \( ∙\prod _{j=1}^{l}| \) Lj| = |Z|. Therefore, n(Z)+2l(Z)≤log 2 |Z|, only when. In the case of n greater than or equal to 2, a simple inductive argument can help us find the Hamiltonian cycle. In other cases, the construct set can have an extra group element that joins the Hamiltonian path's ends. The proof is finished with this addition, which supplies the necessary Hamiltonian cycle.
4.5. Proof of theorem 2
The property that arises from categorizing finite simple groups is that two components, at least one of which is involutory, can construct any non-abelian finite simple group. For any simple non-abelian finite group for the Cayley graph corresponding to a Hamiltonian cycle, a set of S generation is created. In the case where group G is cyclical (Z = Zp), a generator suffices. The subsequent fundamental reduction is necessary [15].
4.6. Proof of theorem 3
For matrices A and B belonging to SL (2, p), we denote A =±B to represent that these elements map to the same elements in PSL (2, p). For matrices α, β, and γ, note the following:
α²= γ²== ±, β² = ±
α β=, β α== ±α β,
γ α== ±, β γ α β= ±.
The initial line indicates that in PSL(2, p), α, β, and γ are directed downwards. The second line demonstrates how PSL(2, p) modifies α and β. Therefore, lemma 1 implies that the Cayley graph Γp = Γ (PSL(2, p), {α, β, γ}) contains a Hamiltonian cycle. Finally, the third line suggests a basic transition.
, , ,
You can get words of up to 4 lengths in α, β, γ. It is shown that Γep = Γ in the Cayley diagram [14,15,18].
5. Derivative process of structure of alkane
To demonstrate that a molecule with the structure CnH2n+2 (alkane) can be represented as a tree, we can use the following approach:
The number of vertices in a CnH2n+2 molecule is given by n + (2n+2), which simplifies to 3n+2. For alkanes, where each carbon atom has 4 bonds and each hydrogen atom forms 1 bond, we can consider a graph G to represent the alkane molecule. This graph, G, will have 3n + 2 vertices and 3n + 1 edges.
V(Z) = 3n+2
E(Z) = ½ ∑n(Vi)
= ½ (n(C) + n(H))
= ½ (n.4 + (2n+2).1)
= (4n + 2n + 2)/2
= 3n + 1
Thus, V (Z) -1 = E (Z). In graph theory, trees can be used to depict the structure of the alkane CnH2n+2. Chemical parameters can be disregarded for determining the number of isomers since they have no bearing on the outcome. Chemical problems can be successfully solved using graph theory, particularly tree theory, which is particularly useful for identifying the isomers of alkanes. Compounds with distinct structures but the same molecular formula are known as isomers. As only structural factors are taken into account in graph theory, counting the number of alkane isomers is made simpler. It's not easy to describe or simulate chemicals, particularly alkanes [19,20].
6. Examples of representation
In addition, table 1 shows the representation of the term in the graph and the chemical terms.
Table 1: The representation of chemical into graph
Chemical Term | The term in Graph |
Atom | Vertex |
Isomers | Isomorphic |
Structural formula | Graph |
Acyclic structure | Tree |
Chemical bond | Edge |
Figure 6 and Figure 7 are examples of representations of graphs in butane (C4H10), in which Figure 6 shows the centered tree graph and Figure 7 shows the bi-centered tree graph.
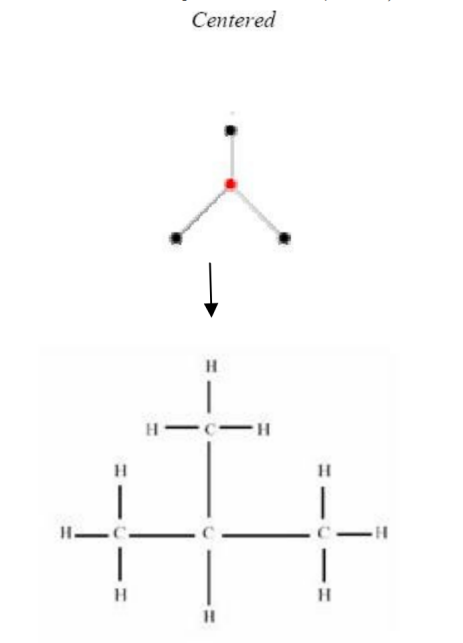
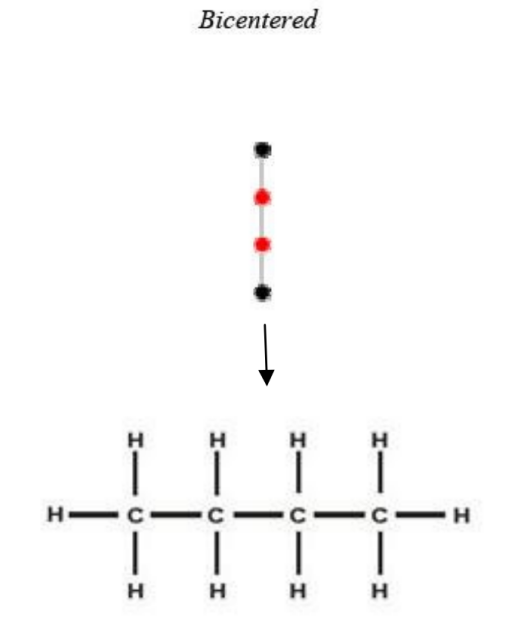
Figure 6: Centered tree of C4H10 Figure 7: Bi-centered tree of C4H10
Figure 8, Figure 9, and Figure 10 are examples of representations of the graph in pentane (C5H12); Figure 8 and Figure 9 show the 2 possible centered tree graphs, and Figure 10 shows the bi-centered tree graph [4].
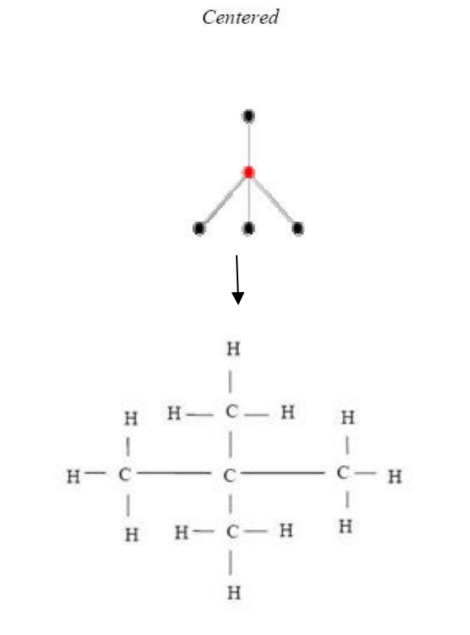
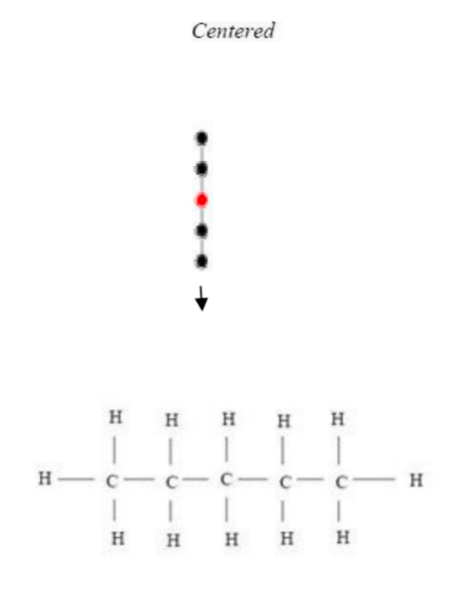
Figure 8: Centered tree of C5H12 Figure 9: Another centered tree of C5H12
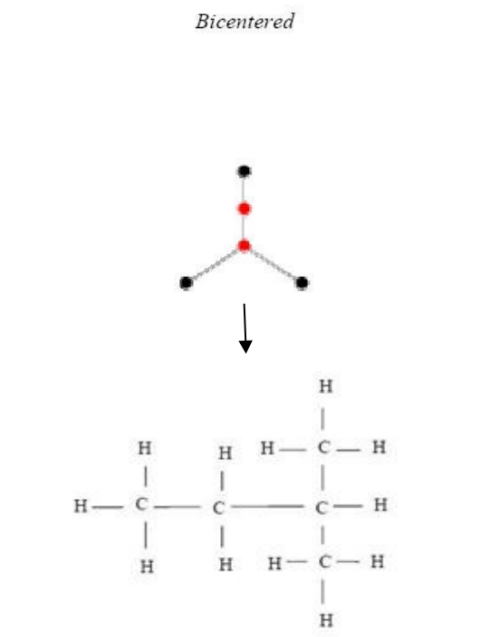
Figure 10: Bi-centered tree of C5H12
7. Read's contribution
The combination of Liya's theory with the astounding finding by Harary and Norman (1960) to enumerate the stereoisomers and constitutional isomers of alkanes in Read (1976) made Read's study unique. The first result that Read uses is the list of alkanes that have only one carbon atom marked. Read only considers the potential that constitutional isomers, or the radicals connected to the tagged carbon atom, can change through any combination of S4 in the first step. Next, Pólya's theorem is used with S4 as the group and A(x) as the figure-counting series. Since the cycle index of the group is \( \frac{1}{24} \) (s14+6s12s2+3s22+8s1s3+6s4) [19].
Additionally, our configuration series has the form because we must multiply by x to account for the additional (labeled) carbon atom.
P(x) = \( \sum _{n=1}^{∞}P \) nxn = x Z (S4; A(x)) = \( \frac{1}{24} \) x{A4(x) + 6A2(x)A(x2) + 3A2(x2) + 8A(x)A(x3) + 6A(x4)}
Pn is the number of these compounds that have n carbon atoms.
Listing alkanes with one tagged carbon-carbon valence electron bond—that is, one that can be identified from the others—is the second necessary result. Such labeling is just a means to an end and has no direct bearing on a workable chemical process [19].
8. Conclusion
From the results and comments previously presented, the following conclusions are inferred:
1. A chemical network (CN) is a hypergraph where each hyperedge denotes an application of a rule for a chemical reaction and each vertex is a connected graph that represents a molecule. As thus, every hyperedge of CN maps to a set of direct derivations that convert each hyperedge's entering vertices into its outgoing vertices. Let D be the set of all direct Sp derivations from a given set of edges (E) of CN. Then, tr(E) = \( \bigcup _{Z\unknownGroupChar8658{p}H∈D}tr(Z\unknownGroupChar8658{p}H) \) and tr (CN) = tr(E(CN).
2. Hamiltonian routes exist for Cayley graphs under some conditions. One requirement is that each finite group Z have a small-sized generating set and a Hamiltonian Cayley graph. The second one is a Cayley graph with a generating set that is restricted by composition factors that are both Abelian and non-Abelian. The third one is the ε-expander Cayley graphs Γp = Γ(PSL(2, p),{α, β, γ}) that have Hamiltonian cycles. [14]
3. Because E(Z)=V(Z) - 1, the structure of chemical compounds, particularly alkanes having the formula CnH2n +2, is a graph tree. Table 2 displays the number of alkane isomers based on the quantity of centered and bi-centered trees [20].
Table 2: Number of alkane isomers
n | Centered | Bicentered | Total |
1 | 1 | 0 | 1 |
2 | 0 | 1 | 1 |
3 | 1 | 0 | 1 |
4 | 1 | 1 | 2 |
5 | 2 | 1 | 3 |
6 | 2 | 3 | 5 |
7 | 6 | 3 | 9 |
8 | 9 | 9 | 18 |
… | … | … | … |
Acknowledgment
Mingzhe Li and Lutong Wang contributed equally to this work and should be considered co-first authors.
References
[1]. Ahmady, Azhvan. “Integral Cayley Graphs.” Summit.sfu.ca, 22 Aug. 2013, summit.sfu.ca/item/13488. Accessed 19 July 2024.
[2]. Balasubramanian, Krishnan. “Nested Wreath Groups and Their Applications to Phylogeny in Biology and Cayley Trees in Chemistry and Physics.” Journal of Mathematical Chemistry, vol. 55, no. 1, 13 Sept. 2016, pp. 195–222, https://doi.org/10.1007/s10910-016-0680-1. Accessed 19 July 2024.
[3]. Bartlett, Padraic. “Cayley Graphs.” Math 137B, 2014, web.math.ucsb.edu/~padraic/ucsb_2013_14/math137b_s2014/math137b_s2014_lecture2.pdf.
[4]. Cayley Diagrams. weddslist.com/groups/cayley-31/index.html.
[5]. “Cayley Graph.” Wikipedia, 11 May 2024, en.wikipedia.org/wiki/Cayley graph.
[6]. Cooperman, Gene, et al. “Applications of Cayley Graphs.” Lecture Notes in Computer Science, 20 Aug. 1990, pp. 367–378, https://doi.org/10.1007/3-540-54195-0_65.
[7]. Farhan, Mohammad, et al. “Simulations of Cayley Graphs of Dihedral Group.” ITM Web of Conferences, vol. 61, Jan. 2024, p. 01003. https://doi.org/10.1051/itmconf/20246101003.
[8]. FRANC, CAMERON. CAYLEY GRAPHS. www.math.mcgill.ca/goren/667.2010/Cameron.pdf
[9]. The Lost Lecture 7: Leaves, Chemistry, Spanning Trees. ptwiddle.github.io/MAS341-Graph-Theory-2017/lecturenotes/lecture7.html.
[10]. Ilić, Aleksandar. “The Energy of Unitary Cayley Graphs.” Linear Algebra and Its Applications, vol. 431, no. 10, 15 Oct. 2009, pp. 1881–1889, www.sciencedirect.com/science/article/pii/S0024379509003218, https://doi.org/10.1016/j.laa.2009.06.025.
[11]. Imran, Muhammad, et al. “On Topological Indices of Fractal and Cayley Tree Type Dendrimers.” Discrete Dynamics in Nature and Society, vol. 2018, Aug. 2018, pp. 1–11. https://doi.org/10.1155/2018/2684984.
[12]. Konstantinova, Elena V, and Daria Lytkina. “Integral Cayley Graphs over Finite Groups.” Algebra Colloquium, vol. 27, no. 01, 25 Feb. 2020, pp. 131–136, https://doi.org/10.1142/s1005386720000115. Accessed 19 July 2024.
[13]. Konstantinova, Elena. “Some Problems on Cayley Graphs.” Linear Algebra and Its Applications, vol. 429, no. 11-12, Dec. 2008, pp. 2754–2769, https://doi.org/10.1016/j.laa.2008.05.010. Accessed 20 Feb. 2020.
[14]. Lin, Henry W. “Cayley Graphs and Complexity Geometry.” the Journal of High Energy Physics the Journal of High Energy Physics, vol. 2019, no. 2, 1 Feb. 2019, https://doi.org/10.1007/jhep02(2019)063. Accessed 19 July 2024.
[15]. Lygeros, Nik, et al. “Enumeration and 3D Representation of the Stereo-isomers of Alkane Molecules.” Journal of Symbolic Computation, vol. 40, no. 4–5, Oct. 2005, pp. 1225–41. https://doi.org/10.1016/j.jsc.2004.04.009.
[16]. Ma, Xuanlong, et al. “Subgroup Perfect Codes in Cayley Graphs.” SIAM Journal on Discrete Mathematics, vol. 34, no. 3, 1 Jan. 2020, pp. 1909–1921, https://doi.org/10.1137/19m1258013. Accessed 19 July 2024.
[17]. Meier, John. Groups, Graphs and Trees. 2008
[18]. Motte, Fernando Jimenez. Graph Theory and Applications to Physics, Chemistry, Big Data, and Vehicular Traffic Data. 6 Feb. 2024, www.linkedin.com/pulse/graph-theory-applications-physics-chemistry-big-data-jimenez-motte-fmoxe.
[19]. Pak, Igor, and Radoš Radoičić. “Hamiltonian Paths in Cayley Graphs.” Discrete Mathematics, vol. 309, no. 17, 1 Sept. 2009, pp. 5501–5508, https://doi.org/10.1016/j.disc.2009.02.018.
[20]. Weisstein, Eric W. “Frucht Graph.” Mathworld.wolfram.com,mathworld.wolfram.com/FruchtGraph.html. Accessed 2 July 2024.
Cite this article
Li,M.;Wang,L. (2025). Applications of Cayley Graphs. Theoretical and Natural Science,107,202-211.
Data availability
The datasets used and/or analyzed during the current study will be available from the authors upon reasonable request.
Disclaimer/Publisher's Note
The statements, opinions and data contained in all publications are solely those of the individual author(s) and contributor(s) and not of EWA Publishing and/or the editor(s). EWA Publishing and/or the editor(s) disclaim responsibility for any injury to people or property resulting from any ideas, methods, instructions or products referred to in the content.
About volume
Volume title: Proceedings of the 4th International Conference on Computing Innovation and Applied Physics
© 2024 by the author(s). Licensee EWA Publishing, Oxford, UK. This article is an open access article distributed under the terms and
conditions of the Creative Commons Attribution (CC BY) license. Authors who
publish this series agree to the following terms:
1. Authors retain copyright and grant the series right of first publication with the work simultaneously licensed under a Creative Commons
Attribution License that allows others to share the work with an acknowledgment of the work's authorship and initial publication in this
series.
2. Authors are able to enter into separate, additional contractual arrangements for the non-exclusive distribution of the series's published
version of the work (e.g., post it to an institutional repository or publish it in a book), with an acknowledgment of its initial
publication in this series.
3. Authors are permitted and encouraged to post their work online (e.g., in institutional repositories or on their website) prior to and
during the submission process, as it can lead to productive exchanges, as well as earlier and greater citation of published work (See
Open access policy for details).
References
[1]. Ahmady, Azhvan. “Integral Cayley Graphs.” Summit.sfu.ca, 22 Aug. 2013, summit.sfu.ca/item/13488. Accessed 19 July 2024.
[2]. Balasubramanian, Krishnan. “Nested Wreath Groups and Their Applications to Phylogeny in Biology and Cayley Trees in Chemistry and Physics.” Journal of Mathematical Chemistry, vol. 55, no. 1, 13 Sept. 2016, pp. 195–222, https://doi.org/10.1007/s10910-016-0680-1. Accessed 19 July 2024.
[3]. Bartlett, Padraic. “Cayley Graphs.” Math 137B, 2014, web.math.ucsb.edu/~padraic/ucsb_2013_14/math137b_s2014/math137b_s2014_lecture2.pdf.
[4]. Cayley Diagrams. weddslist.com/groups/cayley-31/index.html.
[5]. “Cayley Graph.” Wikipedia, 11 May 2024, en.wikipedia.org/wiki/Cayley graph.
[6]. Cooperman, Gene, et al. “Applications of Cayley Graphs.” Lecture Notes in Computer Science, 20 Aug. 1990, pp. 367–378, https://doi.org/10.1007/3-540-54195-0_65.
[7]. Farhan, Mohammad, et al. “Simulations of Cayley Graphs of Dihedral Group.” ITM Web of Conferences, vol. 61, Jan. 2024, p. 01003. https://doi.org/10.1051/itmconf/20246101003.
[8]. FRANC, CAMERON. CAYLEY GRAPHS. www.math.mcgill.ca/goren/667.2010/Cameron.pdf
[9]. The Lost Lecture 7: Leaves, Chemistry, Spanning Trees. ptwiddle.github.io/MAS341-Graph-Theory-2017/lecturenotes/lecture7.html.
[10]. Ilić, Aleksandar. “The Energy of Unitary Cayley Graphs.” Linear Algebra and Its Applications, vol. 431, no. 10, 15 Oct. 2009, pp. 1881–1889, www.sciencedirect.com/science/article/pii/S0024379509003218, https://doi.org/10.1016/j.laa.2009.06.025.
[11]. Imran, Muhammad, et al. “On Topological Indices of Fractal and Cayley Tree Type Dendrimers.” Discrete Dynamics in Nature and Society, vol. 2018, Aug. 2018, pp. 1–11. https://doi.org/10.1155/2018/2684984.
[12]. Konstantinova, Elena V, and Daria Lytkina. “Integral Cayley Graphs over Finite Groups.” Algebra Colloquium, vol. 27, no. 01, 25 Feb. 2020, pp. 131–136, https://doi.org/10.1142/s1005386720000115. Accessed 19 July 2024.
[13]. Konstantinova, Elena. “Some Problems on Cayley Graphs.” Linear Algebra and Its Applications, vol. 429, no. 11-12, Dec. 2008, pp. 2754–2769, https://doi.org/10.1016/j.laa.2008.05.010. Accessed 20 Feb. 2020.
[14]. Lin, Henry W. “Cayley Graphs and Complexity Geometry.” the Journal of High Energy Physics the Journal of High Energy Physics, vol. 2019, no. 2, 1 Feb. 2019, https://doi.org/10.1007/jhep02(2019)063. Accessed 19 July 2024.
[15]. Lygeros, Nik, et al. “Enumeration and 3D Representation of the Stereo-isomers of Alkane Molecules.” Journal of Symbolic Computation, vol. 40, no. 4–5, Oct. 2005, pp. 1225–41. https://doi.org/10.1016/j.jsc.2004.04.009.
[16]. Ma, Xuanlong, et al. “Subgroup Perfect Codes in Cayley Graphs.” SIAM Journal on Discrete Mathematics, vol. 34, no. 3, 1 Jan. 2020, pp. 1909–1921, https://doi.org/10.1137/19m1258013. Accessed 19 July 2024.
[17]. Meier, John. Groups, Graphs and Trees. 2008
[18]. Motte, Fernando Jimenez. Graph Theory and Applications to Physics, Chemistry, Big Data, and Vehicular Traffic Data. 6 Feb. 2024, www.linkedin.com/pulse/graph-theory-applications-physics-chemistry-big-data-jimenez-motte-fmoxe.
[19]. Pak, Igor, and Radoš Radoičić. “Hamiltonian Paths in Cayley Graphs.” Discrete Mathematics, vol. 309, no. 17, 1 Sept. 2009, pp. 5501–5508, https://doi.org/10.1016/j.disc.2009.02.018.
[20]. Weisstein, Eric W. “Frucht Graph.” Mathworld.wolfram.com,mathworld.wolfram.com/FruchtGraph.html. Accessed 2 July 2024.