


1. Introduction
Melanoma is among the most aggressive and deadly forms of skin cancer, representing approximately 4-5% of skin cancer cases while accounting for the majority of skin cancer–related deaths[1,2]. Historically, treatment options for advanced melanoma were severely limited, with traditional modalities such as surgical resection, chemotherapy, and radiotherapy offering only modest benefits and often accompanied by substantial adverse effects[3]. Chemotherapy regimens, for example, were plagued by a lack of tumor specificity, resulting in systemic toxicity that damaged healthy tissues, while radiotherapy was generally inadequate in controlling metastatic dissemination[3]. Consequently, patients with metastatic melanoma faced dismal five-year survival rates, often in the range of 5–10%, rendering the prognosis nearly hopeless and highlighting a critical unmet need for more effective therapeutic strategies[4].
The clinical landscape of melanoma began to change dramatically with the advent of immune checkpoint inhibitors (ICIs). Agents such as ipilimumab, pembrolizumab, and nivolumab have harnessed the body’s immune system to target malignant cells, thereby revolutionizing the management of advanced melanoma[5]. ICIs work by blocking inhibitory pathways that normally restrain T cell activity, thus reinvigorating the anti-tumor immune response[5]. In several clinical trials, these therapies have been associated with substantial improvements in patient outcomes; some studies have reported increases in five-year survival rates to nearly 50% in a subset of patients—a remarkable improvement over the historical outcomes[6,7]. However, despite these promising advances, significant challenges persist. Notably, nearly half of the patients treated with ICIs do not exhibit a favorable clinical response[8]. This variability in treatment efficacy underscores the complexity of the tumor microenvironment (TME) and the need to better understand the underlying mechanisms driving resistance.
A second, equally pressing issue is the financial burden imposed by immunotherapy. The high cost of ICIs—often exceeding $150,000 per patient annually—places these treatments well above the median U.S. household income of approximately $68,700[9,10]. This economic strain not only jeopardizes the affordability and accessibility of life-saving therapies but also results in a misallocation of healthcare resources when patients are subjected to expensive treatments that ultimately prove ineffective. The dual challenges of suboptimal response rates and prohibitive costs have galvanized efforts to develop predictive biomarkers that can guide clinical decision-making—ensuring that patients most likely to benefit from ICIs are accurately identified and spared the financial and physical burdens of ineffective treatment.
Recent advances in single-cell RNA sequencing (scRNA-seq) have provided a transformative lens through which the cellular heterogeneity of the TME can be examined[11]. This high-resolution technology enables the identification and characterization of individual cell populations within tumors, offering unprecedented insights into the complex interplay between malignant cells and the immune system[12]. In this context, tumor-associated macrophages (TAMs) have emerged as pivotal players in modulating immune responses. These cells, which can exhibit either pro-inflammatory (M1) or anti-inflammatory (M2) phenotypes, have been implicated in promoting an immunosuppressive environment that fosters tumor progression and resistance to immunotherapy [13].
In the present study, we sought to leverage scRNA-seq data from melanoma patients who had received immunotherapy, stratified by their clinical responses, to unravel the cellular underpinnings of therapeutic resistance[14]. We reanalyzed single-cell RNA sequencing data from melanoma patients treated with immune checkpoint inhibitors—originally published by Sade-Feldman et al.—to uncover cellular drivers of therapeutic resistance[14]. Whereas previous analyses predominantly centered on T cell states, we focused on all types of immune cells. Our investigation revealed a striking enrichment of M2-polarized macrophages in tumors from non-responding patients. Leveraging this insight, we developed a macrophage-derived gene signature. This signature was significantly associated with worse overall survival in melanoma patients, as validated in TCGA SKCM data, where patients with higher signature scores had poorer outcomes. Finally, using custom ROC analysis routines on an independent dataset, we demonstrated that our gene signature reliably discriminates between responders and non-responders, underscoring its potential as a predictive biomarker for immunotherapy response.
To functionally validate these findings, we employed an in vitro co-culture system designed to elucidate the impact of distinct macrophage phenotypes on T cell proliferation. THP1-derived macrophages were differentiated into either M1 or M2 phenotypes and subsequently co-cultured with CFSE-labeled Jurkat T cells. Flow cytometry analyses revealed that M2-polarized macrophages significantly inhibited T cell proliferation relative to M1 macrophages, thereby reinforcing the role of an immunosuppressive macrophage population in mediating resistance to ICIs.
Collectively, these findings not only shed light on the critical role of tumor-associated macrophages in shaping the immune landscape of melanoma but also underscore the urgent need for a predictive gene panel in clinical practice. By enabling the early identification of patients unlikely to benefit from immunotherapy, such a panel could help avert unnecessary treatment-related costs and improve overall patient outcomes. Ultimately, our work aims to advance personalized oncology by providing a robust tool that guides therapeutic decision-making and optimizes the allocation of healthcare resources in the treatment of melanoma.
2. Methods
2.1. Single-cell RNA-seq data acquisition and preprocessing
Single-cell RNA-sequencing data from a melanoma cohort (GSE120575) were obtained through the Gene Expression Omnibus. Expression profiles were provided in transcript per million (TPM) format, with rows representing genes and columns representing single cells, accompanied by metadata describing patient demographics and treatment responses[14]. Data handling and subsequent analyses were conducted in R (version 4.3.2), using the Seurat, dplyr, ggplot2, and tidyr packages. Metadata were examined to remove duplicates and retain only cells present in both the TPM file and annotation. A Seurat object was created with these TPM values as the input count matrix (CreateSeuratObject), including patient-level information in the meta.data slot.
2.2. Quality control and filtering
Cells labeled as “Pre” or baseline in the metadata were isolated to focus on pretreatment samples. Quality metrics were assessed by examining the total number of detected genes (nFeature_RNA), the total RNA content (nCount_RNA), and the percentage of mitochondrial features (percent.mt). Violin plots (VlnPlot) and scatter plots (FeatureScatter) were generated to visualize outliers and potential shifts in quality metrics. Expression data were then normalized using the LogNormalize method (NormalizeData), with 10,000 as the scale factor, and 2,500 highly variable genes were identified (FindVariableFeatures). Patient-specific factors, such as baseline or posttreatment status, were regressed out during the scaling process (ScaleData).
2.3. Dimensional reduction and clustering
Principal component analysis (RunPCA) was performed on the highly variable genes, and the first 35 principal components (PCs) were retained, capturing approximately 83% of total variance. Neighbor graphs were constructed (FindNeighbors) based on these PCs, and multiple cluster resolutions (ranging from 0.1 to 2.0) were evaluated with FindClusters. Uniform manifold approximation and projection (RunUMAP) was subsequently applied to visualize clusters, using the same PCs as input. Clusters were labeled according to their resolution-specific identities, and relationships to clinical response or sample identity were examined by projecting these variables onto UMAP plots (DimPlot).
2.4. Marker identification and differential expression
Cluster markers were identified by setting each clustering resolution as the active identity (Idents) and performing FindAllMarkers with a minimum fraction of expressed genes of 0.25 and a log2 fold-change threshold of 0.25. Heatmaps (DoHeatmap) were generated to visualize the top 20 marker genes in each cluster. Differences between “Responder” and “Non-responder” cells were also tested (FindMarkers) to identify upregulated genes in either clinical subgroup. Specific thresholds were used to prioritize candidate genes, such as log2 fold-change cutoffs of 0.2 to 1.0 and adjusted p-values below 0.05, and these gene sets informed subsequent survival analyses.
2.5. Survival analyses in independent melanoma cohorts
Gene signatures derived from the GSE120575 dataset (for example, cluster-specific markers or responder-enriched genes) were evaluated in additional cohorts, including The Cancer Genome Atlas (TCGA) SKCM and publicly available melanoma data sets (Allen phs000452). Expression data (often in log-transformed form) were harmonized, and matching clinical annotations were retrieved to enable survival modeling. Composite scores for each gene signature were computed by scaling the relevant genes, then averaging across each sample. Cox proportional hazards models (using the coxph function from the survival package) were fitted to determine the association between signature scores and survival outcomes, such as overall survival. Kaplan–Meier curves were generated, and log-rank tests were performed to compare high- and low-scoring subgroups. Custom R routines were used to calculate area under the curve (AUC) values and receiver operating characteristic (ROC) curves to evaluate classification performance for immunotherapy response.
2.6. In vitro co-culture experimental design
An in vitro co-culture system was developed to model the immunosuppressive features suggested by non-responder cell populations in the single-cell analysis. THP-1 human monocytes (ATCC) were cultured in RPMI-1640 with 10% fetal bovine serum (FBS) and 1% penicillin–streptomycin. Cells were seeded at 1×10^6 per well in 6-well plates and differentiated into macrophages by treatment with 100 ng/mL phorbol 12-myristate 13-acetate (PMA) for 48 hours, followed by a 24-hour rest. M1 polarization was achieved by adding 20 ng/mL interferon-gamma (IFN-γ) and 100 ng/mL lipopolysaccharide (LPS), whereas M2 polarization was induced using 20 ng/mL interleukin-4 (IL-4) and 20 ng/mL interleukin-13 (IL-13). Unpolarized macrophages (M0) were maintained without exogenous cytokines.
A375 melanoma cells (ATCC) were grown in DMEM with 10% FBS and seeded (5×10^4 cells/well) in 24-well plates. Macrophages were added at 1×10^5 cells per well, followed by Jurkat T cells at 1×10⁵ per well. Jurkat T cells were labeled with 5 µM carboxyfluorescein succinimidyl ester (CFSE) according to manufacturer instructions, and T cell activation was induced by soluble anti-CD3 (1 µg/mL; OKT3) plus anti-CD28 (1 µg/mL). After 72 hours of co-culture at 37 °C with 5% CO₂, cells were collected for flow cytometric analysis.
2.7. Flow cytometry and proliferation assessment
Samples were washed, stained with a fixable live/dead dye, and blocked with a human Fc receptor reagent. T cells were gated by CD3 expression (PerCP/Cy5.5-anti-CD3). Flow cytometry data were acquired on a BD LSRFortessa instrument, collecting at least 10,000 CD3+ events per sample. CFSE dilution was used to measure T cell proliferation, and data were analyzed with standard flow cytometry software to compare Jurkat T cells in the presence of M1, M2, or M0 macrophages alongside A375 melanoma cells.
2.8. Statistical analysis
In single-cell analyses, the Wilcoxon rank-sum test was used in Seurat for differential expression, and Benjamini–Hochberg corrections were applied for multiple comparisons. For survival models, univariate Cox analyses generated hazard ratios and 95% confidence intervals, and Kaplan–Meier estimates were compared using log-rank tests. In the in vitro assays, differences among multiple experimental groups (M1, M2, M0, and control) were assessed by one-way ANOVA with post hoc tests, while pairwise comparisons typically employed two-tailed t-tests. Significance thresholds were generally set at p < 0.05, and all numerical data were reported as mean ± standard error (SE).
3. Results
3.1. Comprehensive single-cell transcriptomic profiling of the melanoma tumor microenvironment
Our single-cell RNA sequencing analysis of pretreatment melanoma samples provided an in-depth view of the tumor microenvironment (TME), revealing a highly heterogeneous landscape of immune cell populations. Unsupervised clustering followed by UMAP dimensionality reduction allowed us to visualize distinct cellular clusters based on their transcriptomic profiles (Fig. 1A). High expression levels of the pan-leukocyte marker PTPRC confirmed that all cells analyzed were of hematopoietic origin, while differential expression of markers such as ITGAM and ITGAX helped to demarcate clusters corresponding to monocytes and macrophages (Fig. 1B). In parallel, robust expression of CD3G delineated the T cell compartment, and additional markers like CD19 and CD1C identified B cells and dendritic cells, respectively (Fig. 1B). Furthermore, the expression of CSF1R provided additional resolution in defining macrophage subsets (Fig.1B). Within the T cell compartment, markers including CD8A, CD4, and immune checkpoint genes (PDCD1, CD69, CTLA4) further subdivided T cells into functionally distinct subpopulations (Fig. 1B). When cells were color-coded according to individual patient samples, the even distribution observed across the UMAP projection demonstrated that the clustering was robust and reproducible, independent of sample-specific variations (Fig.1C). This detailed cellular atlas lays the groundwork for understanding the dynamic interactions within the TME and provides a crucial baseline for subsequent analyses of immunotherapy resistance mechanisms.
3.2. Differential immune cell composition in responders versus non-responders
Building on the comprehensive mapping of the TME, we next compared the immune landscapes of melanoma patients who responded to immunotherapy with those who did not. UMAP visualization of the single-cell transcriptomic data from both cohorts revealed distinct segregation of immune cell clusters, with clear differences in the relative proportions of key cell types (Fig. 2A-B). In non-responders, clusters characterized by high expression of macrophage-associated markers such as CD14, C1QA, C1QC, CCL2, VSIG4, FCN1, and MARCO were notably enriched, suggesting an expansion of immunosuppressive macrophage (M2 macrophage) (Fig. 2C). In contrast, responders displayed a more robust cytotoxic T cell signature, evidenced by high expression of genes including GZMB, PRF1, GZMH, GZMK, GZMA, and CCL5, indicative of enhanced antitumor immunity (Fig. 2C). Additional clusters corresponding to naive/central memory T cells (expressing SELL and GPR183), proliferating cells (highlighted by UBE2C expression), and B cells (marked by immunoglobulin genes such as IGLC3, IGHV3-30, IGLC1, TCL1A, IGKC, IGHM, IGHG1, with supporting expression of MS4A1 and VPREB3) further defined the immune landscape(Fig. 2C). The differential enrichment of these cell types between responders and non-responders underscores the possibility that an immunosuppressive TME, dominated by specific macrophage subsets, may contribute to the lack of clinical benefit from immune checkpoint inhibitors.
Moreover, the data suggest differential enrichment of specific immune cell types between responders and non-responders. The variations in marker gene expression patterns, especially within the monocyte/macrophage and T cell compartments, point toward potential cellular mechanisms underlying immunotherapy resistance. For instance, the heightened expression of macrophage-associated markers in non-responders may contribute to an immunosuppressive microenvironment, whereas a more robust cytotoxic T cell signature in responders could underlie more effective antitumor immunity.
In summary, Figure 2 not only confirms the cellular heterogeneity of the melanoma immune microenvironment but also highlights key differences in immune cell composition and gene expression between patients with distinct clinical responses. These findings provide a foundation for further investigation into predictive biomarkers and the cellular basis of immunotherapy resistance in melanoma.
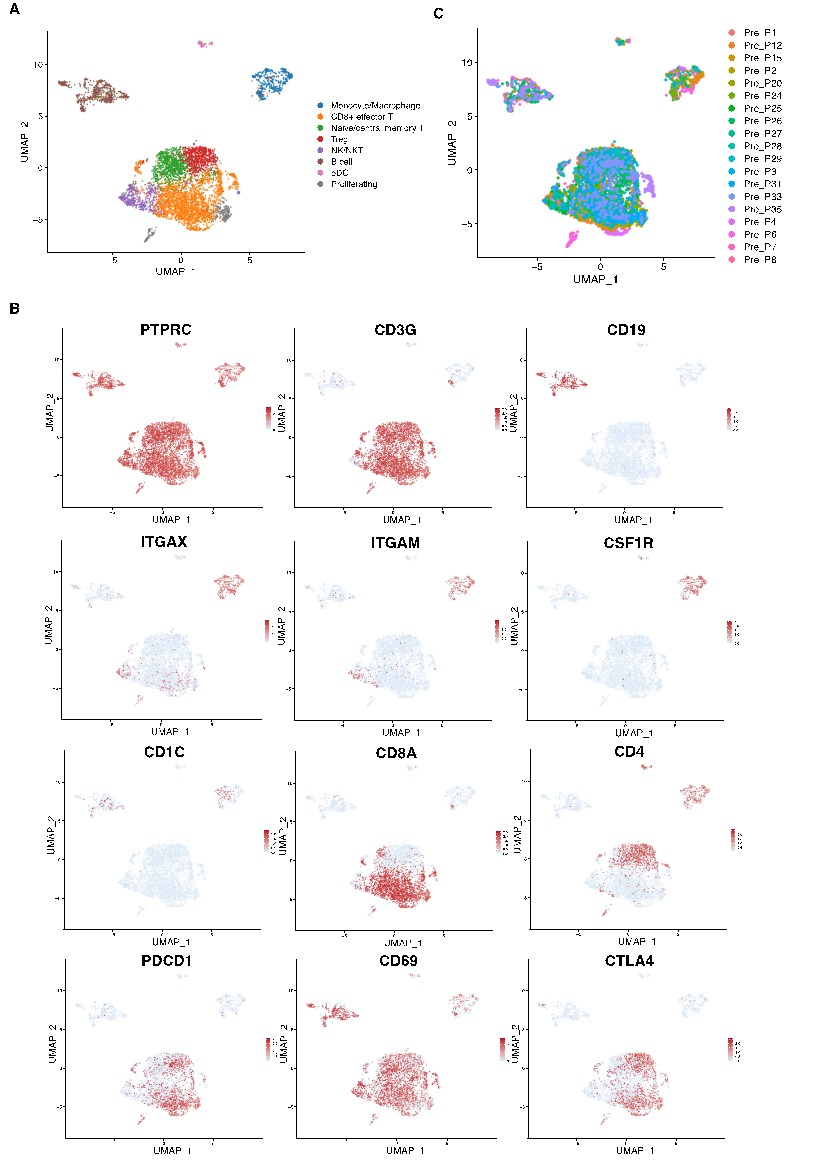
Figure 1: Immune cell landscape and assessment of batch effects in melanoma tumors. (a) UMAP projection of single cells from melanoma tumors, illustrating the overall cellular heterogeneity. (b) Feature plots displaying the expression patterns of key immune markers (e.g., PTPRC, ITGAM, ITGAX, CD3G, CD19, CD1C, CSF1R) across the UMAP space. (c) UMAP colored by sample ID, demonstrating minimal batch effects across different patient samples
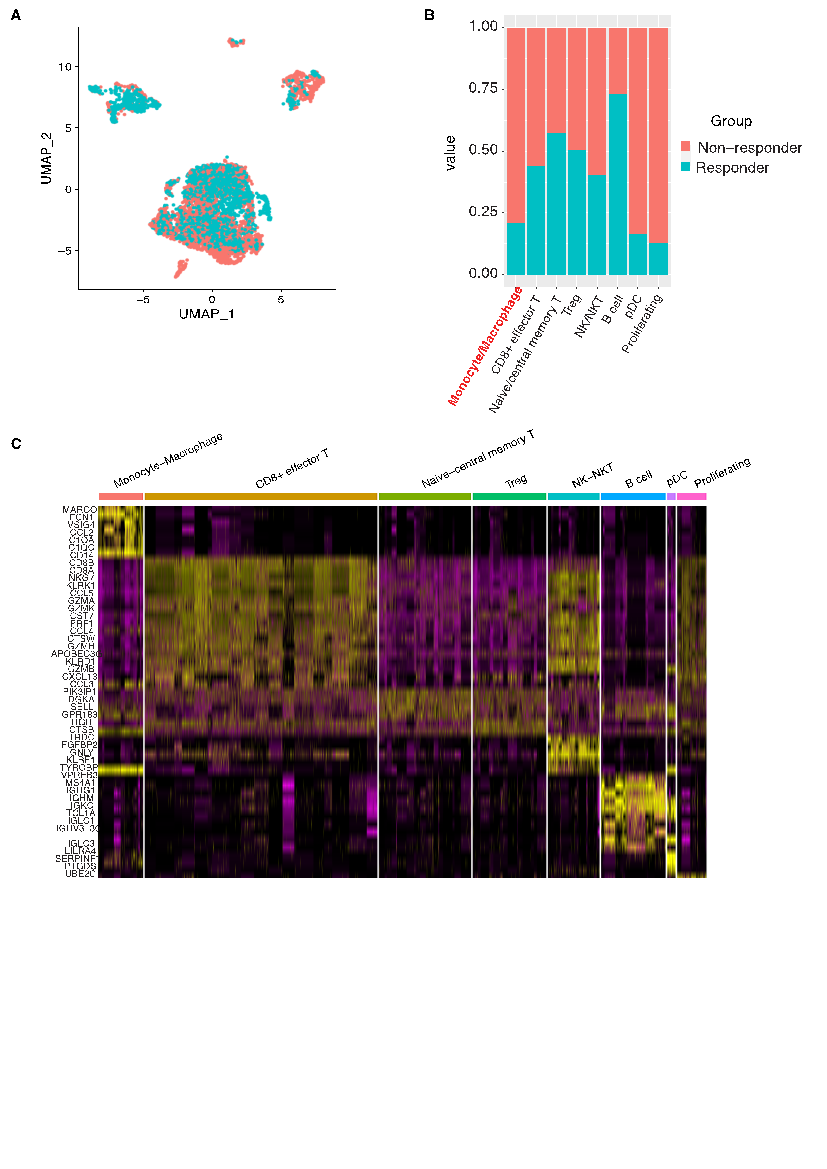
Figure 2: Differential immune composition between responder and non-responder patient groups. (a) UMAP visualization of immune cells grouped by patient clinical response, distinguishing responders from non-responders. (b) Stacked bar plot showing the contribution of each patient group to the identified immune cell clusters, highlighting differences in cellular composition. (c) Heatmap of marker genes for each immune cell cluster, defining the transcriptional identity of the subsets
3.3. Prognostic and predictive value of a macrophage-derived gene signature
To assess the clinical relevance of our observations, we derived a macrophage-associated gene signature from the single-cell data and evaluated its impact on patient outcomes. Kaplan–Meier survival analysis revealed that melanoma patients with high expression of the macrophage gene signature experienced significantly reduced overall survival compared to those with low expression levels (p = 0.0044) (Fig. 3A). This finding indicates that a macrophage-enriched TME, which likely reflects an immunosuppressive milieu, is associated with adverse clinical outcomes. Complementing the survival data, receiver operating characteristic (ROC) analysis demonstrated that the gene signature has a high predictive accuracy for immunotherapy response, with an area under the curve (AUC) of 0.896 (Fig. 3B). This strong discriminatory power suggests that the macrophage signature can serve as a reliable biomarker to stratify patients based on their likelihood of responding to immune checkpoint inhibitors, thereby potentially guiding treatment decisions and sparing non-responders from ineffective, costly therapies.
Collectively, these findings indicate that the macrophage gene signature not only serves as a prognostic indicator of overall survival but also holds promise as a predictive biomarker for immunotherapy efficacy in melanoma patients.
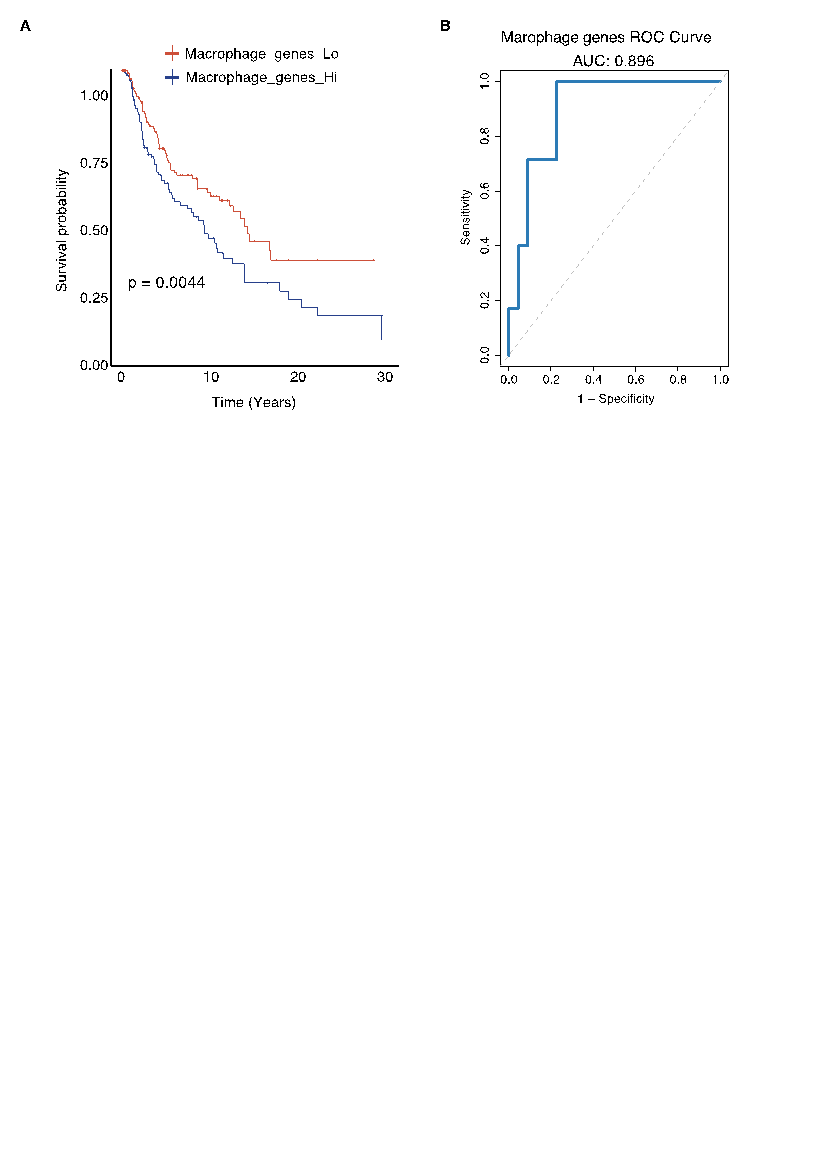
Figure 3: Prognostic and predictive performance of the macrophage-derived gene signature. (A) Kaplan–Meier survival analysis comparing melanoma patients with high versus low expression of the macrophage-derived gene signature; high signature scores correlate with significantly worse overall survival (p = 0.0044). (B) ROC curve analysis demonstrating the signature’s strong predictive accuracy for immunotherapy response, with an AUC of 0.896
3.4. Functional validation of macrophage polarization on T cell proliferation
To elucidate the functional implications of macrophage polarization on T cell activity, we performed in vitro co-culture experiments using Jurkat T cells, A375 melanoma cells, and THP-1-derived macrophages differentiated into either M1 or M2 phenotypes. Baseline T cell proliferation, measured in the Jurkat+A375 co-culture, was 32.1%. Notably, when M1 macrophages were included in the co-culture, T cell proliferation increased substantially to 52.9%, indicating that pro-inflammatory macrophages can enhance T cell responses (Fig. 4). In stark contrast, the presence of M2-polarized macrophages resulted in a marked decrease in T cell proliferation, with a proliferation rate dropping to only 10.2% (Fig. 4). These functional data validate the transcriptomic findings by demonstrating that M2 macrophages impose a strong inhibitory effect on T cell proliferation, thereby contributing to an immunosuppressive TME. This finding provides a mechanistic explanation for the observed resistance to immunotherapy in patients with a high macrophage gene signature and further highlights the therapeutic potential of targeting macrophage polarization to improve clinical outcomes in melanoma.
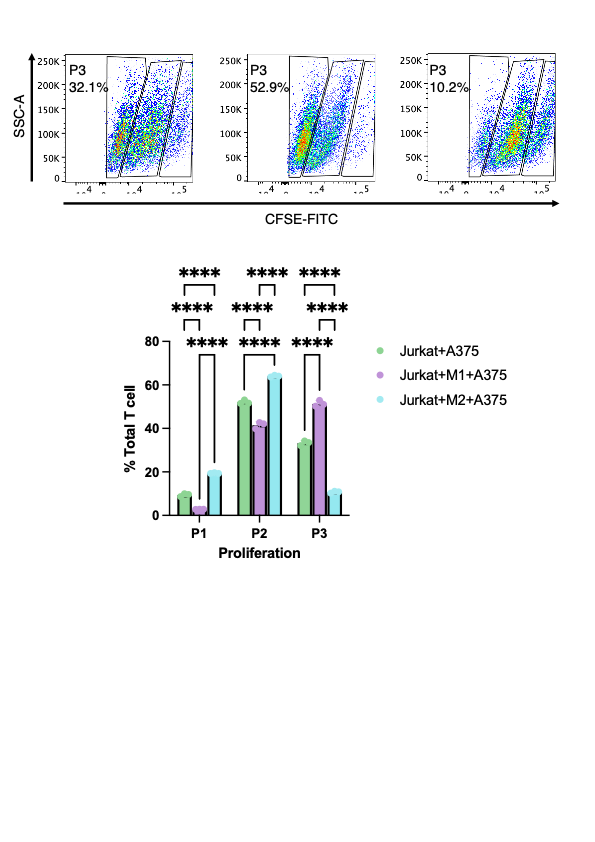
Figure 4: Impact of macrophage polarization on T cell proliferation in co-culture assays. Jurkat T cells were co-cultured with A375 melanoma cells under three conditions: without macrophages (Jurkat+A375), with M1-polarized macrophages (Jurkat+M1+A375), and with M2-polarized macrophages (Jurkat+M2+A375). Flow cytometric analysis using CFSE-FITC staining revealed significant differences in T cell proliferation, with statistical tests confirming that M1 macrophages enhance, while M2 macrophages suppress, T cell proliferation relative to the control
Collectively, these results reveal that the melanoma TME is highly heterogeneous, with specific immune cell compositions correlating with patient response to immunotherapy. The enrichment of immunosuppressive macrophages in non-responders, coupled with the strong prognostic and predictive performance of the macrophage-derived gene signature, underscores the critical role of TAMs in mediating resistance to immune checkpoint blockade. Furthermore, our functional assays substantiate the inhibitory effects of M2 macrophages on T cell proliferation, suggesting that modulation of macrophage polarization could be a promising strategy to enhance the efficacy of immunotherapy in melanoma.
4. Discussion
These results underscore the intricate nature of the tumor microenvironment in melanoma, where diverse immune populations dynamically interact to influence therapeutic outcomes[15,16]. By integrating single-cell transcriptomics, survival analyses, and functional assays, we demonstrate that macrophages—particularly those adopting an M2-like phenotype—play a decisive role in mediating immunotherapy resistance. In non-responder samples, the increased prevalence of macrophage-associated genes aligns with prior evidence suggesting that tumor-associated macrophages (TAMs) foster an immunosuppressive milieu by secreting anti-inflammatory cytokines, expressing checkpoint ligands, and supporting tumor cell survival[17]. Our in vitro experiments corroborate these observations, as M2-polarized macrophages markedly dampened T cell proliferation, while M1-polarized macrophages enhanced it. This functional distinction highlights the plasticity of macrophages and reinforces the idea that reprogramming them toward an M1 phenotype could augment T cell–mediated tumor clearance[18].
Beyond clarifying the immunosuppressive mechanisms within the melanoma microenvironment, our study introduces a macrophage-derived gene signature with significant prognostic and predictive utility. High expression of this signature correlated with worse overall survival in large patient cohorts, including The Cancer Genome Atlas, and it accurately distinguished responders from non-responders to immune checkpoint inhibitors with an area under the curve of 0.896. These findings advance the notion that macrophage infiltration and polarization status are not merely bystanders but active contributors to treatment resistance, underscoring the need for biomarkers that capture this dimension of the immune landscape[19]. From a clinical perspective, implementing such a biomarker could optimize patient stratification, directing expensive and potentially toxic therapies toward individuals most likely to benefit. The financial burden of immunotherapy—often exceeding $150,000 annually per patient—magnifies the importance of accurate predictive tools to avert avoidable costs and mitigate the strain on healthcare systems.
Our results also resonate with the broader body of literature on TAMs in solid tumors, where high macrophage density frequently correlates with poor outcomes. The novelty here lies in leveraging single-cell resolution data, which allowed us to pinpoint specific genes driving macrophage-mediated immunosuppression and to validate their biological effects in vitro. This level of detail provides a clearer roadmap for developing combination therapies. For instance, agents that target macrophage recruitment or block key immunosuppressive pathways—such as CSF1R or chemokine receptors—could be paired with checkpoint blockade to enhance antitumor immunity[20]. The capacity of M1 macrophages to support T cell activation in our co-culture assays further supports this combinatorial approach, as tipping the M1/M2 balance may help overcome resistance that persists despite T cell reinvigoration[21].
Nevertheless, certain limitations must be acknowledged. First, our analyses relied on publicly available datasets, and prospective validation in larger, more diverse cohorts is necessary to solidify the clinical applicability of the macrophage signature. Second, although the THP-1 model is a valuable tool for macrophage differentiation studies, patient-derived macrophages may exhibit unique transcriptional and functional traits that differ from immortalized cell lines. Additional in vivo work could illuminate how macrophages interact with other immunosuppressive cell types, such as regulatory T cells and myeloid-derived suppressor cells, in shaping the tumor microenvironment. Moreover, melanoma is a genetically heterogeneous disease, and integrating our signature with genomic features (e.g., BRAF, NRAS mutations) or tumor mutational burden assessments could further refine its predictive power[22].
Despite these caveats, the data presented here substantially advance our understanding of how TAMs contribute to immunotherapy resistance in melanoma and emphasize the translational potential of a macrophage-focused biomarker. By pinpointing patients unlikely to respond to checkpoint blockade, such a signature would not only guide therapeutic decisions but also encourage the development of macrophage-targeted agents to be tested in combination with ICIs. As precision oncology continues to evolve, the integration of single-cell technologies, functional validation, and robust clinical studies will be critical to unlocking more durable and cost-effective treatment options for patients with advanced melanoma.
5. Conclusion
In conclusion, our study demonstrates that a macrophage-derived gene signature is a powerful predictor of immunotherapy resistance and overall survival in melanoma patients. By integrating single-cell transcriptomic analyses, survival modeling, and functional in vitro assays, we have elucidated the critical role of tumor-associated macrophages—particularly the immunosuppressive M2 phenotype—in shaping the tumor microenvironment and hindering effective T cell–mediated antitumor responses. These findings not only advance our understanding of the cellular mechanisms underlying treatment failure but also underscore the potential of this signature as a valuable biomarker for personalized therapeutic strategies. Implementing such predictive tools could improve patient stratification, optimize resource allocation, and foster the development of combination therapies that target macrophage-mediated immune suppression, ultimately paving the way for more effective and cost-efficient treatments in advanced melanoma.
References
[1]. Shajari N, Baradaran B, Tohidkia MR, et al. Advancements in Melanoma Therapies: From Surgery to Immunotherapy. Curr Treat Options Oncol. 2024;25(8):1073-1088. doi: 10.1007/s11864-024-01239-8.
[2]. He X, Deng H, Liu W, et al. Advances in Understanding Drug Resistance Mechanisms and Innovative Clinical Treatments for Melanoma. Curr Treat Options Oncol. 2024;25(12):1615-1633. doi: 10.1007/s11864-024-01279-0.
[3]. Kuryk L, Bertinato L, Staniszewska M, et al. From Conventional Therapies to Immunotherapy: Melanoma Treatment in Review. Cancers (Basel). 2020;12(10). doi: 10.3390/cancers12103057.
[4]. Pollack LA, Li J, Berkowitz Z, et al. Melanoma survival in the United States, 1992 to 2005. J Am Acad Dermatol. 2011;65(5 Suppl 1):S78-86. doi: 10.1016/j.jaad.2011.05.030.
[5]. Tumeh PC, Harview CL, Yearley JH, et al. PD-1 blockade induces responses by inhibiting adaptive immune resistance. Nature. 2014;515(7528):568-71. doi: 10.1038/nature13954.
[6]. Larkin J, Chiarion-Sileni V, Gonzalez R, et al. Five-Year Survival with Combined Nivolumab and Ipilimumab in Advanced Melanoma. N Engl J Med. 2019;381(16):1535-1546. doi: 10.1056/NEJMoa1910836.
[7]. Wolchok JD, Chiarion-Sileni V, Rutkowski P, et al. Final, 10-Year Outcomes with Nivolumab plus Ipilimumab in Advanced Melanoma. N Engl J Med. 2025;392(1):11-22. doi: 10.1056/NEJMoa2407417.
[8]. Huang AC, Zappasodi R. A decade of checkpoint blockade immunotherapy in melanoma: understanding the molecular basis for immune sensitivity and resistance. Nat Immunol. 2022;23(5):660-670. doi: 10.1038/s41590-022-01141-1.
[9]. Zafar SY, Abernethy AP. Financial toxicity, Part I: a new name for a growing problem. Oncology (Williston Park). 2013;27(2):80-1, 149.
[10]. Zheng Z, Jemal A, Han X, et al. Medical financial hardship among cancer survivors in the United States. Cancer. 2019;125(10):1737-1747. doi: 10.1002/cncr.31913.
[11]. Chen S, Zhou Z, Li Y, et al. Application of single-cell sequencing to the research of tumor microenvironment. Front Immunol. 2023;14:1285540. doi: 10.3389/fimmu.2023.1285540.
[12]. Butler A, Hoffman P, Smibert P, et al. Integrating single-cell transcriptomic data across different conditions, technologies, and species. Nat Biotechnol. 2018;36(5):411-420. doi: 10.1038/nbt.4096.
[13]. Noy R, Pollard JW. Tumor-associated macrophages: from mechanisms to therapy. Immunity. 2014;41(1):49-61. doi: 10.1016/j.immuni.2014.06.010.
[14]. Sade-Feldman M, Yizhak K, Bjorgaard SL, et al. Defining T Cell States Associated with Response to Checkpoint Immunotherapy in Melanoma. Cell. 2018;175(4):998-1013 e20. doi: 10.1016/j.cell.2018.10.038.
[15]. Shirley CA, Chhabra G, Amiri D, et al. Immune escape and metastasis mechanisms in melanoma: breaking down the dichotomy. Front Immunol. 2024;15:1336023. doi: 10.3389/fimmu.2024.1336023.
[16]. Passarelli A, Mannavola F, Stucci LS, et al. Immune system and melanoma biology: a balance between immunosurveillance and immune escape. Oncotarget. 2017;8(62):106132-106142. doi: 10.18632/oncotarget.22190.
[17]. Zhou L, Zhao T, Zhang R, et al. New insights into the role of macrophages in cancer immunotherapy. Front Immunol. 2024;15:1381225. doi: 10.3389/fimmu.2024.1381225.
[18]. Liu J, Geng X, Hou J, et al. New insights into M1/M2 macrophages: key modulators in cancer progression. Cancer Cell Int. 2021;21(1):389. doi: 10.1186/s12935-021-02089-2.
[19]. Larionova I, Tashireva L. Immune gene signatures as prognostic criteria for cancer patients. Ther Adv Med Oncol. 2023;15:17588359231189436. doi: 10.1177/17588359231189436.
[20]. Duan Z, Luo Y. Targeting macrophages in cancer immunotherapy. Signal Transduct Target Ther. 2021;6(1):127. doi: 10.1038/s41392-021-00506-6
[21]. Chen S, Saeed A, Liu Q, et al. Macrophages in immunoregulation and therapeutics. Signal Transduct Target Ther. 2023;8(1):207. doi: 10.1038/s41392-023-01452-1.
[22]. Rabbie R, Ferguson P, Molina-Aguilar C, et al. Melanoma subtypes: genomic profiles, prognostic molecular markers and therapeutic possibilities. J Pathol. 2019;247(5):539-551. doi: 10.1002/path.5213.
Cite this article
Shi,T. (2025). Cellular and Molecular Biomarkers to Predict Immunotherapy Outcomes in Melanoma Patients. Theoretical and Natural Science,111,77-88.
Data availability
The datasets used and/or analyzed during the current study will be available from the authors upon reasonable request.
Disclaimer/Publisher's Note
The statements, opinions and data contained in all publications are solely those of the individual author(s) and contributor(s) and not of EWA Publishing and/or the editor(s). EWA Publishing and/or the editor(s) disclaim responsibility for any injury to people or property resulting from any ideas, methods, instructions or products referred to in the content.
About volume
Volume title: Proceedings of ICBioMed 2025 Symposium: AI for Healthcare: Advanced Medical Data Analytics and Smart Rehabilitation
© 2024 by the author(s). Licensee EWA Publishing, Oxford, UK. This article is an open access article distributed under the terms and
conditions of the Creative Commons Attribution (CC BY) license. Authors who
publish this series agree to the following terms:
1. Authors retain copyright and grant the series right of first publication with the work simultaneously licensed under a Creative Commons
Attribution License that allows others to share the work with an acknowledgment of the work's authorship and initial publication in this
series.
2. Authors are able to enter into separate, additional contractual arrangements for the non-exclusive distribution of the series's published
version of the work (e.g., post it to an institutional repository or publish it in a book), with an acknowledgment of its initial
publication in this series.
3. Authors are permitted and encouraged to post their work online (e.g., in institutional repositories or on their website) prior to and
during the submission process, as it can lead to productive exchanges, as well as earlier and greater citation of published work (See
Open access policy for details).
References
[1]. Shajari N, Baradaran B, Tohidkia MR, et al. Advancements in Melanoma Therapies: From Surgery to Immunotherapy. Curr Treat Options Oncol. 2024;25(8):1073-1088. doi: 10.1007/s11864-024-01239-8.
[2]. He X, Deng H, Liu W, et al. Advances in Understanding Drug Resistance Mechanisms and Innovative Clinical Treatments for Melanoma. Curr Treat Options Oncol. 2024;25(12):1615-1633. doi: 10.1007/s11864-024-01279-0.
[3]. Kuryk L, Bertinato L, Staniszewska M, et al. From Conventional Therapies to Immunotherapy: Melanoma Treatment in Review. Cancers (Basel). 2020;12(10). doi: 10.3390/cancers12103057.
[4]. Pollack LA, Li J, Berkowitz Z, et al. Melanoma survival in the United States, 1992 to 2005. J Am Acad Dermatol. 2011;65(5 Suppl 1):S78-86. doi: 10.1016/j.jaad.2011.05.030.
[5]. Tumeh PC, Harview CL, Yearley JH, et al. PD-1 blockade induces responses by inhibiting adaptive immune resistance. Nature. 2014;515(7528):568-71. doi: 10.1038/nature13954.
[6]. Larkin J, Chiarion-Sileni V, Gonzalez R, et al. Five-Year Survival with Combined Nivolumab and Ipilimumab in Advanced Melanoma. N Engl J Med. 2019;381(16):1535-1546. doi: 10.1056/NEJMoa1910836.
[7]. Wolchok JD, Chiarion-Sileni V, Rutkowski P, et al. Final, 10-Year Outcomes with Nivolumab plus Ipilimumab in Advanced Melanoma. N Engl J Med. 2025;392(1):11-22. doi: 10.1056/NEJMoa2407417.
[8]. Huang AC, Zappasodi R. A decade of checkpoint blockade immunotherapy in melanoma: understanding the molecular basis for immune sensitivity and resistance. Nat Immunol. 2022;23(5):660-670. doi: 10.1038/s41590-022-01141-1.
[9]. Zafar SY, Abernethy AP. Financial toxicity, Part I: a new name for a growing problem. Oncology (Williston Park). 2013;27(2):80-1, 149.
[10]. Zheng Z, Jemal A, Han X, et al. Medical financial hardship among cancer survivors in the United States. Cancer. 2019;125(10):1737-1747. doi: 10.1002/cncr.31913.
[11]. Chen S, Zhou Z, Li Y, et al. Application of single-cell sequencing to the research of tumor microenvironment. Front Immunol. 2023;14:1285540. doi: 10.3389/fimmu.2023.1285540.
[12]. Butler A, Hoffman P, Smibert P, et al. Integrating single-cell transcriptomic data across different conditions, technologies, and species. Nat Biotechnol. 2018;36(5):411-420. doi: 10.1038/nbt.4096.
[13]. Noy R, Pollard JW. Tumor-associated macrophages: from mechanisms to therapy. Immunity. 2014;41(1):49-61. doi: 10.1016/j.immuni.2014.06.010.
[14]. Sade-Feldman M, Yizhak K, Bjorgaard SL, et al. Defining T Cell States Associated with Response to Checkpoint Immunotherapy in Melanoma. Cell. 2018;175(4):998-1013 e20. doi: 10.1016/j.cell.2018.10.038.
[15]. Shirley CA, Chhabra G, Amiri D, et al. Immune escape and metastasis mechanisms in melanoma: breaking down the dichotomy. Front Immunol. 2024;15:1336023. doi: 10.3389/fimmu.2024.1336023.
[16]. Passarelli A, Mannavola F, Stucci LS, et al. Immune system and melanoma biology: a balance between immunosurveillance and immune escape. Oncotarget. 2017;8(62):106132-106142. doi: 10.18632/oncotarget.22190.
[17]. Zhou L, Zhao T, Zhang R, et al. New insights into the role of macrophages in cancer immunotherapy. Front Immunol. 2024;15:1381225. doi: 10.3389/fimmu.2024.1381225.
[18]. Liu J, Geng X, Hou J, et al. New insights into M1/M2 macrophages: key modulators in cancer progression. Cancer Cell Int. 2021;21(1):389. doi: 10.1186/s12935-021-02089-2.
[19]. Larionova I, Tashireva L. Immune gene signatures as prognostic criteria for cancer patients. Ther Adv Med Oncol. 2023;15:17588359231189436. doi: 10.1177/17588359231189436.
[20]. Duan Z, Luo Y. Targeting macrophages in cancer immunotherapy. Signal Transduct Target Ther. 2021;6(1):127. doi: 10.1038/s41392-021-00506-6
[21]. Chen S, Saeed A, Liu Q, et al. Macrophages in immunoregulation and therapeutics. Signal Transduct Target Ther. 2023;8(1):207. doi: 10.1038/s41392-023-01452-1.
[22]. Rabbie R, Ferguson P, Molina-Aguilar C, et al. Melanoma subtypes: genomic profiles, prognostic molecular markers and therapeutic possibilities. J Pathol. 2019;247(5):539-551. doi: 10.1002/path.5213.