


1. Introduction
White cliffs, formed by micro-organisms in the sea, have been an iconic landscape along the south coast of England since the Cretaceous Period. They are mainly made of limestone and are erosion-prone by seawater in the English Channel. A study finds that England contributes 30% of the erosion that damages 17% of the UK coastline [1]. Therefore, there is a requirement for a dynamic model of cliff erosion to show coastal processes.
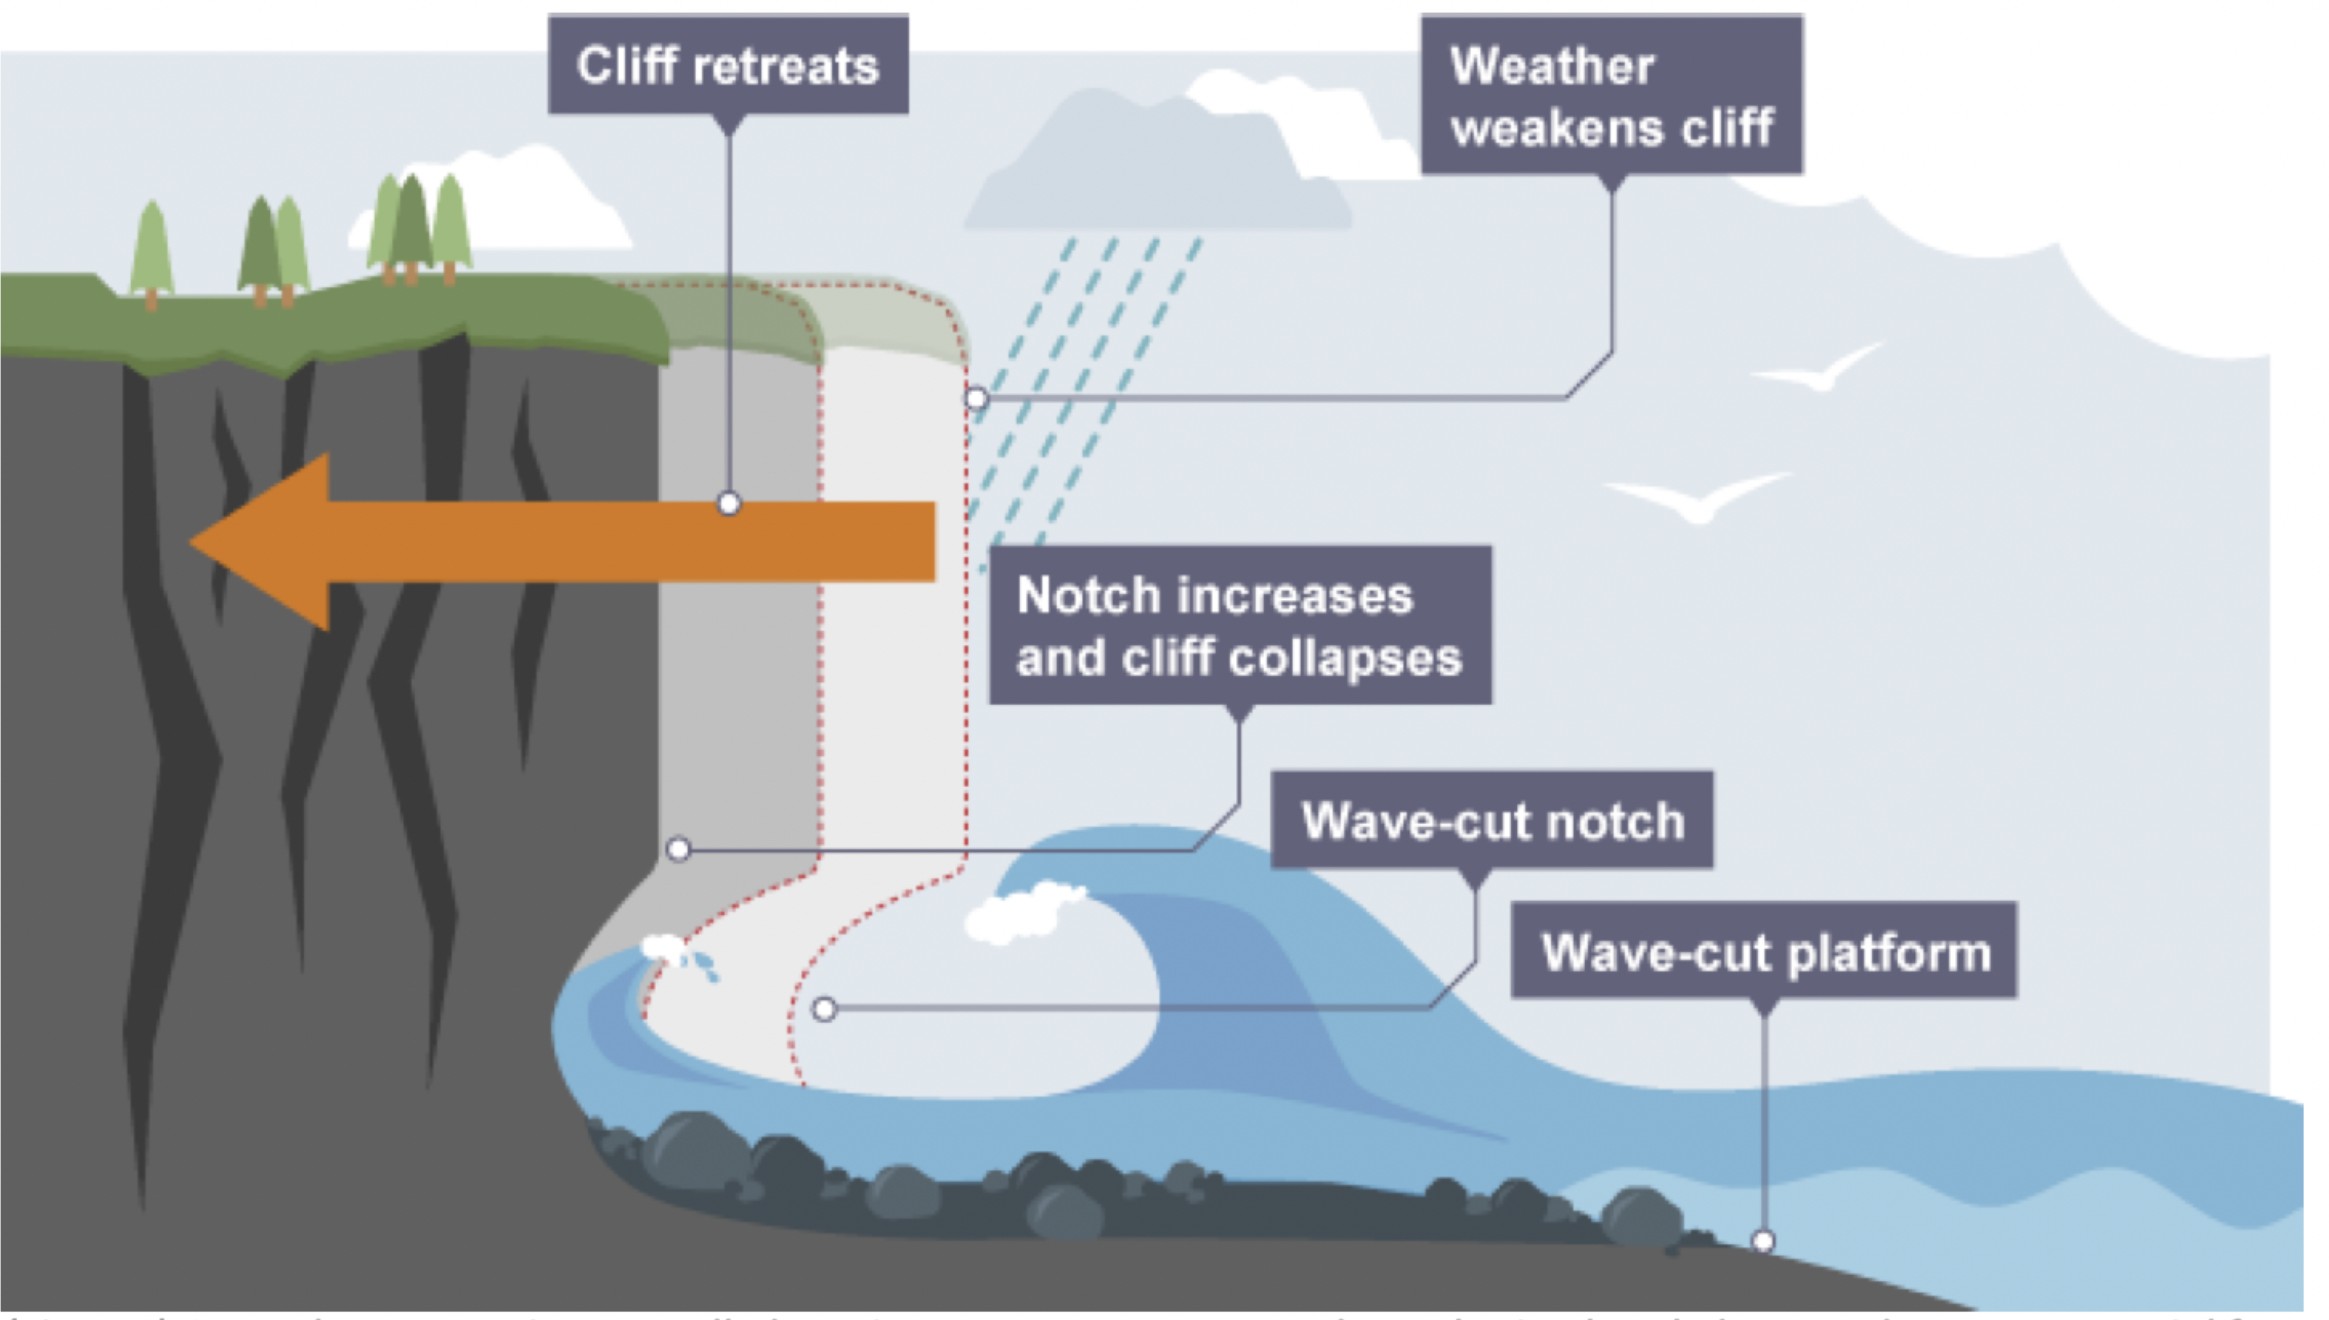
The wave-cut platform model involves various physical and geological processes. Its unique traits are shaped by complex coastal erosion, abrasion, and hydraulic action. In hydraulic ac- tion, the waves crash against the cliffs and push air into the cracks with enormous pressure, especially during storms. This compressed air pushes out parts of the cliff face. During abra- sion, pebbles grind along the rock platforms and form a north face shaped by the waves. The lack of foundation leads to the collapse and retreat of the cliff.
Waves transport water and sediment and cause the physical erosion of rock surfaces. The speed of erosion depends on factors such as wave energy, height, period, and material type. The Shoreline Erosion Index expresses the relationship between wave strength, energy per unit time, and erosion, taking into account wave height, period, and other parameters.
2. Materials and methods
2.1. Testing the erosion rate with 10Be
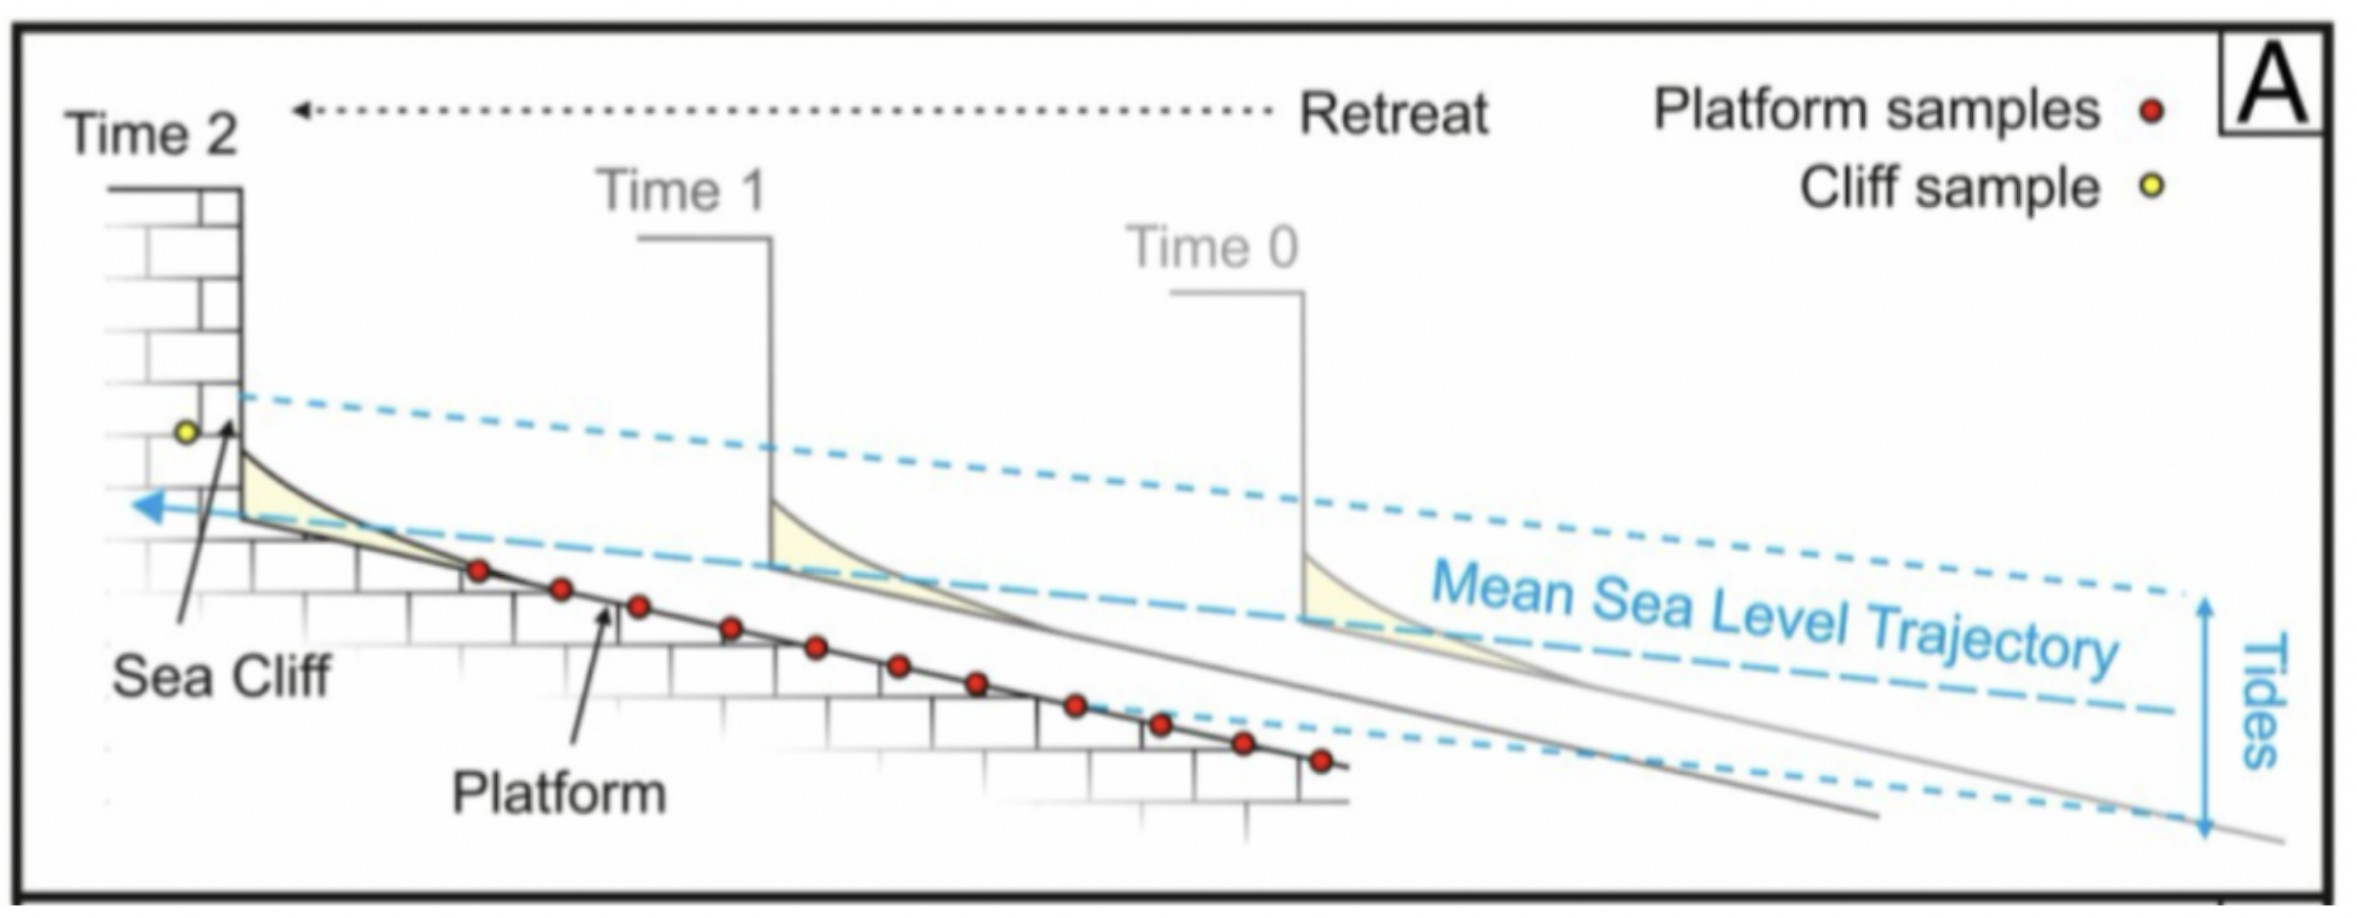
The first stage in creating predictive models for future coastal change is figuring out how quickly coasts have eroded in the past and what causes coastal change. 10Be is the formation of an exposed rocky platform when the cliff recedes. Analysing in situ 10Be concentrations on rocky coasts helped researchers predict cliff retreat rates and understand Quaternary exposure, inheritance, and reoccupation of coastal platforms [3]. The model (Figure 2) suggests that coastline profile changes due to equilibrium retreat, with cliff height, platform gradient, and beach width remaining constant [4]. Research in East Sussex, UK, shows that soft chalk cliffs have eroded at rates ranging from 2–6 cm·yr−1 over 7,000 years to 10–80 cm·yr−1 over 150 years [5], indicating a need for investigation into the cause.
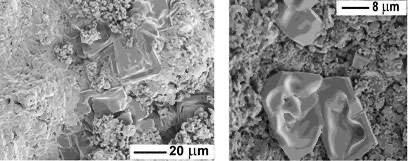
Meanwhile, researchers have discovered that coastal cliffs are collapsing due to the formation of salt crystals in chalk samples. The strength of coastline samples was 20–55% lower than quarry samples [6], indicating salt as the main cause of the weakness. These crystals, created when saltwater evaporates, distort the rock’s shape, weakening the structure and causing the cliff to collapse. The study also raises questions about how salinity accelerates erosion.
2.2. Salt crystallisation: Conservation model in the boussinesq equation
Salt stresses and strains rocks in three main ways: volume change due to hydration, temperature- induced salt crystal expansion, and crystal formation from solution. Salt crystals can expand due to water absorption and thus create stresses in the rock. The salt concentration in the capil- laries of the rock can lead to decomposition in places with strong diurnal fluctuations. Coastal cliffs absorb a lot of salt from bubbles and sea spray [7].
The salt conservation model considers the salinity distribution in water bodies over time and space. The change in the amount of salt is equal to the sum of the salt fluxes due to currents
and diffusion, which result from the conservation of mass and diffusion processes, by using the following formula:
 (1)
(1)
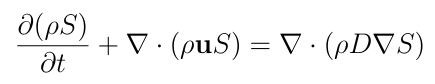
This full form accounts for variable density ρ and spatially varying salinity S.
Under the Boussinesq approximation, where density variations are assumed negligible, this simplifies to [8]:
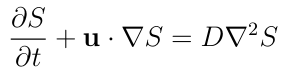 (2)
(2)
This is a mathematical framework used to describe the temporal and spatial variations of salinity (or solute concentration) in water bodies. In this equation, S stands for salinity, which varies both temporally and spatially, whereas t stands for time. The fluid velocity vector u describes the water movement, and ∇ stands for the gradient operator, which expresses spatial gradients. D, the diffusion coefficient, characterises the diffusion of salinity due to differences in concentration. The left-hand side describes the development of salinity over time, while the right-hand side reveals the contributing factors. The first term, u · ∇S, accounts for convective effects caused by fluid movement and represents spatial transport. The second term, D∇2S, shows how salinity moves through space because of differences in concentration. It does this by using the Laplacian operator (∇2), which represents spatial diffusion.
This equation is applicable for characterising the changes in saltwater concentration in the English Channel, especially when both the fluid movement and the diffusion processes induced by the concentration gradients play a significant role. The solution of this equation facilitates the simulation of the dynamic evolution of salinity in the channel and provides an understand- ing of how different factors affect the distribution of salinity. Notably, particular simulations necessitate suitable initial conditions, boundary conditions, and parameter values; furthermore, the resolution may require the use of numerical methods.
3. Results
3.1. Salt weathering in different seasons causes different erosion rate
In line with the previously discussed equations and additional data, the English Channel shows remarkable regional differences in late winter (February). The western region has higher surface salinity (35.3) and higher temperatures (9–10°C), while the eastern side has lower salin- ity (35.0) and cooler temperatures (6–6.5°C), a correlation consistent with observed seasonal patterns. In summer (August), there is a slight decrease in salinity (0.1–0.3) with a simultane- ous increase in temperature (15–17°C), which corresponds to the expected climatic changes. East of 2°W, tidal mixing provides a uniform temperature and salinity, while west of 3°W, a distinct thermocline is evident, limiting summer bottom temperatures to 10–11°C [9]. In ad- dition, the tidal waves penetrate from the Atlantic to the English Channel. The tidal range is greater on the south side of the strait due to the Earth’s rotation and the topography. Famous places are Saint-Marie on the French coast, Lobay and the Somme estuary. At spring tide, the tidal range can be up to 13.5 metres, and the tidal velocity in the Alderney Waterway is 5.0 metres per second [9].
During frost and salt crystallisation weathering, moisture is absorbed in the rock, which leads to decomposition and stresses. This can hydrate minerals, which leads to expansion and contraction and thus to cracks. These observations emphasise the seasonal dynamics and regional influences that characterise the hydrodynamics of the English Channel. It can be concluded that there is a risk of large collapses during extreme weather conditions, especially from February to March.
3.2. Limitations vs. improvements of the boussinesq approximation
The Boussinesq approximation, a useful tool to describe fluid dynamics, has its limitations due to the assumption of constant fluid density. This affects accuracy in scenarios with significant temperature or salinity gradients and is unsuitable for turbulent or unsteady flows. It is also only partially suitable for simulating shallow water waves and coastal conditions.
To overcome these limitations, researchers can use advanced fluid dynamics models to accu- rately capture density effects on fluid motion. The salt conservation model under the Boussi- nesq approximation requires a sophisticated approach, including Navier–Stokes equation, transport equations, and seawater mixing models. Validation methods can improve accuracy. This interdisciplinary approach, combining fluid dynamics, thermodynamics, and oceanographic principles, promises a refined understanding of dynamic salinity patterns in the English Chan- nel.
4. Implications
4.1. Climate and sea level changes
White cliffs are usually made of limestone, rich in calcium carbonate (CaCO3), making them susceptible to erosion. Limestone eroded by acid in the sea can lead to the release of CO2 and help reduce ocean acidity. The following chemical reaction is:
CaCO3 (s) + 2HCl (aq) → CaCl2 (s) + H2O (aq) + CO2 (g) (3)
The increasing frequency of storms can also accelerate the erosion of limestone and influence carbon dynamics. This causes climate change and sea level changes directly.
4.2. Rock resistance and sediment transport
By calculating the erosion rate of the wave-cut platform, varied rock resistances can be de- termined. The link between rock properties and erosion rates, which includes salt-induced abrasion, may also be described numerically.
Sediment transport by waves, influenced by salt, significantly affects erosion and deposition processes on wave-cut platforms. During strong waves, sediments form a sandbar, transferring sand away from the beach and depositing it in deeper areas. As wave energy decreases, sediments on the sandbar are gradually pushed back onshore. This sediment movement process is crucial in shaping coastal landscapes, redistributing sand, and maintaining the dynamic equilibrium of the beach environment.
5. Conclusion
The study of erosion dynamics on rocky coasts with limestone formations reveals a complex interplay of geological, climatic, and anthropogenic factors. Limestone’s susceptibility to ero- sion, exacerbated by climate change, has potential CO2 implications. The wave-cut platform model emphasises hydraulic action, abrasion, and lack of foundations. The 10Be test method and salt preservation model under the Boussinesq approximation provide insights into historical erosion rates and salt’s influence on coastal stability. Understanding and mitigating coastal risks is crucial for climate change, sea level change, rock resilience, and sediment transport. Protective measures, such as vegetative cover, structural support, and beach nourishment, are essential. Future research can focus on refining models for complex meteorological and tidal conditions and investigating human impacts on coastal stability.
References
[1]. Rory N. Mortimore. Late cretaceous stratigraphy, sediments and structure: Gems of the dorset and east devon coast world heritage site (jurassic coast), england. Proceedings of the Geologists’ Association, pages 406–450, 2019.
[2]. BBC Bitesize. Cliffs and wave-cut platforms. https: //www.bbc.co.uk/ bitesize/guides/zt6r82p/revision/4, n.d. Accessed: 30 May 2025.
[3]. D.E. Granger, N.A. Lifton, and J.K. Willenbring. A cosmic trip: 25 years of cosmogenic nuclides in geology. Bulletin of the Geological Society of America, 125: 1379–1402, 2013.
[4]. Martin D. Hurst, Dylan H. Rood, Michael A. Ellis, Robert S. Anderson, and Uwe Dorn- busch. Recent acceleration in coastal cliff retreat rates on the south coast of great britain. Proceedings of the National Academy of Sciences, 113(47): 13336–13341, 2016.
[5]. U. Dornbusch, D.A. Robinson, C.A. Moses, and R.B.G. Williams. Temporal and spatial variations of chalk cliff retreat in east sussex, 1873 to 2001. Marine Geology, 249: 271–282, 2008.
[6]. H. Jarlett. Salt causes chalk cliffs to collapse. Natural Environment Research Council (NERC), 2013. Published: 19 April 2013.
[7]. A. S. Trenhail. Coastal dynamics and landfoffils. Clarendon Press, Oxford, 1987.
[8]. Ryan Abernathey. Equation of salt conservation, advection, diffusion laws, 2021. GitHub, Accessed: 30 May 2025.
[9]. Glory Fleet. Salinity data of the english channel. http: //www.gloryfleet.cn/ cyclopedia/english-channel.html, 2007. Accessed: 30 May 2025.
Cite this article
Zheng,X. (2025). Dynamics of Salinity and Erosion in Wave-Cut Platforms: Investigating White Cliffs in England Through the Lens of the Boussinesq Approximation. Theoretical and Natural Science,124,1-6.
Data availability
The datasets used and/or analyzed during the current study will be available from the authors upon reasonable request.
Disclaimer/Publisher's Note
The statements, opinions and data contained in all publications are solely those of the individual author(s) and contributor(s) and not of EWA Publishing and/or the editor(s). EWA Publishing and/or the editor(s) disclaim responsibility for any injury to people or property resulting from any ideas, methods, instructions or products referred to in the content.
About volume
Volume title: Proceedings of the 3rd International Conference on Mathematical Physics and Computational Simulation
© 2024 by the author(s). Licensee EWA Publishing, Oxford, UK. This article is an open access article distributed under the terms and
conditions of the Creative Commons Attribution (CC BY) license. Authors who
publish this series agree to the following terms:
1. Authors retain copyright and grant the series right of first publication with the work simultaneously licensed under a Creative Commons
Attribution License that allows others to share the work with an acknowledgment of the work's authorship and initial publication in this
series.
2. Authors are able to enter into separate, additional contractual arrangements for the non-exclusive distribution of the series's published
version of the work (e.g., post it to an institutional repository or publish it in a book), with an acknowledgment of its initial
publication in this series.
3. Authors are permitted and encouraged to post their work online (e.g., in institutional repositories or on their website) prior to and
during the submission process, as it can lead to productive exchanges, as well as earlier and greater citation of published work (See
Open access policy for details).
References
[1]. Rory N. Mortimore. Late cretaceous stratigraphy, sediments and structure: Gems of the dorset and east devon coast world heritage site (jurassic coast), england. Proceedings of the Geologists’ Association, pages 406–450, 2019.
[2]. BBC Bitesize. Cliffs and wave-cut platforms. https: //www.bbc.co.uk/ bitesize/guides/zt6r82p/revision/4, n.d. Accessed: 30 May 2025.
[3]. D.E. Granger, N.A. Lifton, and J.K. Willenbring. A cosmic trip: 25 years of cosmogenic nuclides in geology. Bulletin of the Geological Society of America, 125: 1379–1402, 2013.
[4]. Martin D. Hurst, Dylan H. Rood, Michael A. Ellis, Robert S. Anderson, and Uwe Dorn- busch. Recent acceleration in coastal cliff retreat rates on the south coast of great britain. Proceedings of the National Academy of Sciences, 113(47): 13336–13341, 2016.
[5]. U. Dornbusch, D.A. Robinson, C.A. Moses, and R.B.G. Williams. Temporal and spatial variations of chalk cliff retreat in east sussex, 1873 to 2001. Marine Geology, 249: 271–282, 2008.
[6]. H. Jarlett. Salt causes chalk cliffs to collapse. Natural Environment Research Council (NERC), 2013. Published: 19 April 2013.
[7]. A. S. Trenhail. Coastal dynamics and landfoffils. Clarendon Press, Oxford, 1987.
[8]. Ryan Abernathey. Equation of salt conservation, advection, diffusion laws, 2021. GitHub, Accessed: 30 May 2025.
[9]. Glory Fleet. Salinity data of the english channel. http: //www.gloryfleet.cn/ cyclopedia/english-channel.html, 2007. Accessed: 30 May 2025.