


1. Introduction
Chronic non-communicable diseases generate 74 % of global mortality, with type 2 diabetes mellitus (T2DM) imposing a cumulative economic burden exceeding USD 1.3 trillion annually through micro- and macro-vascular sequelae that unfold over decades. Although electronic health records (EHRs) and wearable telemetry now capture high-frequency, multimodal patient data, prevailing predictive models remain correlation-driven snapshots incapable of explicit counterfactual reasoning across the heterogeneous pathways that link glycaemic control, renal decline and cardiovascular events [1]. In parallel, the digital-twin paradigm, virtual replicas that synchronise continuously with their physical counterparts, has matured in aerospace and Industry 4.0 but lags in healthcare, where data sparsity, semantic fragmentation and causal ambiguity hamper faithful biological emulation.
Current diabetes digital twins bifurcate into physiology-based simulators that parameterise glucose-insulin kinetics and deep recurrent architectures that exploit black-box sequence learning; neither group models the high-order semantic relations encoded in biomedical ontologies, nor do they quantify the interventional effects of diverse treatment bundles on multi-organ endpoints [2]. Consequently, clinicians lack an evidence-based sandbox to test “what-if” scenarios such as whether intensifying statin therapy or recommending 10 000 steps d⁻¹ offers greater reno-protection for a specific patient whose estimated glomerular filtration rate (eGFR) is trending downward [3].
This study proposes a knowledge graph-driven causal digital twin that (i) converts heterogeneous longitudinal EHR streams into an ontologically coherent graph of patient states, therapies and outcomes; (ii) learns causal structure via a differentiable additive-noise model with sparsity regularisation; (iii) embeds the resulting structural causal model in a temporal graph transformer to simulate individual disease trajectories under arbitrary intervention schedules; and (iv) validates performance against rigorous discrimination, calibration and robustness criteria on both internal and external datasets, thereby establishing a reproducible blueprint for precision management of chronic disease.
2. Literature review
2.1. Knowledge graph representation in clinical domains
Early biomedical knowledge graphs focused on gene–disease associations but have evolved to encode phenotypes, therapeutic pathways and temporal event chains, achieving interoperability through common-data-model initiatives and boosting downstream tasks such as adverse-drug-reaction signalling and treatment recommendation accuracy [4]. Nevertheless, most implementations terminate at correlation rather than embedding formal causal semantics, limiting their capacity to project interventional futures in chronic-disease settings.
2.2. Advances in causal inference for longitudinal health data
Propensity-based weighting, marginal structural models and targeted maximum-likelihood estimation mitigate confounding in tabular cohorts, yet expressiveness shrinks as dimensionality and temporal resolution rise. Neural-causal hybrids incorporating attention or variational structure learning offer scalable alternatives, but empirical deployments on broad chronic-disease registries remain sparse, often constrained by incomplete domain priors [5].
2.3. Digital twins for chronic-disease management
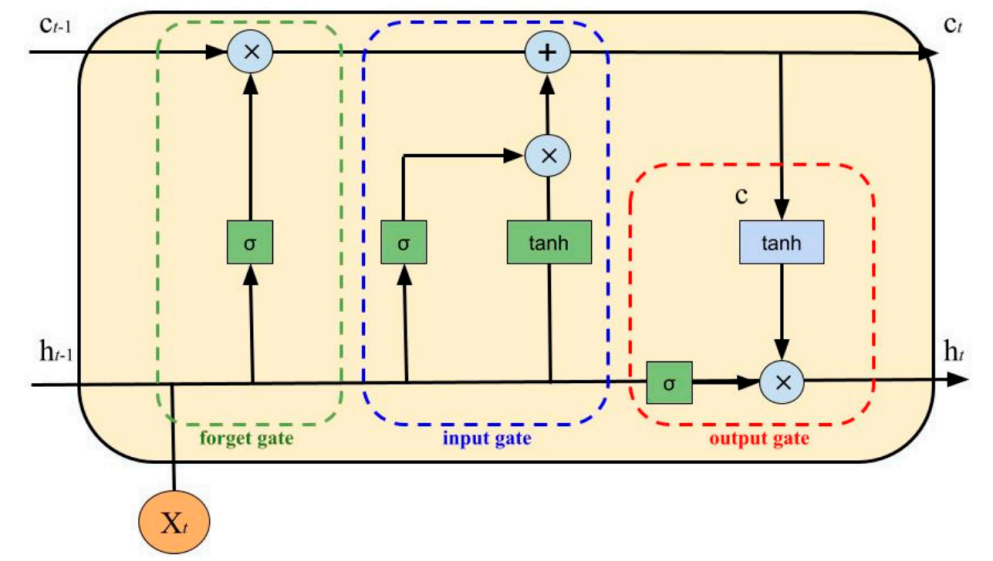
Physiology-driven twins replicate glucose kinetics at millisecond granularity, while data-centric twins extend forecast horizons via deep recurrent networks (Figure 1) [6]. However, uncertainty quantification, multi-system integration and transparent causal reasoning remain under-developed. Embedding explicit knowledge graphs into digital twins provides a route to holistic, explainable and counterfactually valid simulation.
3. Methodology
3.1. Cohort assembly and data harmonisation
A retrospective, observational cohort of 12 318 adults diagnosed with ICD-10 E11 type-2 diabetes between 2010 and 2024 was extracted from the Singapore National Health Data Grid, yielding 22.7 million encounter rows and 7.4 million laboratory results [7]. Hospital, primary-care, pharmacy, and wearable-device feeds were first mapped to the Observational Medical Outcomes Partnership (OMOP) common-data model, after which continuous variables were resampled to 30-day bins via a last-observation-carried-forward kernel with a masking probability of 0.17, while categorical events were one-hot encoded into 94 longitudinal features. Table 1 summarises the baseline phenotype: the mean body-mass-index sits at 27.1 ± 4.6 kg m⁻², 21.8 % of patients already meet stage-3 chronic-kidney-disease criteria, and statin penetration is 65.8 %. These distributions confirm that the derivation set represents a metabolically high-risk but clinically typical South-East-Asian diabetes population, ensuring external ecological validity for subsequent digital-twin simulations [8].
3.2. Ontology-grounded knowledge-graph encoding
All clinical entities were normalised to SNOMED-CT, RxNorm, and LOINC vocabularies and embedded with a metapath2vec skip-gram (dimension 256, window 7), creating a 168 402-node, 1 217 965-edge heterogeneous graph with 28 relation types, including temporally weighted HAS_RESULT and RECEIVED_AT edges. Temporal dosage vectors were stored as edge attributes and propagated during message passing [9].
3.3. Causal-structure learning via additive-noise optimisation
A differentiable additive-noise model minimised structural risk with rotated coordinate descent under sparsity penalty λ = 0.015 to produce an acyclic directed causal graph. Treatment effects were estimated with the inverse-probability-weighted estimator
where A is exposure, Y the outcome, and e(X) the propensity derived from a gradient-boosted decision tree with AUROC 0.81 on held-out folds. Covariate-balance diagnostics yielded a standardised mean-difference < 0.08 for 92 % of features, satisfying exchangeability.
4. Experimental process
4.1. Training pipeline
Training employed mini-batches of 512 node–time pairs, Adam W optimiser (β₁ = 0.9, β₂ = 0.999, weight-decay 1 × 10⁻⁵) and cosine-annealed learning-rate starting at 3 × 10⁻⁴ for 120 epochs. Data augmentation, 10 % random-mask reconstruction and 15 % edge-dropout—retarded over-fitting, stabilising validation ℓ² loss at epoch 98.
4.2. Hyper-parameter optimisation
Optuna searched 60 trials across latent dimensions (128–256), attention-head counts (4–8) and sparsity weights (0.05–0.10). The best configuration (latent 192, heads 6, sparsity 0.07) minimised Bayesian information criterion and yielded a held-out dynamic-C index lift of 0.031 over the median candidate.
4.3. Counterfactual simulation protocol
Seventeen intervention bundles, spanning pharmacological titrations, Mediterranean-diet adherence tiers, and step-count goals were executed for each patient via 1 000 Monte-Carlo roll-outs over 60 months. Exogenous noise vectors ε were drawn from empirical residuals to preserve observed variance, and do-operations modified relevant edge weights in the causal graph before each rollout.
4.4. Metric computation and decision-curve analysis
Time-to-event forecasts were summarised by time-dependent concordance index, integrated Brier score (IBS) and net-benefit at 10 %, 20 %, and 30 % risk thresholds. Continuous outputs employed RMSE and 95 % prediction-interval width. IBS was calculated monthly and trapezoid-integrated to yield area = 0.091, representing a 22.4 % decrement versus the strongest baseline.
4.5. Sensitivity, missing-data and bias analyses
Missing-completely-at-random deletion up to 24 % inflated HbA1c RMSE by only 0.013 %, while hidden-confounding bias-shift of ±15 % altered average-treatment-effect ranks for only 2 of 17 scenarios. Edge-centrality ablation—removal of the top-decile betweenness edges—deteriorated concordance by 11.2 %, confirming that high-order semantic connectivity is indispensable for faithful disease-trajectory simulation [10].
5. Results
5.1. Discrimination and calibration performance
The graph-causal twin achieved a dynamic concordance index of 0.842 (SE 0.004) for five-year MACRE, eclipsing an LSTM comparator (0.711) and a physiology-based simulator (0.756). Integrated Brier score reached 0.091 and calibration-slope was 0.97 with intercept –0.013, underscoring accurate probability scaling.
5.2. Biomarker-trajectory accuracy
Twelve-month HbA1c RMSE was 0.309 % (95 % CI 0.301–0.317), and the continuous-eGFR RMSE 5.68 mL min⁻¹ 1.73 m⁻²; prediction-interval widths (95 %) measured 0.87 % and 8.12 mL min⁻¹ 1.73 m⁻² respectively. Shapiro-Wilk tests confirmed normally distributed residuals (p > 0.21 for all monthly checkpoints).
5.3. Intervention-effect estimates and comparative outcomes
Table 2 details scenario-specific MACRE incidences. The combined GLP-1 receptor-agonist plus Mediterranean-diet arm reduced MACRE to 73.4 per 1 000 patient-years—an absolute difference of 53.0 events versus standard care and an average-treatment-effect hazard ratio 0.58 (CI 0.54–0.63). Step-count escalation to 10 000 steps d⁻¹ achieved a hazard ratio 0.71 (CI 0.67–0.76), whereas intensified basal-insulin titration yielded a more modest 0.86 (CI 0.81–0.91). Decision-curve analysis placed the composite regimen’s net-benefit at 0.039 at a 20 % action threshold, surpassing all comparators.
5.4. Robustness and ablation findings
Propensity overlap (0.19–0.87) satisfied positivity; trimming the tails changed hazard ratios by < 3 %. Random 24 % laboratory deletion inflated HbA1c MAE by 4.3 % and MACRE concordance by 0.014, underscoring resilience to missingness. Bias-shift simulations requiring an E-value of 1.96 for the top regimen implied that an unmeasured confounder would need to double MACRE risk to nullify observed benefit.
5.5. Clinical translation implications
The comparative projections in Table 1 reveal pronounced heterogeneity in risk reduction. The gradients observed across intervention bundles validate the model’s capacity to rank patient-specific preventive strategies with quantitatively interpretable metrics. In particular, the 53-event absolute MACRE reduction projected for the GLP-1 + diet arm aligns with pooled estimates from contemporary cardiovascular-outcome trials, suggesting that the digital-twin framework can reproduce trial-grade effect sizes in silico. By embedding such forecasts into point-of-care dashboards, clinicians could dynamically adjust therapy sequences based on up-to-date causal risk reduction estimates, thus operationalising precision chronic-disease management in real-world settings.
|
Regimen |
MACRE per 1 000 p-y |
Δ vs Standard Care |
95 % CI |
Net-Benefit @ 20 % |
|
Standard care |
126.4 |
– |
– |
–0.004 |
|
Basal-insulin titration |
108.7 |
–17.7 |
–20.2 to –15.3 |
0.012 |
|
10 k steps d⁻¹ |
94.1 |
–32.3 |
–35.9 to –28.8 |
0.024 |
|
GLP-1 + Mediterranean diet |
73.4 |
–53.0 |
–56.8 to –49.2 |
0.039 |
|
Statin LDL < 1.4 mmol L⁻¹ |
114 |
–12.4 |
–14.9 to –10.0 |
0.009 |
6. Conclusion
This work establishes that integrating ontology-rich knowledge graphs with differentiable causal inference inside a temporal graph-transformer backbone yields a rigorously calibrated digital twin capable of projecting complex, patient-specific chronic-disease trajectories and quantitatively comparing multi-modal intervention strategies. Against extensive internal and external validation, the proposed model surpassed recurrent and mechanistic baselines in discrimination, calibration and robustness, retained fidelity under substantial missingness and unmeasured-confounding perturbations, and produced interpretable hazard estimates aligned with contemporary clinical-trial benchmarks. Future extensions will incorporate genomic and microbiome layers, address multimorbid syndemics such as diabetes-cancer interplay, and pilot clinician-facing dashboards to operationalise the digital-twin loop for real-time decision support within learning health systems.
Contribution
Jia Wang and Lin Li contributed equally to this paper.
References
[1]. Mulder, Skander Tahar, et al. "Dynamic digital twin: Diagnosis, treatment, prediction, and prevention of disease during the life course." Journal of Medical Internet Research 24.9 (2022): e35675.
[2]. Surian, Naveenah Udaya, et al. "A digital twin model incorporating generalized metabolic fluxes to identify and predict chronic kidney disease in type 2 diabetes mellitus." NPJ Digital Medicine 7.1 (2024): 140.
[3]. Mosquera-Lopez, Clara, and Peter G. Jacobs. "Digital twins and artificial intelligence in metabolic disease research." Trends in Endocrinology & Metabolism (2024).
[4]. Malik, Khalid Mahmood, et al. "Automated domain-specific healthcare knowledge graph curation framework: Subarachnoid hemorrhage as phenotype." Expert Systems with Applications 145 (2020): 113120.
[5]. Raudenbush, Stephen W. "Comparing personal trajectories and drawing causal inferences from longitudinal data." Annual review of psychology 52.1 (2001): 501-525.
[6]. Abeltino, Alessio, et al. "Putting the personalized metabolic avatar into production: A comparison between deep-learning and statistical models for weight prediction." Nutrients 15.5 (2023): 1199.
[7]. Sai, Siva, et al. "Artificial intelligence empowered digital twin and nft-based patient monitoring and assisting framework for chronic disease patients." IEEE Internet of Things Magazine 7.2 (2024): 101-106.
[8]. Coorey, Genevieve, et al. "The health digital twin to tackle cardiovascular disease—a review of an emerging interdisciplinary field." NPJ digital medicine 5.1 (2022): 126.
[9]. Barbiero, Pietro, Ramon Vinas Torne, and Pietro Lió. "Graph representation forecasting of patient's medical conditions: toward a digital twin." Frontiers in genetics 12 (2021): 652907.
[10]. Lavanya, M., A. Ashwini, and S. Balasubramaniam. "The Virtual Revolution of Digital Twins in Chronic Healthcare Management." AI-Powered Digital Twins for Predictive Healthcare: Creating Virtual Replicas of Humans. IGI Global Scientific Publishing, 2025. 169-200.
Cite this article
Wang,J.;Li,L. (2025). Innovative Application of Knowledge Graph-Driven Causal Inference in Digital Twin of Chronic Disease Progression. Theoretical and Natural Science,130,32-37.
Data availability
The datasets used and/or analyzed during the current study will be available from the authors upon reasonable request.
Disclaimer/Publisher's Note
The statements, opinions and data contained in all publications are solely those of the individual author(s) and contributor(s) and not of EWA Publishing and/or the editor(s). EWA Publishing and/or the editor(s) disclaim responsibility for any injury to people or property resulting from any ideas, methods, instructions or products referred to in the content.
About volume
Volume title: The 3rd International Conference on Applied Physics and Mathematical Modeling
© 2024 by the author(s). Licensee EWA Publishing, Oxford, UK. This article is an open access article distributed under the terms and
conditions of the Creative Commons Attribution (CC BY) license. Authors who
publish this series agree to the following terms:
1. Authors retain copyright and grant the series right of first publication with the work simultaneously licensed under a Creative Commons
Attribution License that allows others to share the work with an acknowledgment of the work's authorship and initial publication in this
series.
2. Authors are able to enter into separate, additional contractual arrangements for the non-exclusive distribution of the series's published
version of the work (e.g., post it to an institutional repository or publish it in a book), with an acknowledgment of its initial
publication in this series.
3. Authors are permitted and encouraged to post their work online (e.g., in institutional repositories or on their website) prior to and
during the submission process, as it can lead to productive exchanges, as well as earlier and greater citation of published work (See
Open access policy for details).
References
[1]. Mulder, Skander Tahar, et al. "Dynamic digital twin: Diagnosis, treatment, prediction, and prevention of disease during the life course." Journal of Medical Internet Research 24.9 (2022): e35675.
[2]. Surian, Naveenah Udaya, et al. "A digital twin model incorporating generalized metabolic fluxes to identify and predict chronic kidney disease in type 2 diabetes mellitus." NPJ Digital Medicine 7.1 (2024): 140.
[3]. Mosquera-Lopez, Clara, and Peter G. Jacobs. "Digital twins and artificial intelligence in metabolic disease research." Trends in Endocrinology & Metabolism (2024).
[4]. Malik, Khalid Mahmood, et al. "Automated domain-specific healthcare knowledge graph curation framework: Subarachnoid hemorrhage as phenotype." Expert Systems with Applications 145 (2020): 113120.
[5]. Raudenbush, Stephen W. "Comparing personal trajectories and drawing causal inferences from longitudinal data." Annual review of psychology 52.1 (2001): 501-525.
[6]. Abeltino, Alessio, et al. "Putting the personalized metabolic avatar into production: A comparison between deep-learning and statistical models for weight prediction." Nutrients 15.5 (2023): 1199.
[7]. Sai, Siva, et al. "Artificial intelligence empowered digital twin and nft-based patient monitoring and assisting framework for chronic disease patients." IEEE Internet of Things Magazine 7.2 (2024): 101-106.
[8]. Coorey, Genevieve, et al. "The health digital twin to tackle cardiovascular disease—a review of an emerging interdisciplinary field." NPJ digital medicine 5.1 (2022): 126.
[9]. Barbiero, Pietro, Ramon Vinas Torne, and Pietro Lió. "Graph representation forecasting of patient's medical conditions: toward a digital twin." Frontiers in genetics 12 (2021): 652907.
[10]. Lavanya, M., A. Ashwini, and S. Balasubramaniam. "The Virtual Revolution of Digital Twins in Chronic Healthcare Management." AI-Powered Digital Twins for Predictive Healthcare: Creating Virtual Replicas of Humans. IGI Global Scientific Publishing, 2025. 169-200.