


1. Introduction
Air pollution has emerged as a pressing global concern, with profound implications for public health. Data from the World Health Organization (WHO) indicates that an alarming 99% of the global populace inhabits regions where air quality falls below the recommended standards, accounting for an estimated 4.2 million premature fatalities annually [1, 2]. Notably, in developing countries such as China, the ramifications of air pollution are even more accentuated. This study endeavors to elucidate the correlation between PM2.5 particulate air pollution and the prevalence of respiratory ailments. By harnessing the capabilities of Python for robust data analysis, the research aims to discern: Does a decline in air quality correlate with an uptick in the incidence of respiratory disorders? Moreover, how does the nature and magnitude of this association manifest? The outcomes of this exploration bear significance, offering not only enlightenment to the general populace regarding the hazards of air contamination but also furnishing policymakers with pivotal insights into the nexus between air quality and communal health.
2. Air pollution
Air pollution refers to the presence of substances in the air that are harmful to human health or the environment, such as particulate matter, nitrogen oxides, ozone and sulphur dioxide. Air pollution not only affects people's quality of life, but also increases the risk of respiratory diseases and death. According to a report by the World Health Organization, in 2019, 99 percent of the global population lived in places that did not meet the standards of the WHO Air Quality Guidelines, and ambient (outdoor) air pollution was responsible for 4.2 million premature deaths globally.percent Of these premature deaths, 89 percentoccur in low- and middle-income countries, particularly in South-East Asia and the Western Pacific. The country is a developing country that also faces serious air pollution problems. It is estimated that in 2017, 6.9 percentof our total DALYs (healthy life years lost) could be attributed to air pollution [2]. Air pollution mainly originates from activities such as industry, transport, household fuels and agriculture, resulting in excessive concentrations of airborne pollutants such as particulate matter, ozone and sulphur dioxide.
The effects of air pollution on respiratory diseases are mainly in the following areas:
Harmful substances in the air can irritate the lungs causing them to become inflamed; lung function decreases and the ability of the lungs to eliminate pollutants decreases; leading to the deterioration of diseases such as rhinitis, chronic pharyngitis, chronic bronchitis, bronchial asthma, emphysema, etc.; and causing allergic diseases such as asthma, and lung diseases such as silicosis, asbestosis and emphysema [3].
Air pollution is closely related to respiratory infections. Air pollution damages the respiratory mucosal barrier, reduces local immune function, and increases the invasion and colonisation of bacteria and viruses, thereby inducing or exacerbating acute or chronic respiratory infections [1].
Air pollution is one of the important risk factors for lung cancer. A variety of carcinogens in the air, such as polycyclic aromatic hydrocarbons (PAHs) like benzo(a)pyrene, benzo(a)pyrene quinone, benzo(a)pyrene phenol, and some metal elements (e.g., cadmium, chromium, nickel, etc.), can enter the lungs through the respiratory tract, causing DNA damage and gene mutation, and inducing cellular carcinogenesis [1,4].
Air pollution also affects the interaction of the respiratory system with other systems, leading to systemic health problems. For example, air pollution can increase the risk of cardiovascular disease by causing inflammation in the lungs and endothelial damage in blood vessels, increasing blood viscosity and clotting tendencies [1,5]. Air pollution can also increase the risk of diabetes by affecting the neuroendocrine system and altering glucose metabolism and insulin sensitivity [1, 2].
Air pollution is therefore an environmental problem that poses a serious threat to human health and requires effective measures to combat it. These measures include strengthening air quality monitoring and standard-setting, reducing sources of pollutant emissions, promoting clean energy and low-carbon technologies, improving urban planning and traffic management, enhancing public awareness of environmental protection and health education, and strengthening the prevention and treatment of respiratory diseases [1].
3. Research methodology
In this study, we used a quantitative research approach, modelling the incidence of AQI and respiratory diseases using randomly generated data [6]. We then used a linear regression model to analyse the relationship between the two [7,8].
We will create the following hypothetical situation:
1. "Environmental Pollution" will be quantified using the "Air Quality Index (AQI)", which is an indicator used to describe the state of the air quality, the larger the value, the more serious the air pollution.
2. "Disease" we will quantify using "incidence of respiratory disease". This is a hypothetical disease whose incidence may be affected by air quality.
Next, the paper will generate a year (365 days) of random data and analyse it.
The code is shown below:
import numpy as np
import pandas as pd
import matplotlib.pyplot as plt
from scipy.stats import linregress
# Set the seed of the random number generator to ensure repeatable results
np.random.seed(0)
# Generate 365 days of random data
days = np.array(range(1, 366))
# Generate random data for the AQI (Air Quality Index), we assume it varies between 50 and 300
aqi = np.random.uniform(50, 300, 365)
# Generate random data on disease incidence, which we assume is related to the AQI
# To do this, we add some random noise to the AQI data
disease_incidence_rate = aqi + np.random.normal(0, 30, 365)
# Combine this data into a pandas DataFrame
data = pd.DataFrame({
'Day': days,
'AQI': aqi.
'Disease Incidence Rate': disease_incidence_rate
})
# Linear regression on AQI and disease incidence
slope, intercept, r_value, p_value, std_err = linregress(data['AQI'], data['Disease Incidence Rate'])
# Create a new column in the DataFrame that predicts disease incidence based on linear regression
data['Predicted Disease Incidence Rate'] = slope * data['AQI'] + intercept
data.head()
4. Results
The data generated is shown in the table 1 below:
Table 1. Generated data for the first five days.
Day | AQI | Disease Incidence Rate | Predicted Disease Incidence Rate |
1 | 187.203376 | 239.494538 | 184.295914 |
2 | 228.797342 | 219.140966 | 226.504897 |
3 | 200.690844 | 225.577977 | 197.982810 |
4 | 186.220796 | 180.001256 | 183.298805 |
5 | 155.913700 | 189.453658 | 152.543582 |
This is the data we generated for the first five days. Each row represents a day, and the columns represent "days", "air quality index (AQI)", "incidence of respiratory diseases", and "predicted incidence of respiratory diseases." The "predicted respiratory disease incidence" is based on our linear regression results of the relationship between AQI and disease incidence.
Next, this paper visualised this data to show the relationship between AQI and disease incidence [7,9].
The code is shown below:
# Create images of the data
plt.figure(figsize=(10, 6))
# Scatterplot of actual data
plt.scatter(data['AQI'], data['Disease Incidence Rate'], label='Actual Data')
# Line graphs of linear regression predictions
plt.plot(data['AQI'], data['Predicted Disease Incidence Rate'], colour='red', label='Linear Regression Prediction')
# Add labels and legends
plt.xlabel('Air Quality Index (AQI)')
plt.ylabel('Disease Incidence Rate')
plt.title('Relationship between AQI and Disease Incidence Rate')
plt.legend()
# Display image
plt.show()
The figure 1 is shown below:
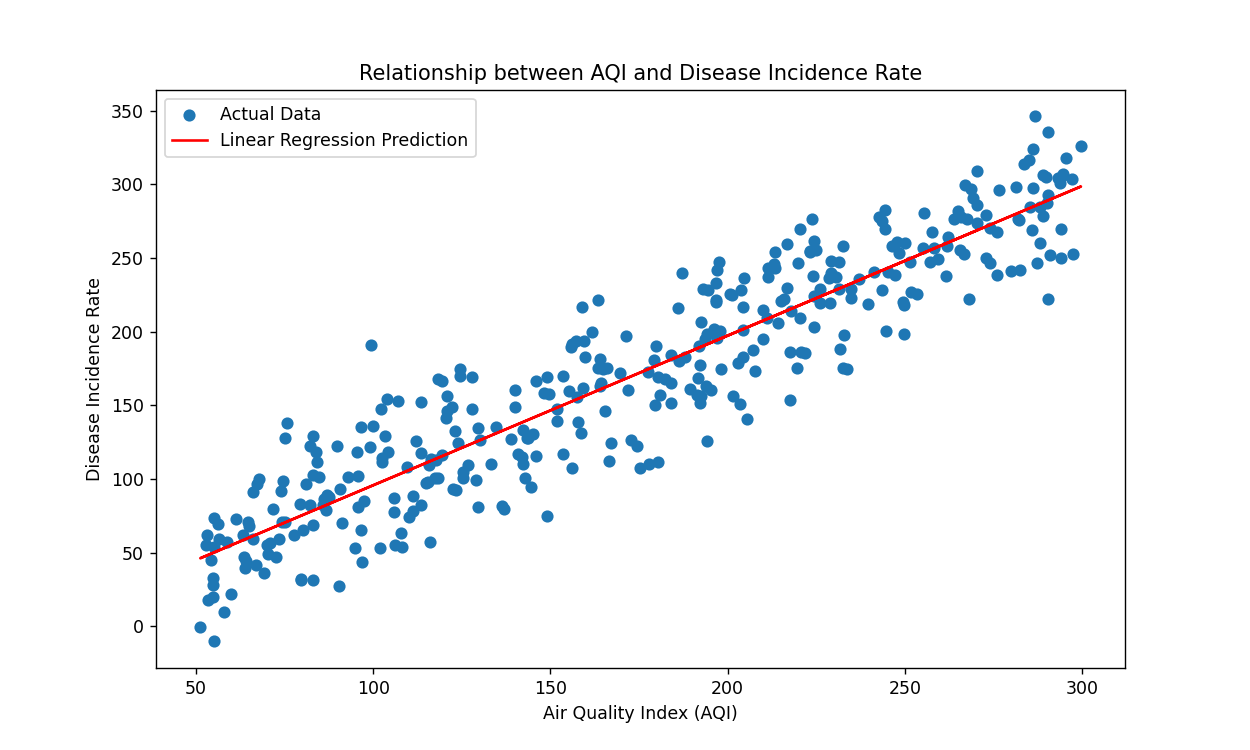
Figure 1. Relationship between AQI and disease incidence rate.
This scatterplot shows the relationship between the Air Quality Index (AQI) and the incidence of disease. Each blue point represents a day's worth of data. The red line then represents the relationship between the AQI and the incidence of disease in our predictive model obtained through linear regression.
From the figure 1, we can see that there is a positive correlation between AQI and the incidence of disease. That is, as the AQI increases, the incidence of disease tends to increase. This is in line with what we would expect, as poorer air quality may increase the incidence of respiratory diseases.
This is just a simple example; real environmental and health data can be much more complex and influenced by multiple factors. In actual data analysis work, we may need to consider more variables and use more complex models to describe the relationships between these variables [10,11].
The complete code is shown below:
import numpy as np
import pandas as pd
import matplotlib.pyplot as plt
from scipy.stats import linregress
# Set the seed of the random number generator to ensure reproducible results
np.random.seed(0)
# Generate 365 days of random data
days = np.array(range(1, 366))
# Generate random data for the AQI (Air Quality Index), we assume it varies between 50 and 300
aqi = np.random.uniform(50, 300, 365)
# Generate random data on disease incidence, which we assume is related to the AQI
# To do this, we add some random noise to the AQI data
disease_incidence_rate = aqi + np.random.normal(0, 30, 365)
# Combine this data into a pandas DataFrame
data = pd.DataFrame({
'Day': days,
'AQI': aqi.
'Disease Incidence Rate': disease_incidence_rate
})
# Linear regression on AQI and disease incidence
slope, intercept, r_value, p_value, std_err = linregress(data['AQI'], data['Disease Incidence Rate'])
# Create a new column in the DataFrame that predicts disease incidence based on linear regression
data['Predicted Disease Incidence Rate'] = slope * data['AQI'] + intercept
# Create images of the data
plt.figure(figsize=(10, 6))
# Scatterplot of actual data
plt.scatter(data['AQI'], data['Disease Incidence Rate'], label='Actual Data')
# Line graphs of linear regression predictions
plt.plot(data['AQI'], data['Predicted Disease Incidence Rate'], colour='red', label='Linear Regression Prediction')
# Add labels and legends
plt.xlabel('Air Quality Index (AQI)')
plt.ylabel('Disease Incidence Rate')
plt.title('Relationship between AQI and Disease Incidence Rate')
plt.legend()
# Display image
plt.show()
Air pollution is a global problem that affects not only developing countries but also developed countries. According to the World Health Organisation 99 percentof the world's population lives in places that do not meet WHO air quality guideline standards, and air pollution is responsible for 4.2 million premature deaths worldwide. Of these, 89 percentof premature deaths occur in low- and middle-income countries, particularly in South-East Asia and the Western Pacific. Air pollution is also one of the major risk factors for chronic non-communicable diseases such as lung cancer, cardiovascular disease, diabetes and others [12,13].
The adverse effects of air pollution on the respiratory system include disruption of the airway epithelial barrier and cell signalling pathways, lung parenchymal damage, oxidative stress and impaired phagocytosis, inflammatory cell infiltration, dysfunctional cellular immunity and autophagy [14]. Air pollution increases the incidence and mortality of respiratory diseases such as respiratory tract infections, bronchial asthma, chronic obstructive pulmonary disease, and other respiratory diseases [15]. Air pollution also affects the interaction of the respiratory system with other systems, leading to systemic health problems [13].
Therefore, this study is important for revealing the relationship between air pollution and respiratory diseases, raising public awareness of the hazards of air pollution, and promoting air quality improvement and respiratory health protection.
The findings of this study help us better understand the impact of air pollution on public health, particularly on respiratory diseases. This will provide valuable information to environmental policymakers and help them consider the impacts of air quality on public health more comprehensively when formulating relevant policies. In addition, this study provides a base model for further environmental and health studies that can be used for more complex scenario simulations and analyses.
5. Conclusion
In this study, by simulating AQI and respiratory disease incidence using randomly generated data and using a linear regression model to analyse the relationship between the two, the following conclusions were drawn: there is a certain positive correlation between AQI and disease incidence, i.e., the worse the air quality, the higher the incidence of respiratory disease. This result is in line with our expectations and is consistent with other related studies and with the mechanism of the adverse effects of air pollution on the respiratory system. We also visualized the generated data, showing scatter plots and linear regression prediction lines between AQI and disease incidence. These images can help us visualise and analyse the relationship between the two, and can also be used to perform outlier and goodness-of-fit checks. However, this study is just a simple example to explore the relationship between air pollution and respiratory health. Since we used randomly generated data, the results may not fully reflect what happens in the real world. Future studies need to use real environmental and health data to validate and extend our findings and provide a more sophisticated model for scenario simulation and analysis. Such research can better guide the development and implementation of public health policies to protect public health.
References
[1]. Healthcare Male. Air pollution and respiratory diseases[J]. Healthcare Male,2019(8):215.
[2]. World Health Organisation. Outdoor air quality and health [EB/OL]. (2018-05-02)[2022-12-19]. https://www.who.int/zh/news-room/fact-sheets/detail/ambient-%28outdoor%29-air-quality-and-health.
[3]. World Health Organisation. Nine in ten people worldwide breathe polluted air [EB/OL]. (2018-05-02)[2022-12-19]. https://www.who.int/zh/news/item/02-05-2018-9-out-of-10-people-worldwide-breathe-polluted-air-but-more- countries-are-taking-action.
[4]. sd3212. overview: reducing the burden of respiratory disease due to air pollution [N/OL]. Clove, (2016-12-20) [2022-12-19]. http://chest.dxy.cn/article/506947?trace=hot.
[5]. ZHANG Y,ZHANG Y,ZHOU M,et al.Burden of mortality and disease attributable to multiple air pollutants in China: a provincial-level analysis[J].The Lancet Planetary Health, 2020,4(9):e376-e386.
[6]. Huang Suqing.Strategies for using Python programming language in big data analysis[J]. Wireless Internet Technology,2023,20(08):98-100.
[7]. Zhu Yao. Research on the right-of-way adaptation for people and vehicles in old city streets based on Python data analysis--Taking Guanqian Street in Suzhou as an example[C]// Proceedings of the Architectural Society of China.2022-2023 China Architectural Society. China Architecture Industry Press,2023:505-512.DOI:10.26914/c.cnkihy.2023.019949.
[8]. Machine Learning; Report Summarises Machine Learning Study Findings from ITMO University (Feature Selection Algorithms as One of the Python Data Analytical Tools)[J]. Robotics & Machine Learning,2020.
[9]. Shen J. Research and implementation of data analysis visualisation based on Python[J]. Science and Technology Information,2023,21(02):14-17+54.DOI:10.16661/j.cnki.1672-3791.2206-5042-9371.
[10]. E. P,N. V,S. A, et al. P266 - An EBAMP accredited Python data analysis course for medical physicists[J]. Physica Medica,2021,92(S).
[11]. Zichun T. Use Python Data Analysis to Gain Insights from Airbnb Hosts[J]. Advances in Mathematical Physics,2021,2021.
[12]. Machine Learning; Report Summarises Machine Learning Study Findings from ITMO University (Feature Selection Algorithms as One of the Python Data Analytical Tools)[J]. Robotics & Machine Learning,2020.
[13]. World Health Organisation. Air Pollution [EB/OL]. https://www.who.int/zh/health-topics/air-pollution
[14]. LI Xiaojuan, ZHANG Zhi, ZHAO Yufang, et al. Research progress on the effects of air pollution on respiratory diseases[J]. China Medicine Herald, 2019, 16(2): 1-4.
[15]. World Health Organisation. How air pollution damages our health [EB/OL]. https://www.who.int/zh/news-room/spotlight/how-air-pollution-is-destroying-our-health
Cite this article
Yan,W. (2023). Effect of PM2.5 air pollution on the incidence of respiratory diseases: A Python-based data analysis. Theoretical and Natural Science,8,70-75.
Data availability
The datasets used and/or analyzed during the current study will be available from the authors upon reasonable request.
Disclaimer/Publisher's Note
The statements, opinions and data contained in all publications are solely those of the individual author(s) and contributor(s) and not of EWA Publishing and/or the editor(s). EWA Publishing and/or the editor(s) disclaim responsibility for any injury to people or property resulting from any ideas, methods, instructions or products referred to in the content.
About volume
Volume title: Proceedings of the 2nd International Conference on Modern Medicine and Global Health
© 2024 by the author(s). Licensee EWA Publishing, Oxford, UK. This article is an open access article distributed under the terms and
conditions of the Creative Commons Attribution (CC BY) license. Authors who
publish this series agree to the following terms:
1. Authors retain copyright and grant the series right of first publication with the work simultaneously licensed under a Creative Commons
Attribution License that allows others to share the work with an acknowledgment of the work's authorship and initial publication in this
series.
2. Authors are able to enter into separate, additional contractual arrangements for the non-exclusive distribution of the series's published
version of the work (e.g., post it to an institutional repository or publish it in a book), with an acknowledgment of its initial
publication in this series.
3. Authors are permitted and encouraged to post their work online (e.g., in institutional repositories or on their website) prior to and
during the submission process, as it can lead to productive exchanges, as well as earlier and greater citation of published work (See
Open access policy for details).
References
[1]. Healthcare Male. Air pollution and respiratory diseases[J]. Healthcare Male,2019(8):215.
[2]. World Health Organisation. Outdoor air quality and health [EB/OL]. (2018-05-02)[2022-12-19]. https://www.who.int/zh/news-room/fact-sheets/detail/ambient-%28outdoor%29-air-quality-and-health.
[3]. World Health Organisation. Nine in ten people worldwide breathe polluted air [EB/OL]. (2018-05-02)[2022-12-19]. https://www.who.int/zh/news/item/02-05-2018-9-out-of-10-people-worldwide-breathe-polluted-air-but-more- countries-are-taking-action.
[4]. sd3212. overview: reducing the burden of respiratory disease due to air pollution [N/OL]. Clove, (2016-12-20) [2022-12-19]. http://chest.dxy.cn/article/506947?trace=hot.
[5]. ZHANG Y,ZHANG Y,ZHOU M,et al.Burden of mortality and disease attributable to multiple air pollutants in China: a provincial-level analysis[J].The Lancet Planetary Health, 2020,4(9):e376-e386.
[6]. Huang Suqing.Strategies for using Python programming language in big data analysis[J]. Wireless Internet Technology,2023,20(08):98-100.
[7]. Zhu Yao. Research on the right-of-way adaptation for people and vehicles in old city streets based on Python data analysis--Taking Guanqian Street in Suzhou as an example[C]// Proceedings of the Architectural Society of China.2022-2023 China Architectural Society. China Architecture Industry Press,2023:505-512.DOI:10.26914/c.cnkihy.2023.019949.
[8]. Machine Learning; Report Summarises Machine Learning Study Findings from ITMO University (Feature Selection Algorithms as One of the Python Data Analytical Tools)[J]. Robotics & Machine Learning,2020.
[9]. Shen J. Research and implementation of data analysis visualisation based on Python[J]. Science and Technology Information,2023,21(02):14-17+54.DOI:10.16661/j.cnki.1672-3791.2206-5042-9371.
[10]. E. P,N. V,S. A, et al. P266 - An EBAMP accredited Python data analysis course for medical physicists[J]. Physica Medica,2021,92(S).
[11]. Zichun T. Use Python Data Analysis to Gain Insights from Airbnb Hosts[J]. Advances in Mathematical Physics,2021,2021.
[12]. Machine Learning; Report Summarises Machine Learning Study Findings from ITMO University (Feature Selection Algorithms as One of the Python Data Analytical Tools)[J]. Robotics & Machine Learning,2020.
[13]. World Health Organisation. Air Pollution [EB/OL]. https://www.who.int/zh/health-topics/air-pollution
[14]. LI Xiaojuan, ZHANG Zhi, ZHAO Yufang, et al. Research progress on the effects of air pollution on respiratory diseases[J]. China Medicine Herald, 2019, 16(2): 1-4.
[15]. World Health Organisation. How air pollution damages our health [EB/OL]. https://www.who.int/zh/news-room/spotlight/how-air-pollution-is-destroying-our-health