


1. Introduction
Concrete is the most important and widely used material in civil engineering all over the world and consists of four main ingredients: cement, water, coarse and fine aggregates [1]. Mixed ingredients provide concrete with the advantages of excellent load-bearing capacity, durability and cost-effectiveness.
Concrete strength is a critical indicator to assess its performance, directly influencing the stability, safety, and service life of structures [2]. Therefore, accurate prediction of concrete strength is of vital importance for structural design, construction quality control, and safe operation during the engineering service phase.
Traditionally, the prediction of concrete strength heavily relied on laboratory experiments, involving time-consuming curing processes and subsequent sample testing, which proved to be laborious and costly. Another approach is making empirical regression. However, the concrete compressive strength is a highly nonlinear function of age and ingredients, so it is quite difficult to conduct the regression method to get the accurate results. The third way is to use numerical simulation, which also has disadvantages of being time-consuming and inaccurate [3].
With advancements in science and technology, disciplines like data science and machine learning have provided new solutions for concrete strength prediction. Leveraging advanced predictive models and data analysis techniques enables rapid and precise forecasting of concrete strength at an early stage or after construction, offering crucial decision-making insights for engineering projects and operations.
Markov Chain Monte Carlo (MCMC) and Gaussian Process Regression (GPR) are versatile and potent statistical techniques that find utility across diverse data analysis tasks. MCMC excels in its ability to explore intricate probability distributions and conduct Bayesian inference, making it well-suited for situations where exact solutions are challenging or infeasible [4,5]. On the other hand, GPR stands out in capturing nonlinear relationships, high-dimensional patterns, and small sample data. Its non-parametric nature and ability to model uncertainty render it particularly useful for regression tasks where data points may exhibit intricate and nontrivial interactions [6]. Both MCMC and GPR offer valuable insights into data-driven analyses, and their combined application holds the potential to enhance predictive accuracy and uncover deeper insights from complex datasets.
Hence, this paper aims to explore and investigate concrete strength prediction by adopting Markov Chain Monte Carlo method and Gaussian Process Regression models. Through the construction of effective predictive models and the analysis and evaluation of prediction outcomes, we strive to provide reliable and efficient decision support for concrete engineering design, construction, and operation, thereby advancing scientific development and technological innovation in the field of concrete engineering.
2. Data Processing
2.1. Data Discription
A dataset consisting of 1030 observations was sourced from Kaggle Datasets. The dataset includes information on 7 key ingredients (kg/m3): cement, slag, ash, water, superplastic, coarse aggregates, and fine aggregates. Additionally, the dataset contains values for the age (d) and strength of concrete samples (MPa). The objective is to utilize the content composition and age data to predict the concrete strength. Presented below are details from the first five rows of the dataset.
Table 1. First five rows of the dataset.
cement | slag | ash | water | superplastic | coarseagg | fineagg | age | strength | |
0 | 141.3 | 212.0 | 0.0 | 203.5 | 0.0 | 971.8 | 748.5 | 28 | 29.89 |
1 | 168.9 | 42.2 | 124.3 | 158.3 | 10.8 | 1080.8 | 796.2 | 14 | 23.51 |
2 | 250.0 | 0.0 | 95.7 | 187.4 | 5.5 | 956.9 | 861.2 | 28 | 29.22 |
3 | 266.0 | 114.0 | 0.0 | 228.0 | 0.0 | 932.0 | 670.0 | 28 | 45.85 |
4 | 154.8 | 183.4 | 0.0 | 193.3 | 9.1 | 1047.4 | 696.7 | 28 | 18.29 |
Statistical information of data is shown in Table 2.
Table 2. Statistical information of data.
cement | slag | ash | water | Super-plastic | coarseagg | fineagg | age | strength | |
Count | 1030 | 1030 | 1030 | 1030 | 1030 | 1030 | 1030 | 1030 | 1030 |
Mean | 281.2 | 73.9 | 54.2 | 181.6 | 6.2 | 972.9 | 773.6 | 45.7 | 35.8 |
Std | 104.5 | 86.3 | 64.0 | 21.4 | 6.0 | 77.8 | 80.2 | 63.2 | 16.7 |
Min | 102.0 | 0.0 | 0.0 | 121.8 | 0.0 | 801.0 | 594.0 | 1.0 | 2.33 |
max | 540.0 | 359.4 | 200.0 | 247.0 | 32.2 | 1145.0 | 992.6 | 365.0 | 82.60 |
2.2. Feature engineering
Feature engineering plays a pivotal role in enhancing the predictive power of machine learning models. In the realm of concrete strength prediction, three innovative features have been introduced, demonstrating a significant impact on concrete strength: water-cement ratio, water-binder ratio, and sand ratio. These additional features are derived from the original data according to the equations (1) to (3) and are carefully designed to capture significant aspects of concrete composition and performance.
\( {r_{\frac{w}{c}}} =\frac{{m_{w}}}{{m_{c}}}\ \ \ \ \ \ (1) \)
\( {r_{\frac{w}{b}}} =\frac{{m_{w}}}{{m_{c}}+{m_{s}}+{m_{a}}}\ \ \ \ \ \ (2) \)
\( {r_{s}}=\frac{{m_{fa}}}{{m_{fa}}+{m_{ca}}}\ \ \ \ \ \ (3) \)
Where \( {r_{w/c}} \) , \( {r_{w/c}} \) and \( {r_{s}} \) denote water-cement ratio, water-binder ratio and sand ratio respectively. \( {m_{w}} \) , \( {m_{c}} \) , \( {m_{s}} \) , \( {m_{a}} \) , \( {m_{fa}} \) and \( {m_{ca}} \) denote kilograms per cubic meter for water, cement, slag, ash, fine aggregate and coarse aggregate respectively.
Following the incorporation of these features, it becomes imperative to assess the interrelationships between variables within the dataset. The exploration of data correlation serves as a fundamental step in understanding the complex interactions among different attributes. In order to acquire the prediction of strength, this analysis involves generating scatter plots that visually depict the pairwise relationships between strength and other 11 variables (as shown in Fig.1). By examining the distribution and trends exhibited in these plots, we gain a comprehensive understanding of how changes in one feature may impact the strength of concrete.
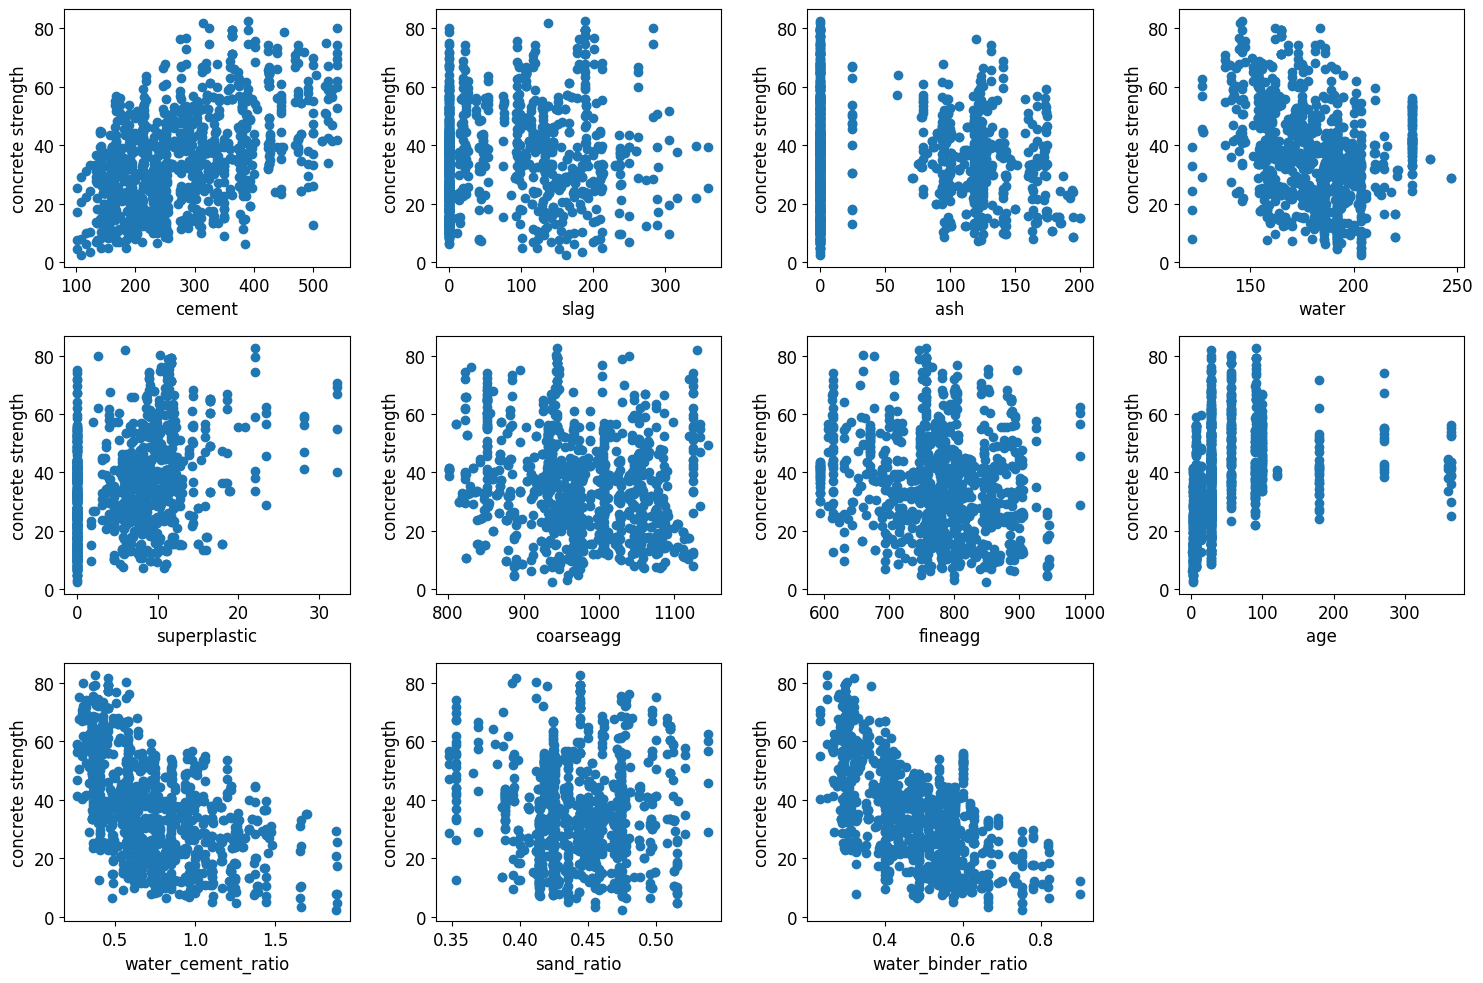 Figure 1. Scatter plots of concrete strength and 11 variables.
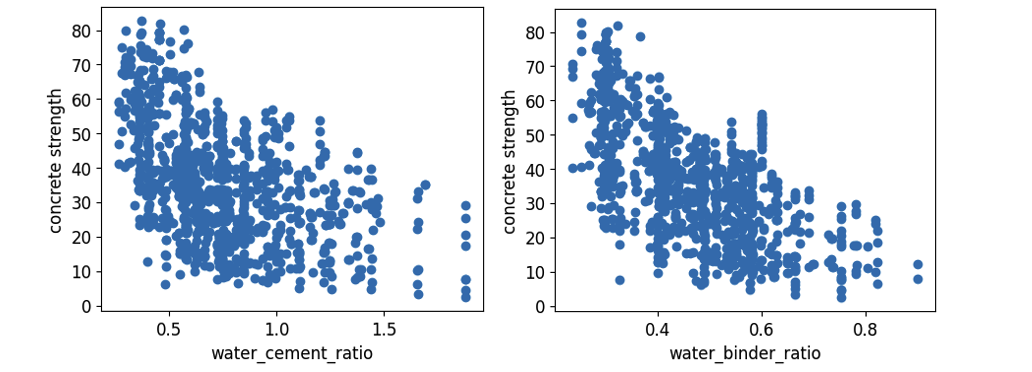
Based on the correlation plots, it is evident that concrete strength exhibits a significant correlation with both the water-binder ratio and the water-cement ratio, displaying similar inverse relationships (as shown in Fig. 2). This phenomenon can be attributed to the similarities in their respective calculation formulas.
|
Figure 2. Scatter diagrams between concrete strength and water-cement ratio and water-binder ratio. |
2.3. Data Normalization
In this study, all independent variables were subjected to data normalization, transforming them into distributions with a mean of 0 and a variance of 1. However, the dependent variable, concrete strength, was not subjected to normalization. Furthermore, during the process of splitting the dataset into training and testing sets, the standardization procedure applied to the training set was utilized to normalize the testing set as well. This approach ensured consistent and comparable transformations across both the training and testing data subsets.
3. Modeling
3.1. Inference and modelling
3.1.1. Markov Chain Monte Carlo (MCMC). Markov Chain Monte Carlo is a powerful technique used for sampling probability distributions, particularly widely applied in Bayesian statistics. MCMC is designed to address complex sampling problems involving probability distributions that may be challenging to solve using traditional numerical or analytical methods [7].
MCMC is used for establishing the relationship between concrete strength and water-cement ratio, water-binder ratio. The formula is assumed as equation (5):
\( {f_{c}}=a*{r^{-b}}+ε\ \ \ \ \ \ (5) \)
where a and \( b \) are unknown parameters, \( {f_{c}} \) is concrete strength, \( r \) is \( {r_{w/c}} \) or \( {r_{w/b}} \) , and \( ε \) is error respectively.Priors play a crucial role in Bayesian modelling. In the study, a and b are both positive. Strength is assumed to follow a normal distribution with mean \( a×{r^{-b}} \) and standard deviation \( σ \) , which is positive. Exponential distribution with \( λ=1 \) is adopted to describe \( a \) , \( b \) and \( σ \) .
\( {f_{c}} ~ N(a*{r^{-b}},{σ^{2}})\ \ \ \ \ \ (6) \)
\( a,b,σ ~ Exp(1)\ \ \ \ \ \ (7) \)
3.1.2. Gaussian Process Regression (GPR). Gaussian Process Regression is a non-parametric model within the Bayesian framework, commonly employed for nonlinear modeling. Rooted in probability theory, this model introduces randomness explicitly, enabling the seamless fusion of prior knowledge with learned insights from observed data. Through Bayesian inference, it diminishes uncertainty and yields estimates imbued with probabilistic significance. GPR is characterized by strong generalization ability, simplicity in model training, adaptive hyperparameters, interpretability, and robustness. It is particularly suitable for addressing regression problems involving nonlinearity, high dimensions, and small sample sizes [8], quite suitable for the prediction of concrete strength. GPR not only delivers accurate concrete strength predictions but also provides uncertainty information, aiding engineers and decision-makers in risk assessment and reliable project planning. The basic function is:
\( f(x) ~ GP(m(x),K(x,{x^{ \prime }}))\ \ \ \ \ \ (8) \)
where \( m(x) \) is mean function and \( K(x,{x^{ \prime }}) \) is covariance function. The detailed derivation of GPR is provided in [9].
Kernel functions play a pivotal role in GPR when modeling the relationships between variables. A kernel function, also known as a covariance function, defines the similarity or correlation between data points in the input space. It encapsulates the underlying structure of the data and allows GPR to make flexible and adaptive predictions. A diverse range of kernel functions can be employed in GPR, each having its own characteristics and implications for modeling various patterns in the data. Radial Basis Function (RBF) kernels and Matern kernels are selected in equations (9) and (10).
\( k({x_{i}},{x_{j}})=exp{(-\frac{{d({x_{i}},{x_{j}})^{2}}}{2{l^{2}}})}\ \ \ \ \ \ (9) \)
\( k({x_{i}},{x_{j}})=\frac{1}{Γ(ν){2^{ν-1}}}{(\frac{\sqrt[]{2ν}}{l}d({x_{i}},{x_{j}}))^{ν}}{K_{ν}}(\frac{\sqrt[]{2ν}}{l}d({x_{i}},{x_{j}}))\ \ \ \ \ \ (10) \)
where \( d({x_{i}},{x_{j}}) \) is the Euclidean distance, \( l \) is length scale, \( {K_{ν}}(·) \) is a modified Bessel function and \( Γ(·) \) is the gamma function respectively [10].
RBF kernels, also known as Gaussian kernels, are characterized by their smoothness and the ability to capture local patterns. These kernels are defined by a length scale parameter that determines the range of influence between data points. Variants of the RBF kernel, with different amplitudes and length scales, can be utilized to adapt to various data characteristics.
Matern kernels are a versatile class of kernels that offer a flexible trade-off between smoothness and roughness in modeling. They are parameterized by the nu parameter, which controls the degree of smoothness. When nu is set to 0.5, the Matern kernel is equivalent to the absolute exponential kernel, exhibiting a sharp and non-smooth behavior. In contrast, higher values of nu (e.g., 1.5 or 2.5) result in smoother functions with differentiable transitions.
3.2. Modeling results
3.2.1. MCMC. The estimates of \( a \) , \( b \) and \( σ \) after 10000 draws are demonstrated in Fig. 1. The mean values of three parameters using water-cement ratio are 26.887, 0.656 and 13.795 respectively, while the mean values of three parameters using water-binder ratio are 14.650, 1.069 and 12.753 respectively. The predicted strength is compared with the true strength in a scatter figure as shown in Fig. 4. The magnitude of \( σ \) represents the dispersion of the model, where a lower dispersion indicates a better fit. As the model utilizing the water-binder ratio exhibits a lower \( σ \) , it implies that the water-binder ratio is more capable than the water-cement ratio in capturing variations in concrete strength. This observation is further supported by its lower R2, reinforcing this notion.
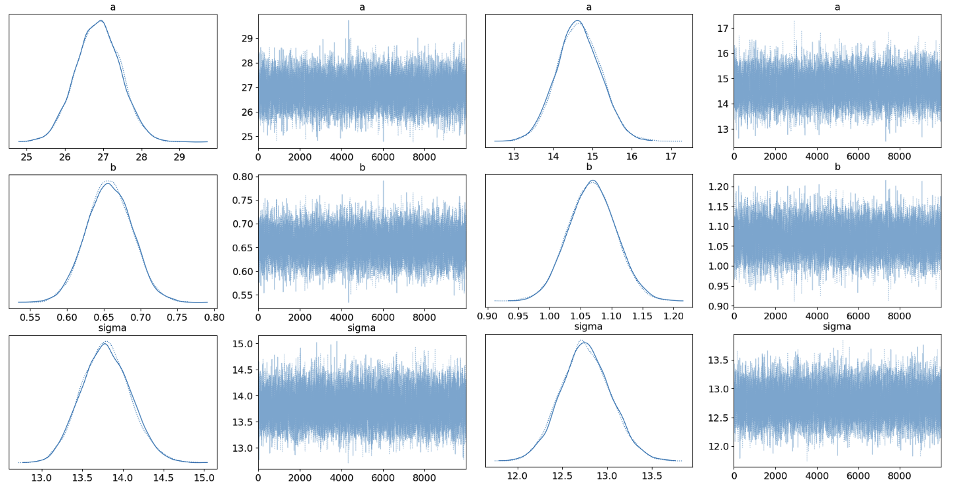
Figure 3. Trace figures using water-cement ratio and water-binder ratio.
Table 3. Sampling results of using water-cement ratio and water-binder ratio.
Water-cement ratio | Water-binder ratio | |||
mean | \( σ \) | mean | \( σ \) | |
\( a \) | 26.887 | 0.570 | 14.650 | 0.564 |
\( b \) | 0.656 | 0.030 | 1.069 | 0.039 |
\( σ \) | 13.795 | 0.303 | 12.753 | 0.281 |
R2 | 0.31 | 0.41 | ||
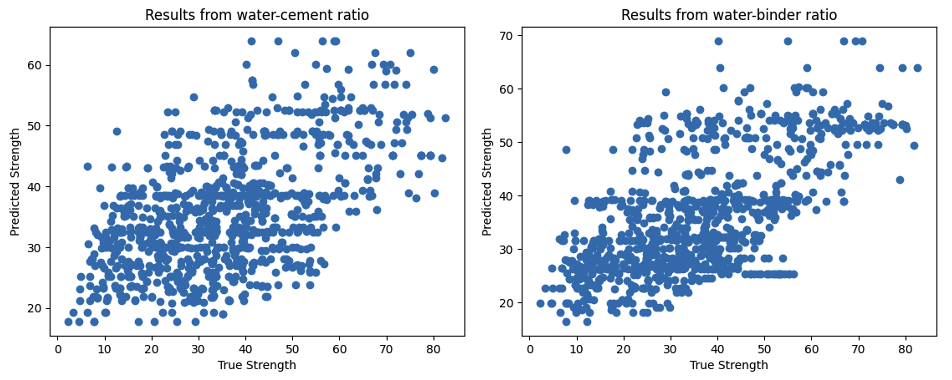 Figure 4. Comparing figure using water-cement ratio and water-binder ratio.
3.2.2. Gaussian Process Regression. The dataset is partitioned into training and testing sets, and various kernels are evaluated for their performance on the training sets. Among the kernels compared, the Matern kernel with a nu value of 0.5 emerges as the most effective choice. The Matern kernel offers a flexible framework that balances the trade-off between smoothness and robustness in modeling complex relationships. The choice of nu=0.5 strikes a balance between capturing both short-range and long-range dependencies in the data. Subsequently, the selected model is applied to the test sets, yielding insightful outcomes depicted in Fig. 5. The coefficient of determination (R2) attains a commendable value of 0.99 and 0.89 in training and testing sets respectively, underscoring the model's robust predictive capabilities.
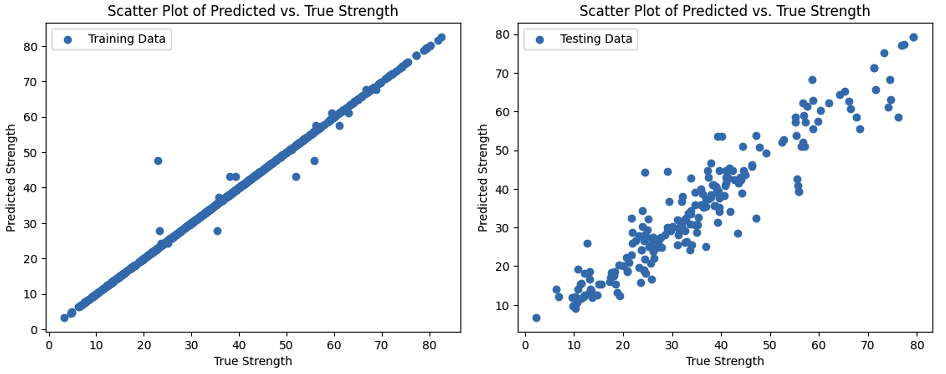 Figure 5. Scatter plot of predicted and true strength in training and testing sets.
4. Conclusions
Footnotes should be avoided whenever possible. If required they should be used only for brief notes that do not fit conveniently into the text.
This paper introduces two distinct approaches for predicting concrete strength. The first method employs Markov Chain Monte Carlo (MCMC) to discern the intricate relationships between concrete strength and the water-cement ratio, as well as the water-binder ratio. These ratios, both displaying an inverse relationship with strength, are investigated through assumed formulas and a comprehensive sampling of 10,000 iterations. The analysis reveals that the water-binder ratio emerges as the more influential factor, attributed to its notably lower standard deviation of error and a higher R2.
However, MCMC, relying on a single feature, falls short of achieving precise strength predictions, highlighting the complexity of deriving accurate formulas when multiple features interact. To address the challenge of nonlinearity, high-dimensional spaces, and limited sample sizes, the paper turns to the Gaussian Process Regression (GPR). Through a strategic division of data into training and testing sets, GPR systematically assesses various kernel functions, culminating in the selection of the optimal kernel for testing data. This meticulous process results in a R2 value of 0.89, signifying the model's substantial predictive capabilities.
While significant progress has been achieved in the realm of predicting concrete strength, it becomes apparent that further refinement and exploration are imperative to fully unravel the intricate web of multi-feature interactions. The incorporation of additional cross-features holds the promise of unveiling previously unrecognized relationships that could significantly enhance predictive accuracy.
Moreover, the combined utilization of both the MCMC and GPR holds the potential for a more comprehensive and robust predictive framework. The synergistic application of these techniques can harness the strengths of each approach, potentially mitigating the limitations inherent in singular methodologies. By leveraging the unique strengths of MCMC for uncovering feature correlations and GPR for tackling nonlinearity, high dimensions, and small sample sizes, a more comprehensive understanding of concrete strength prediction could be attained.
To address these challenges, future research endeavors might explore advanced techniques such as ensemble modeling, hybrid approaches, or the incorporation of domain-specific knowledge. Ultimately, a concerted effort to integrate diverse strategies and harness their collective power could pave the way for more accurate and reliable predictions of concrete strength, thereby elevating the field of construction and engineering.
References
[1]. Kumar, A., Arora, H.C., Kapoor, N.R., et al. Compressive Strength Prediction of Lightweight Concrete: Machine Learning Models. Sustainability. Vol. 14 (2022) No. 4, 2404.
[2]. Chou, J.S., Pham, A.D. Enhanced artificial intelligence for ensemble approach to predicting high performance concrete compressive strength. Construction and Building Materials. Vol. 49 (2013), p. 554–563.
[3]. Feng, D.C., Liu, Z.T., Wang X.D., et al. Machine learning-based compressive strength prediction for concrete: an adaptive boosting approach, Construction and Building Materials. Vol. 230 (2020), 117000.
[4]. Lee, S.Y. Bayesian nonlinear models for repeated measurement data: an overview, implementation, and applications. Mathematics. Vol. 10 (2022) No. 6, 898.
[5]. Hastings, W.K. Monte Carlo sampling methods using Markov chains and their applications. Biometrika. Vol 57 (1970) No. 1, p. 97–109.
[6]. Koriyama, T. An introduction of Gaussian processes and deep Gaussian processes and their applications to speech processing. Acoustical Science and Technology. Vol 41 (2020) No. 2, p. 457-464.
[7]. He, Z.K., Liu, G.B., Zhao, X.J., et al. Overview of Gaussian process regression. Control and Decision. Vol 28 (2013) No. 8, p. 1121-1129+1137.
[8]. Li, H. Statistical Learning Methods. Beijing: Tsinghua University Press, 2019.
[9]. Rasmussen, C.E., Williams C.K.I., Gaussian Processes for Machine Learning. Cambridge, Massachusetts: The MIT Press, 2006.
[10]. https://scikit-learn.org/stable/modules/generated/sklearn.gaussian_process.kernels.Matern.html
Cite this article
Zhang,D. (2023). Prediction of concrete strength using MCMC and GPR methods. Theoretical and Natural Science,9,54-61.
Data availability
The datasets used and/or analyzed during the current study will be available from the authors upon reasonable request.
Disclaimer/Publisher's Note
The statements, opinions and data contained in all publications are solely those of the individual author(s) and contributor(s) and not of EWA Publishing and/or the editor(s). EWA Publishing and/or the editor(s) disclaim responsibility for any injury to people or property resulting from any ideas, methods, instructions or products referred to in the content.
About volume
Volume title: Proceedings of the 3rd International Conference on Computing Innovation and Applied Physics
© 2024 by the author(s). Licensee EWA Publishing, Oxford, UK. This article is an open access article distributed under the terms and
conditions of the Creative Commons Attribution (CC BY) license. Authors who
publish this series agree to the following terms:
1. Authors retain copyright and grant the series right of first publication with the work simultaneously licensed under a Creative Commons
Attribution License that allows others to share the work with an acknowledgment of the work's authorship and initial publication in this
series.
2. Authors are able to enter into separate, additional contractual arrangements for the non-exclusive distribution of the series's published
version of the work (e.g., post it to an institutional repository or publish it in a book), with an acknowledgment of its initial
publication in this series.
3. Authors are permitted and encouraged to post their work online (e.g., in institutional repositories or on their website) prior to and
during the submission process, as it can lead to productive exchanges, as well as earlier and greater citation of published work (See
Open access policy for details).
References
[1]. Kumar, A., Arora, H.C., Kapoor, N.R., et al. Compressive Strength Prediction of Lightweight Concrete: Machine Learning Models. Sustainability. Vol. 14 (2022) No. 4, 2404.
[2]. Chou, J.S., Pham, A.D. Enhanced artificial intelligence for ensemble approach to predicting high performance concrete compressive strength. Construction and Building Materials. Vol. 49 (2013), p. 554–563.
[3]. Feng, D.C., Liu, Z.T., Wang X.D., et al. Machine learning-based compressive strength prediction for concrete: an adaptive boosting approach, Construction and Building Materials. Vol. 230 (2020), 117000.
[4]. Lee, S.Y. Bayesian nonlinear models for repeated measurement data: an overview, implementation, and applications. Mathematics. Vol. 10 (2022) No. 6, 898.
[5]. Hastings, W.K. Monte Carlo sampling methods using Markov chains and their applications. Biometrika. Vol 57 (1970) No. 1, p. 97–109.
[6]. Koriyama, T. An introduction of Gaussian processes and deep Gaussian processes and their applications to speech processing. Acoustical Science and Technology. Vol 41 (2020) No. 2, p. 457-464.
[7]. He, Z.K., Liu, G.B., Zhao, X.J., et al. Overview of Gaussian process regression. Control and Decision. Vol 28 (2013) No. 8, p. 1121-1129+1137.
[8]. Li, H. Statistical Learning Methods. Beijing: Tsinghua University Press, 2019.
[9]. Rasmussen, C.E., Williams C.K.I., Gaussian Processes for Machine Learning. Cambridge, Massachusetts: The MIT Press, 2006.
[10]. https://scikit-learn.org/stable/modules/generated/sklearn.gaussian_process.kernels.Matern.html