


1. Introduction
The increased availability of data and the use of machine learning techniques have led to considerable breakthroughs in the fields of financial prediction and stock market analysis in recent years. These developments have empowered investors, financial analysts, and policymakers with tools to make informed decisions in the dynamic world of finance. But because of the inherent volatility and unpredictability of financial markets, accurately predicting stock prices is still a difficult and difficult endeavor.
However, despite these advancements, a crucial knowledge gap persists in the ability to consistently predict stock prices with a high degree of accuracy. Short-term price swings in the financial markets are unpredictable due to a multitude of factors that impact them, such as investor sentiment, geopolitical events, economic data, and unexpected news. In order to close this gap, a comparison investigation of many machine learning models for predicting the stock price of Google—a major player in the global financial scene—is being carried out.
This paper assumes that stock prices have some time trend and correlation and that past stock prices and related data can be used to predict future prices. The primary objective of this paper is to assess the performance of three distinct regression models: Linear Regression, Decision Tree Regression, and Random Forest Regression, in predicting Google's stock prices. By evaluating these models using metrics such as root mean squared error (RMSE), R-squared, mean absolute error (MAE), and Residual Analysis, this paper aims to identify the most suitable model for stock price prediction. Hope this analysis will contribute to the ongoing efforts to improve the accuracy of stock price forecasts and provide valuable insights for investors and financial professionals navigating the dynamic landscape of the stock market.
2. Literature Review
Rishab Mamgai et al. discussed the stock market's dynamic nature and the challenge of accurate prediction using models like LSTM, Linear regression, and CNN [1]. The research introduces a promising model based on KNN and Linear Regression for stock market predictions, demonstrating high accuracy and potential for use in a recommender system, with future improvements including dataset expansion and advanced techniques like Time Series analysis. Neha Titarmare et al. summarized the successful application of Artificial Neural Networks (ANN) in stock price prediction, highlighting their strong performance except during sudden data fluctuations [2]. Additionally, it identifies the random forest algorithm as the most accurate model for stock price forecasting based on historical data, offering valuable insights for investors and financial professionals. Sasidhar Reddy Bommareddy et al. analyzed TCS stock prices on NSEI using Linear Regression to predict Open, Close, High, and Low values, aiming to assist investors in understanding future prices [3]. Bijesh Dhyani et al. compared two popular machine learning models, Random Forest (RF) and Artificial Neural Network (ANN), in order to forecast the closing values of stocks belonging to five significant corporations. By adding more input features, such as the variations between high and low prices, closing and low prices, 7-day, 14-day, and 21-day moving averages of stock prices, and the standard deviation of stock prices over a seven-day period, the research increased prediction accuracy. When ANN and RF prediction models were compared using performance metrics such as MAPE, RMSE, and MBE, it was found that ANN is more accurate at forecasting closing prices than RF [4]. Kucheryavskiy et al. introduce a novel cross-validation method called Procrustes cross-validation, which allows for a more accurate assessment of model performance [5]. Wong et al. proposed a new k-fold cross-validation method and have provided reliable accuracy estimates [6]. This method has been validated on multiple datasets. Kasuya et al. discussed the use of r and r² in correlation and regression analysis, pointing out that in certain cases, r² may not be a suitable measure as it can be prone to over-interpretation [7]. The authors also examined the relationships between r² and other correlation and regression metrics and provided recommendations for better interpretation and utilization of these metrics. Valente et al. explore the effectiveness of cross-validation and permutation methods in Multivariate Pattern Analysis (MVPA) [8]. It compares various cross-validation approaches, including Leave-One-Out, K-Fold Cross-Validation, and Repeated K-Fold Cross-Validation. The results indicate that Repeated K-Fold Cross-Validation exhibits high stability and low variance while maintaining good generalization performance. He et al. studied the effect of the COVID-19 pandemic on the stock prices of different industries in the Chinese stock market [9]. Researchers employed an event study methodology to analyze the fluctuations in stock prices across different sectors during the outbreak of the COVID-19 pandemic in China. Huang et al. explored the association between the frequency and trends of Google search terms related to the stock market and the actual movements in the stock market by analyzing these search data [10]. Kim et al. unveil how a product recall affects stock prices by integrating data related to product recall events and Google search trends. It provides valuable insights for investors, businesses, and policymakers regarding market reactions and risk management [11].
3. Methodology
3.1. Data Collection
This paper collected the Google 10-year StockPrice Dataset from Kaggle, which has six attributes including Open Price, High Price, Low Price, Close Price, Adjusted Close Price, and Volume. Each attribute has its value and date. This dataset comprises a total of 120 months of stock price data. This paper uses 20% of the dataset as the test set, and the remaining 80% as the training set.
3.2. Data Preprocessing
In the data preprocessing process, the first is to check for the presence of missing values in the dataset. Next is performing data normalization to ensure that all features are within the same numerical range, preventing certain features from having an undue influence on the model. To enable efficient validation and testing during model training and assessment, divide the dataset into training and testing sets at the end. These steps contribute to preparing the data for suitability in machine learning modeling.
3.3. Model Selection and Training
The suggested model in this paper makes use of Random Forest, Decision Trees, and Linear Regression. Using performance indicators including Mean Absolute Error (MAE), R-squared, and Root Mean Square Error (RMSE), this study compared the three prediction models and performed residual analysis for each model.
3.4. Model Evaluation
This paper observed that the R-squared value was exceptionally high, nearly approaching 1. To address this concern, the author employed cross-validation. The results demonstrated that the linear regression model consistently excelled in cross-validation, showcasing the lowest RMSE. This suggests that the model's predictions closely align with actual observations, indicating a strong fit to the data.
4. Results
4.1. Data Introduction
This stock price dataset encompasses several key variables related to the stock market, offering insights into the pricing and trading activities of a specific stock. Here's a brief overview of the primary variables featured in the dataset:
Date: This variable represents the date of each data point, on a daily basis. Dates are crucial for tracking time series data and historical fluctuations in stock prices.
Open: The opening price is the first price at which a stock trades when the market begins. It offers the opening price for trade that day.
High: The high price is the peak price reached for the day and is the maximum price the stock can reach during the trading day.
Low: The low price represents the stock's lowest price of the trading day and the lowest price that was attained during the day.
Close: The closing price is the stock's price at the end of the trading day when the market closes. It is often considered the day's closing price.
Adj Close: Adjusted Close provides a more precise way to calculate investment returns by accounting for things like stock splits, dividends, and other price-related impacts.
Volume: Volume represents the number of shares traded on a specific trading day. It provides information on trading activity, aiding in the analysis of market liquidity and interest.
4.2. Data Preprocessing
Within this dataset, it's important to note the absence of any missing values. Normalizing the data is a crucial step as it ensures a consistent numerical range across various features. This consistency not only enhances the model's performance but also guarantees stability and reliability in predictions for both the training and testing data.
Figure 1 visualizes the stock price data, depicting it as a line chart. From 2013 to 2019, Google's stock price exhibited a consistent upward trend with fluctuations. Nonetheless, there was a discernible drop in price at the beginning of 2020. The COVID-19 pandemic outbreak is to blame for this, as it caused a great deal of market turbulence and affected Google's stock price. Nonetheless, it quickly rebounded. In 2021, the stock price continued to rise and reached a peak in October 2021. Google emerged as one of the highest-valued technology companies, reflecting its sustained innovation and growth in areas such as advertising, cloud computing, and artificial intelligence. However, following this peak, the stock price experienced fluctuations and declined throughout the rest of 2022. It showed signs of recovery in early 2023.
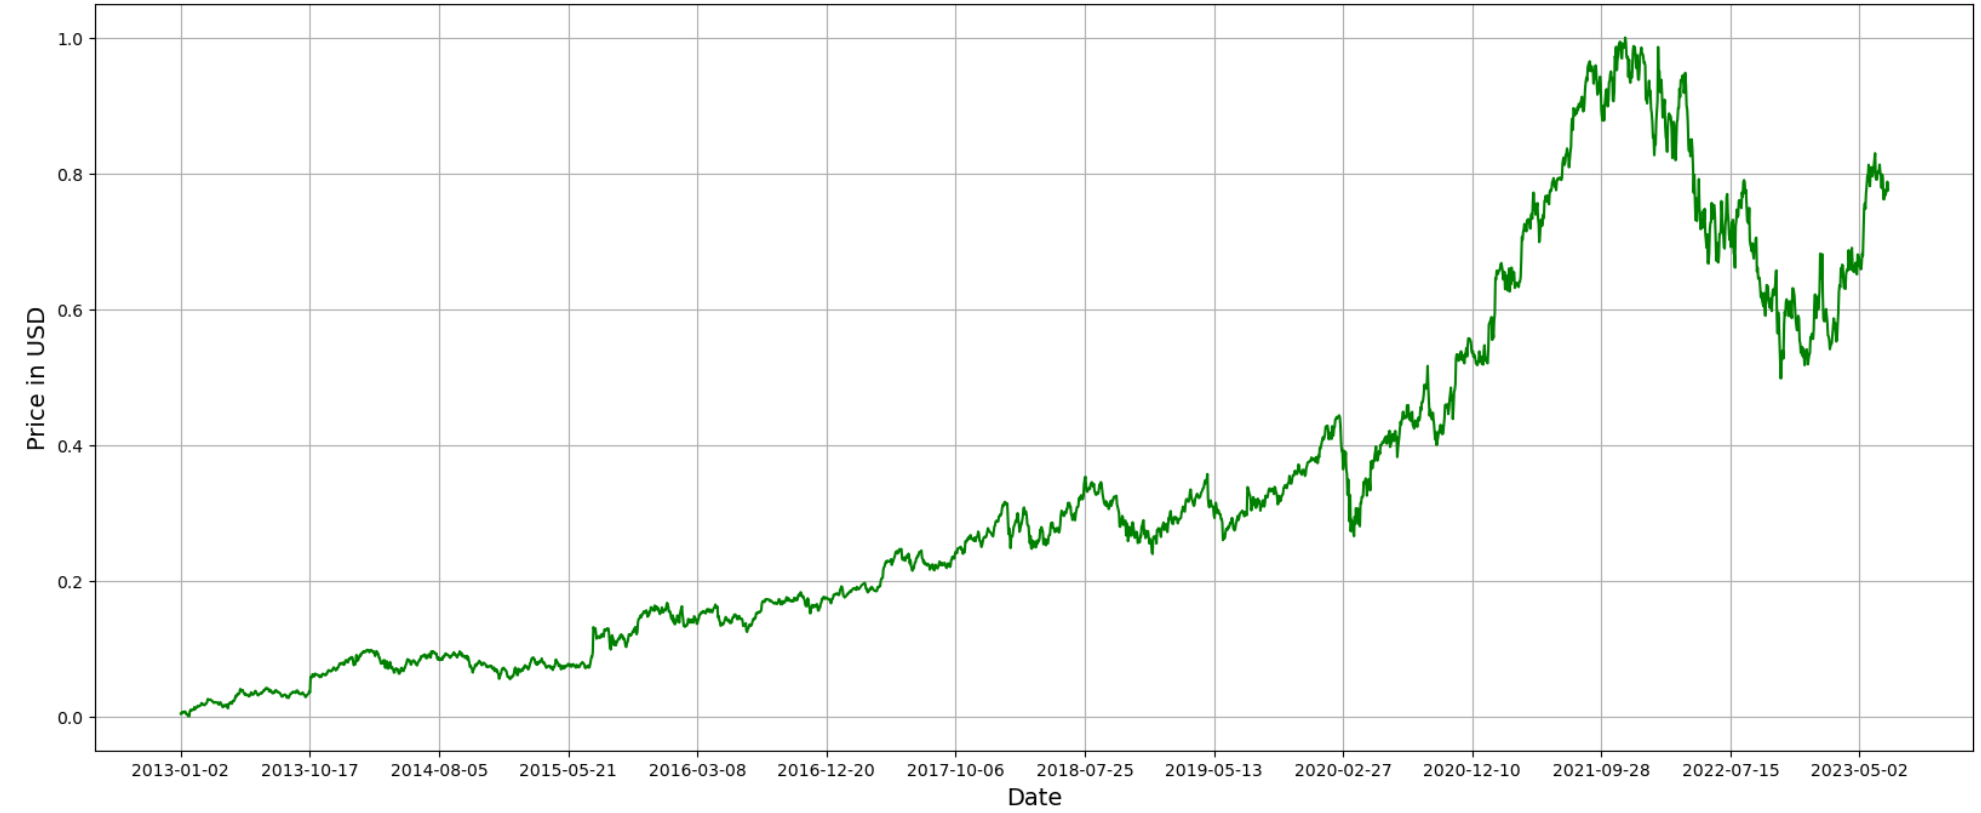
Figure 1. Google stock price for the last decades.
4.3. Model Selection and Training
4.3.1. R-squared, MAE, and RMSE. Table 1 displays the values of R-squared, MAE, and RMSE corresponding to the three models: Linear Regression, Decision Tree, and Random Forest. The results indicate Linear Regression has the highest R-squared (0.999843) and the lowest MAE (0.002091) and RMSE (0.003453).
Table 1. Performance metrics.
Model | R-squared | MAE | RMSE |
Linear Regression | 0.999843 | 0.002091 | 0.003453 |
Decision Tree | 0.999555 | 0.003518 | 0.005816 |
Random Forest | 0.999707 | 0.002907 | 0.004720 |
4.3.2. Residual Analysis. Figures 2, 3, and 4 depict the residual analysis for the three models corresponding to linear regression, decision tree, and random forest, respectively. When observing the residual plots of the three models, it is evident that linear regression exhibits the most exceptional fitting performance. The residuals are uniformly distributed with scarce conspicuous outliers. This implies that the model's error distribution in the prediction process is relatively uniform and devoid of systematic biases, and the majority of residual values concentrate within the range of -0.1 to 0.1. This signifies a very high level of prediction accuracy. The characteristics of these residual plots instill confidence, affirming that the linear regression model excels in forecasting Google's stock prices, effectively capturing the underlying relationships within the data.
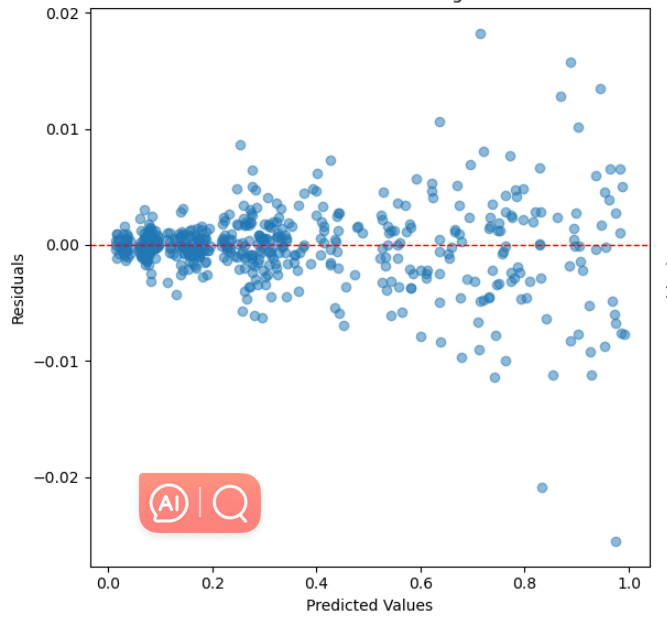
Figure 2. Residual Plot for Linear Regression.
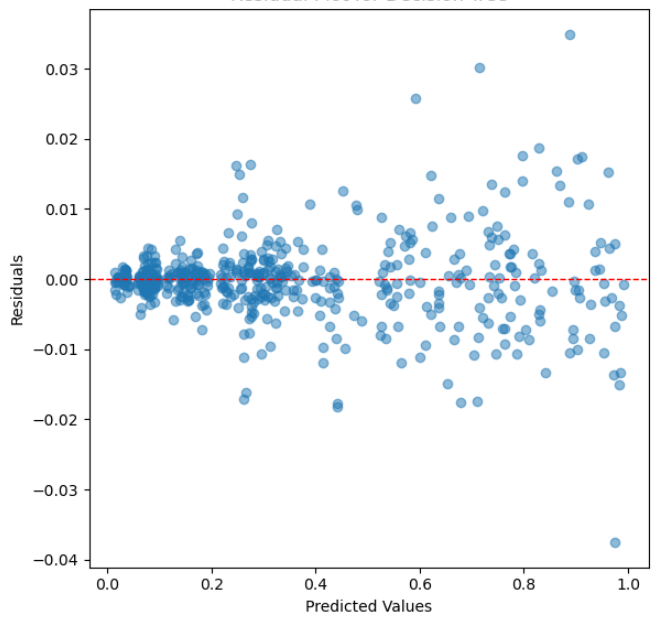
Figure 3. Residual Plot for Decision Tree.
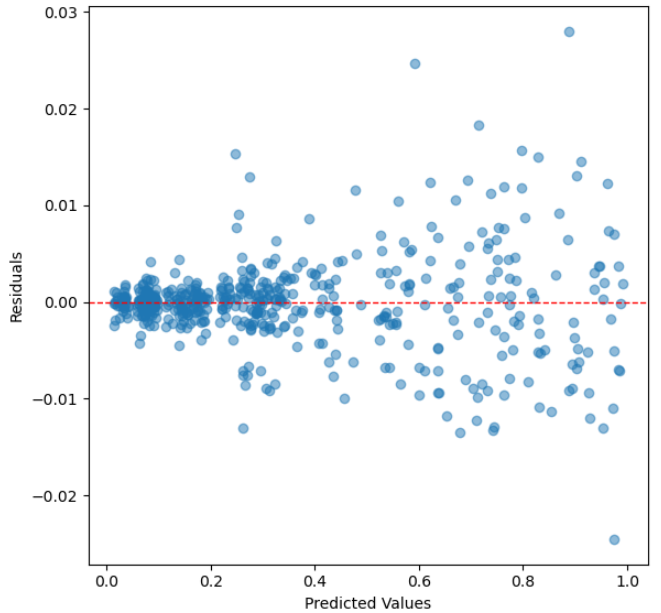
Figure 4. Residual Plot for Random Forest.
4.4. Model Evaluation
4.4.1. Cross Validation. Table 2 displays the RMSE of each model after cross-validation. RMSE (Root Mean Squared Error) is used to measure how accurate a prediction model is. What is measured is the square root of the average of the squared differences between the expected and actual values. Since a lower RMSE denotes a reduced average prediction error, it is indicative of superior model performance. Lower RMSE values in the context of stock price prediction imply that the model's predictions are more accurate because they are closer to the real stock prices. A more accurate evaluation of the model's performance is obtained by splitting the dataset into multiple subgroups and training and testing the model on different combinations of these subsets. This technique is known as cross-validation. The RMSE values in the table below represent a measure of the average error between predicted stock prices and actual stock prices. It demonstrates that the Linear Regression model has the lowest RMSE value (0.003511), indicating that this model performs best in terms of RMSE during cross-validation, leading to the maximum accuracy in predicting the price of Google's stock.
Table 2. RMSE (Cross-Validation).
Model | RMSE (Cross-Validation) |
Linear Regression | 0.00351101862554836 |
Decision Tree | 0.00620781389663867 |
Random Forest | 0.00503941077430276 |
4.4.2. Final prediction. Based on the training results mentioned above, this paper chooses linear regression as the final model. Figure 5 is a line chart of predicted stock prices on the test set using the linear regression model, alongside the actual stock prices. This harmonious convergence between predicted and actual prices signifies an exceptionally well-fitted model. Investors and analysts can draw significant confidence from this graph, as it demonstrates the model's ability to reliably forecast stock prices, thus aiding in sound investment decisions and financial planning. The graph essentially portrays a model that has successfully decoded the underlying trends and patterns in the stock market data, allowing for precise and reliable predictions.
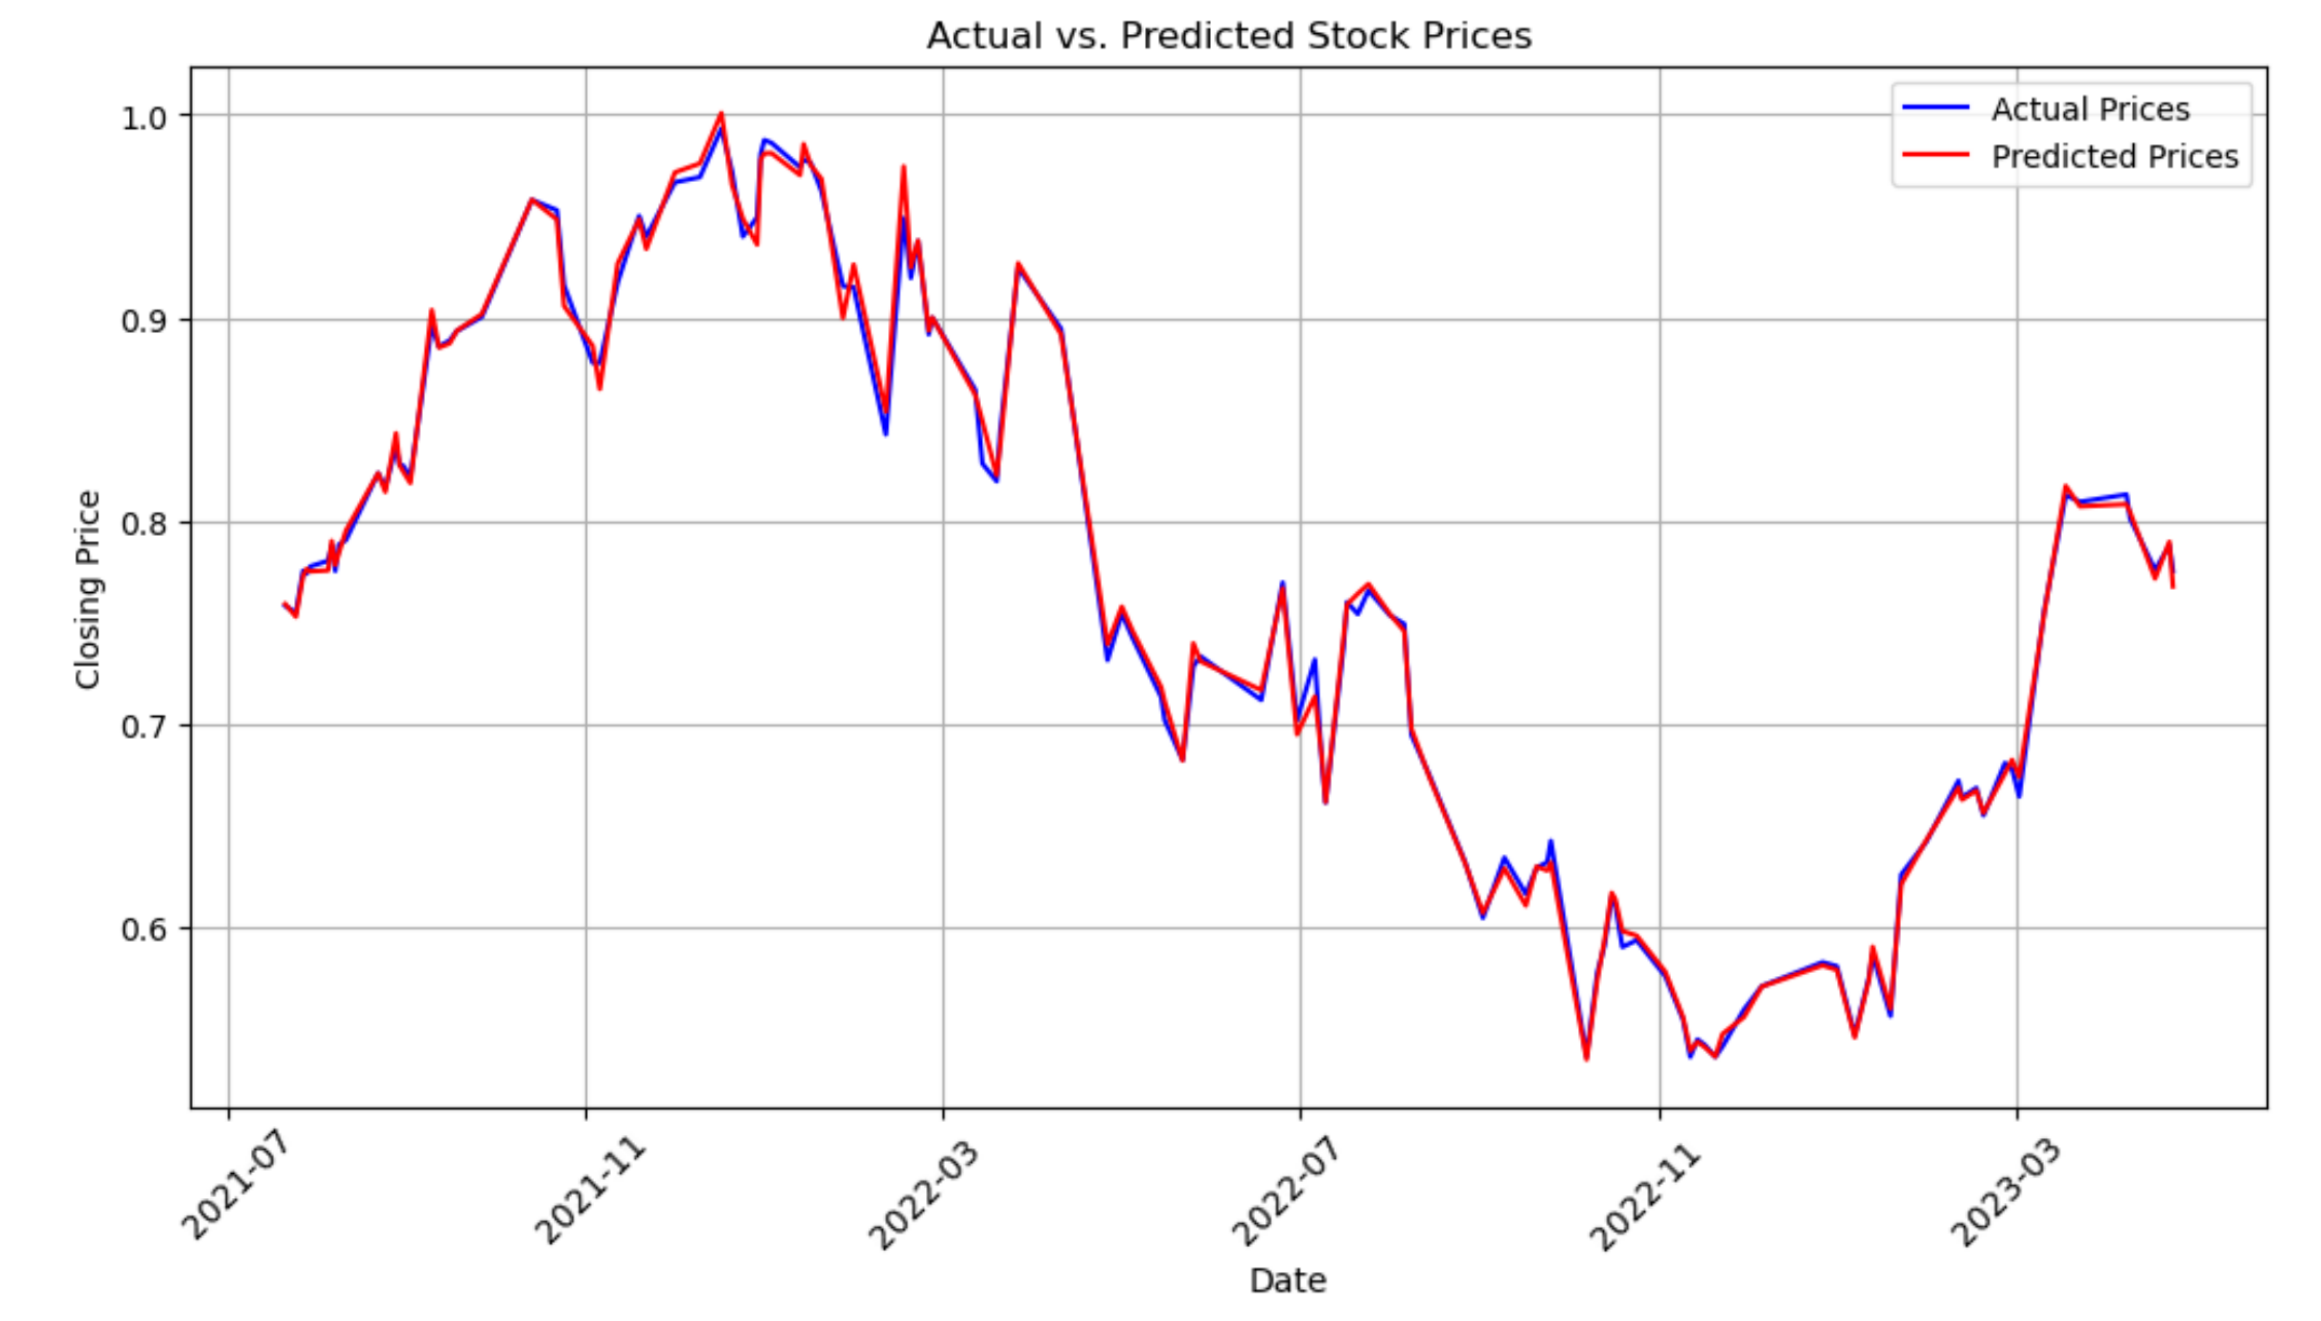
Figure 5. Actual vs. Predicted Stock Price.
5. Conclusion
In conclusion, this paper highlights the effectiveness of linear regression in predicting Google's stock prices. While the R-squared value may raise concerns, cross-validation has reinstated the model's resilience and reliability. The robust performance of the linear regression model, as evidenced by its low RMSE and consistent residuals, suggests that it can be a valuable tool for investors and financial analysts seeking accurate stock price predictions.
Future research holds numerous avenues for in-depth exploration to further enhance model quality and adaptability. First, in order to determine the influence of macroeconomic variables on stock prices, researchers can perform a thorough examination of these variables, including interest rates, inflation rates, and unemployment rates. This will aid in refining the consideration of economic factors within the model, making it more aligned with real-world scenarios. Secondly, delving into the realm of geopolitical events and international dynamics, including trade disputes and international conflicts, can offer a better understanding of how they influence the stock market. Such analyses can bolster the model’s predictive capabilities. Lastly, contemplating the adoption of more intricate machine learning models, such as deep learning neural networks, can further elevate predictive accuracy, especially when confronted with vast datasets. This advancement will facilitate a more adept response to the ever-evolving intricacies and trends of the stock market.
This paper opens up potential for more advanced models that can take into account a larger variety of factors and serves as a stepping stone in the fields of financial analysis and machine learning. By continually refining predictive models and incorporating diverse data sources, decision-makers can have better tools they need to navigate the dynamic world of stock market investments.
References
[1]. Mamgai, R. Jain, H. Aithani, Y. Bansal, V. Nagrath, P. Jain, R. Kumar, A. Chaudhary, A. 2022, Stock prediction & recommendation system using KNN and linear regression, (AIP Conference Proceedings, vol. 2555), no. 1.
[2]. Titarmare, N. Wazarkar, M. Palkar, P. Alwaria, R, Shetye, A. Khodiyar, R. 2022, Stock market predictions using linear regression, (AIP Conference Proceedings, vol. 2424), no. 1.
[3]. Bommareddy, S. R. Sai Smaran Reddy, K. Kaushik, P. Vinay Kumar, K. V. Hulipalled, V. R. 2018, predicting the stock price using linear regression, (International Journal of Advanced Research in Computer Science, vol. 9), no. 81.
[4]. Dhyani, B. Jain, A. Barthwal, A. Kumar, M. 2022, The prediction of closing prices of company stocks using random forests and artificial neural networks, (AIP Conference Proceedings, vol. 2481), no. 1.
[5]. Kucheryavskiy, S. Zhilin, S. Rodionova, O. Pomerantsev, A. 2020, Procrustes cross-ValidationA bridge between cross-validation and independent validation sets, (Analytical Chemistry (Washington)), vol. 92), no. 17, pp. 11842-11850.
[6]. Wong, T. Yeh, P. 2020, Reliable accuracy estimates from k-fold cross validation. (IEEE Transactions on Knowledge and Data Engineering, vol. 32), no. 8, pp. 1586-1594.
[7]. Kasuya, E. 2019, On the use of r and r squared in correlation and regression, (Ecological Research, vol. 34), no. 1, pp. 235-236.
[8]. Valente, G. Castellanos, A. L. Hausfeld, L. De Martino, F. Formisano, E. 2021, Cross-validation and permutations in MVPA: Validity of permutation strategies and power of cross-validation schemes, (NeuroImage (Orlando, Fla.), vol. 238), pp. 118145-118145.
[9]. He, P. Sun, Y., Zhang, Y. Li, T. 2020, COVID-19's impact on stock prices across different sectors-an event study based on the chinese stock market, (Emerging Markets Finance & Trade, vol. 56), no. 10, pp. 2198-2212.
[10]. Huang, M. Y. Rojas, R. R. Convery, P. D. 2020, Forecasting stock market movements using google trend searches, (Empirical Economics, vol. 59), no. 6, pp. 2821-2839.
[11]. Kim, A. Lee, S. Shin, D. 2020, An analysis of the impact of product recall on stock prices based on google trend search counts, (Global Business and Finance Review, vol. 25), no. 4, pp. 33-50.
Cite this article
Wang,K. (2023). Comparative analysis of different machine learning models for predicting Google stock price. Theoretical and Natural Science,25,198-205.
Data availability
The datasets used and/or analyzed during the current study will be available from the authors upon reasonable request.
Disclaimer/Publisher's Note
The statements, opinions and data contained in all publications are solely those of the individual author(s) and contributor(s) and not of EWA Publishing and/or the editor(s). EWA Publishing and/or the editor(s) disclaim responsibility for any injury to people or property resulting from any ideas, methods, instructions or products referred to in the content.
About volume
Volume title: Proceedings of the 3rd International Conference on Computing Innovation and Applied Physics
© 2024 by the author(s). Licensee EWA Publishing, Oxford, UK. This article is an open access article distributed under the terms and
conditions of the Creative Commons Attribution (CC BY) license. Authors who
publish this series agree to the following terms:
1. Authors retain copyright and grant the series right of first publication with the work simultaneously licensed under a Creative Commons
Attribution License that allows others to share the work with an acknowledgment of the work's authorship and initial publication in this
series.
2. Authors are able to enter into separate, additional contractual arrangements for the non-exclusive distribution of the series's published
version of the work (e.g., post it to an institutional repository or publish it in a book), with an acknowledgment of its initial
publication in this series.
3. Authors are permitted and encouraged to post their work online (e.g., in institutional repositories or on their website) prior to and
during the submission process, as it can lead to productive exchanges, as well as earlier and greater citation of published work (See
Open access policy for details).
References
[1]. Mamgai, R. Jain, H. Aithani, Y. Bansal, V. Nagrath, P. Jain, R. Kumar, A. Chaudhary, A. 2022, Stock prediction & recommendation system using KNN and linear regression, (AIP Conference Proceedings, vol. 2555), no. 1.
[2]. Titarmare, N. Wazarkar, M. Palkar, P. Alwaria, R, Shetye, A. Khodiyar, R. 2022, Stock market predictions using linear regression, (AIP Conference Proceedings, vol. 2424), no. 1.
[3]. Bommareddy, S. R. Sai Smaran Reddy, K. Kaushik, P. Vinay Kumar, K. V. Hulipalled, V. R. 2018, predicting the stock price using linear regression, (International Journal of Advanced Research in Computer Science, vol. 9), no. 81.
[4]. Dhyani, B. Jain, A. Barthwal, A. Kumar, M. 2022, The prediction of closing prices of company stocks using random forests and artificial neural networks, (AIP Conference Proceedings, vol. 2481), no. 1.
[5]. Kucheryavskiy, S. Zhilin, S. Rodionova, O. Pomerantsev, A. 2020, Procrustes cross-ValidationA bridge between cross-validation and independent validation sets, (Analytical Chemistry (Washington)), vol. 92), no. 17, pp. 11842-11850.
[6]. Wong, T. Yeh, P. 2020, Reliable accuracy estimates from k-fold cross validation. (IEEE Transactions on Knowledge and Data Engineering, vol. 32), no. 8, pp. 1586-1594.
[7]. Kasuya, E. 2019, On the use of r and r squared in correlation and regression, (Ecological Research, vol. 34), no. 1, pp. 235-236.
[8]. Valente, G. Castellanos, A. L. Hausfeld, L. De Martino, F. Formisano, E. 2021, Cross-validation and permutations in MVPA: Validity of permutation strategies and power of cross-validation schemes, (NeuroImage (Orlando, Fla.), vol. 238), pp. 118145-118145.
[9]. He, P. Sun, Y., Zhang, Y. Li, T. 2020, COVID-19's impact on stock prices across different sectors-an event study based on the chinese stock market, (Emerging Markets Finance & Trade, vol. 56), no. 10, pp. 2198-2212.
[10]. Huang, M. Y. Rojas, R. R. Convery, P. D. 2020, Forecasting stock market movements using google trend searches, (Empirical Economics, vol. 59), no. 6, pp. 2821-2839.
[11]. Kim, A. Lee, S. Shin, D. 2020, An analysis of the impact of product recall on stock prices based on google trend search counts, (Global Business and Finance Review, vol. 25), no. 4, pp. 33-50.