


1. Introduction
The analysis and prediction of stock market behavior has long been regarded as a classic and formidable topic, capturing the interest of economists and computer scientists [1, 2]. This is primarily due to the presence of features such as chaos, complexity, volatility, and dynamics. Over the course of recent decades, researchers have extensively investigated the utilization of linear and machine learning methodologies in order to construct predictive models that exhibit high levels of effectiveness. The objective of this article is to provide an introduction to three primary data analysis techniques: linear regression, random forest, and LSTM neural network. By providing practical illustrations of these methodologies, we will demonstrate their efficacy in enhancing policymakers’ comprehension of financial market dynamics and their ability to discern potential dangers and opportunities. The objective of this paper is to provide an introduction to three prominent data analysis techniques: linear regression, random forest, and LSTM neural network. By utilizing illustrative instances of these methodologies, we will demonstrate their potential in enhancing policymakers’ comprehension of the intricacies within financial markets, as well as their ability to discern potential hazards and opportunities. In conclusion, a thorough assessment of these data analysis methodologies will be undertaken, with the aim of identifying areas for enhancement and anticipating future avenues of research. The dataset utilized for this experiment was acquired from the official Kaggle website [3].
2. Data analysis process
2.1. Using linear regression model analysis of stock data
Linear regression is a robust statistical technique employed to ascertain the association between a response variable and one or more predictor variables. Linear regression models are employed in our financial data analysis project to investigate and establish the correlation between stock prices (Close) and time (Date). The subsequent section provides a comprehensive elucidation and outcomes of our linear regression investigation.
Initially, the dataset’s stock price data was imported and the dates (Date) were transformed into integer values to facilitate modeling. Next, employ the linear regression model to establish a relationship between the time (Date) as the independent variable (X) and the stock closing price (Close) as the dependent variable (y). The partitioning of the data set into a training set and a test set serves to ensure the reliability of the model.
Once the training process has been finalized, the model may be employed to generate predictions on the test dataset. Subsequently, a comparison between the anticipated values and the actual values can be conducted in order to assess the performance of the model. A scatter plot was constructed in order to visually represent the correlation between the observed values and the corresponding expected values. Refer to Figure 1.
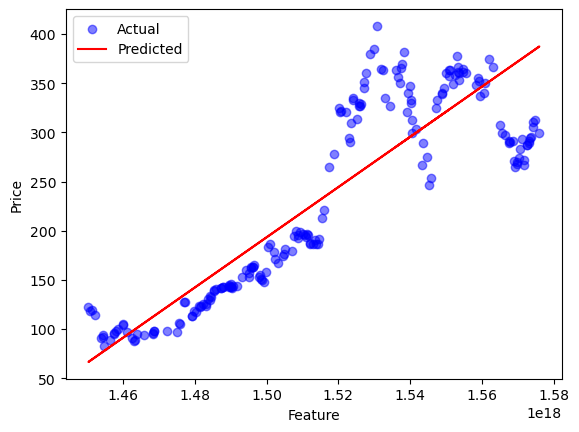
Figure 1. Linear Regression for price
Next, the MinMaxScaler method is employed to normalize the return data. Normalization is a data preprocessing technique that rescales the values inside a dataset to a standardized range, typically between 0 and 1. This is done in order to mitigate potential issues that may arise from variations in data ranges across different variables or datasets. This facilitates an improved fit of the linear regression model to the data. In conclusion, the “create_window_data” function should be employed to structure the data into appropriate input and output forms for the time series model, with a window size of 10. Ultimately, a linear regression model was developed in order to accurately capture the linear correlation between stock price and time within the designated training set. Refer to Figure 2.
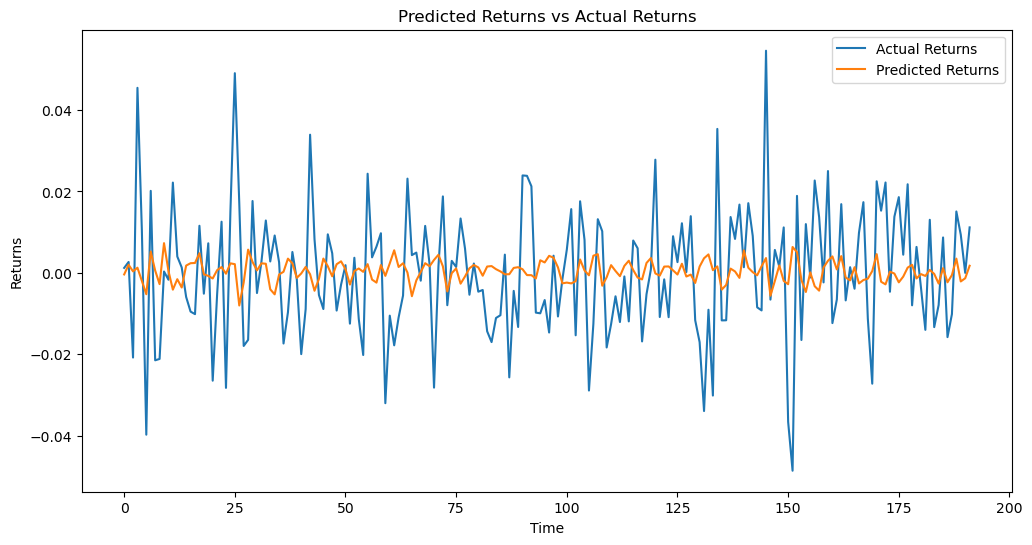
Figure 2. Predicted Returns vs Actual Returns
In order to conduct a more comprehensive assessment of the model’s performance, we computed three commonly used metrics: the mean square error (MSE), the mean absolute error (MAE), and the root mean square error (RMSE). These metrics offer a numerical assessment of the model’s ability to accurately anticipate outcomes and its overall efficacy. Please refer to Table 1. Based on a comprehensive examination of the existing body of literature, it is evident that neural networks exhibit superior performance in terms of predictive accuracy when compared to statistical techniques such as linear regression [4].
Table 1. Linear regression model performance evaluation.
MSE | 0.0002590998100386075 |
MAE | 0.01284357877320789 |
RMSE | 0.016096577587754717 |
2.2. Using Random forest regression model analysis of stock data
Random forest regression is frequently employed as a significant modeling method in financial data analysis initiatives. Subsequently, we proceed to present the code segment pertaining to random forest regression.
Initially, the requisite Python libraries were imported, encompassing Pandas, NumPy, Matplotlib, as well as the Scikit-Learn package for random forest regression. Next, we proceed to import the dataset containing stock price information, which is labeled as “NFLX.csv”. Subsequently, the dataset was partitioned into distinct training and test sets, employing an identical approach as that employed in linear regression. By employing this approach, we can assess the efficacy of the random forest model on the test dataset. Subsequently, a random forest regression model was constructed and subsequently trained using the provided training data. Subsequently, the model was employed to generate predictions on the test dataset. To assess the efficacy of the model, the correlation between the actual and anticipated values was examined by means of scatter plots and line graphs. Refer to Figure 3.
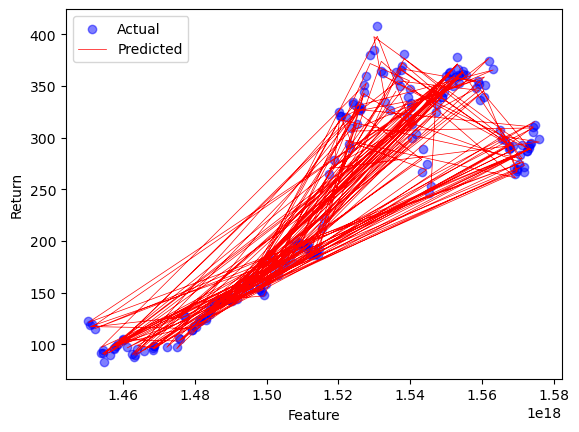
Figure 3. Random Forest Regression for price
Following this, we executed analogous data preprocessing procedures as those employed in the linear regression segment. These procedures encompassed the computation of the rate of return, data normalization, and the generation of sliding window data. The following steps have significant importance in the performance evaluation of random forest regression models. Ultimately, the data was transformed to conform to the model, and subsequently, the model was employed to generate forecasts on the test dataset. Subsequently, a comparison was made between the projected outcomes and the observed outcomes. Line charts were constructed and a set of evaluation metrics were computed to assess the efficacy of the random forest regression model. Please refer to Figure 4. Please refer to Table 2. It is evident that random forests have the capability to attain favorable predictive accuracy. To a certain degree, this performance exhibits comparability with predictions for prices that surpass linear regression models to a large level. Nevertheless, additional investigation and verification are required to further investigate and analyze return rates and bigger samples [5].
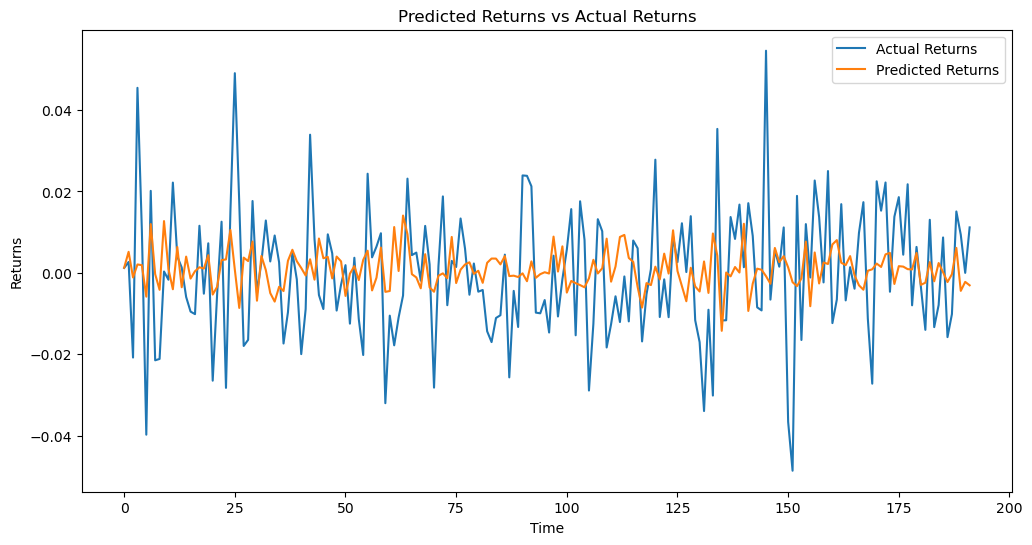
Figure 4. Predicted Returns vs Actual Returns 2
Table 2. Random Forest regression model performance evaluation.
MSE | 0.00025724736017413 |
MAE | 0.012775182114157341 |
RMSE | 0.016038932638244043 |
2.3. Using LSTM to predict stock returns
Long Short-Term Memory (LSTM) deep learning approaches have received attention in financial time series forecasting. Their ability to represent and low assumption use are the main reasons [6]. This approach solves protracted dependency in stock price forecasting, market trend analysis, and risk management. We use Long Short-Term Memory (LSTM) to assess Netflix stock prices. Data is preprocessed, models are built, performance is tested, and results are shown to improve financial market dynamics understanding and forecasting. Stock market values are complex, volatile, and ever-changing, making predicting difficult. The deep learning capabilities of Long Short-Term Memory (LSTM) are more flexible and accurate than other data processing approaches. However, a large database is needed to effectively utilize its great speed [7].
The preparation phase resembles the two regression models. The return data is then standardized using MinMaxScaler. Data normalisation is essential for deep learning models. Scaling the data to 0–1 improves model convergence and reduces the vanishing gradient problem during training.
The sliding window data was generated with “create_window_data.” This function helped divide time series data into preset subsequences. The LSTM model used each sub-sequence as input and the data from the next time step as output. The LSTM model uses LSTM and fully connected layers to capture temporal dependencies in time series data and make accurate predictions. The model is built and trained in 16 batches across 50 epochs. Along with evaluation data, the projected line graph was created. Please see Figure 5. See Table 3.
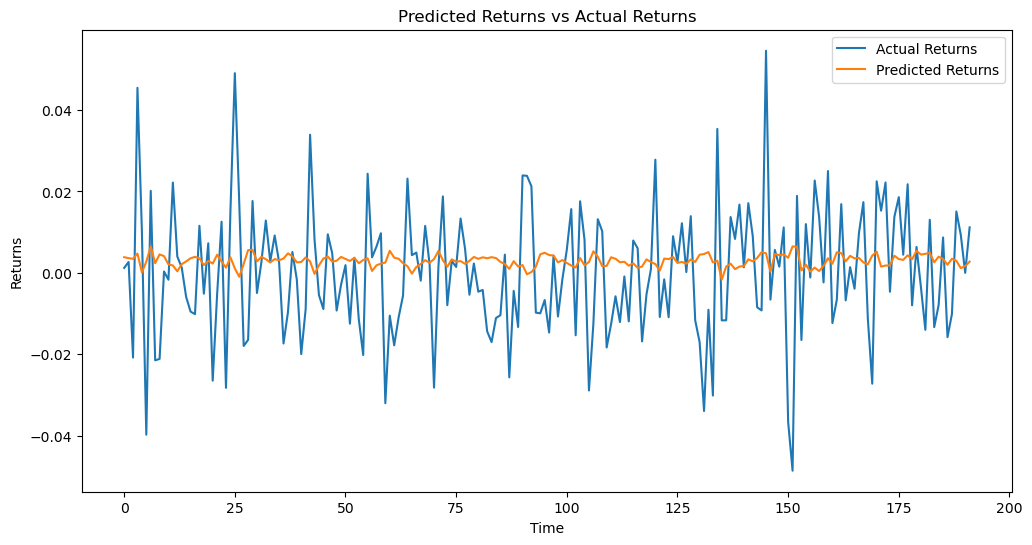
Figure 5. Predicted Returns vs Actual Returns 3
Table 3. LSTM model performance evaluation.
MSE | 0.0002658998930921155 |
MAE | 0.012846074043384644 |
RMSE | 0.016306437167331052 |
3. Discussion
Due to system nonlinearity, stock market predictions are difficult. However, some machine learning methods are effective forecasting methods [8]. Next, this study will horizontally evaluate the three models to better grasp their prediction capacities. Each of the three regression models provides a line chart, making differentiation difficult. This section describes how to create a line chart to compare the three models.
The method starts by loading a Netflix stock price history CSV file. Returns are then computed and normalized to 0–1. After partitioning the dataset into training and test subsets, “create_window_data” was used to make a sliding window of data for time series modeling. The window size is 10, therefore each time step’s input data equals the rate of return from the previous 10 steps. Target variable represents the rate of return at the next time step.
The method starts by loading a Netflix stock price history CSV file. After computing returns, they are normalized to guarantee they fall inside 0 to 1. After partitioning the dataset into training and test sets, “create_window_data” was used to make a sliding window of data for time series modeling. The window size is 10, therefore each time step’s input data equals the rate of return from the previous 10 steps. The rate of return at the next time step is the target variable. The three models’ prognoses are visually displayed on a chart for comparison. Horizontal axis represents temporal dimension, vertical axis represents rate of return. Linear regression predictions are blue, random forest regression predictions are green, and LSTM predictions are red. This method allows one to visually compare several models’ predictive skills, improving stock return forecasting comprehension. Please see Figure 6.
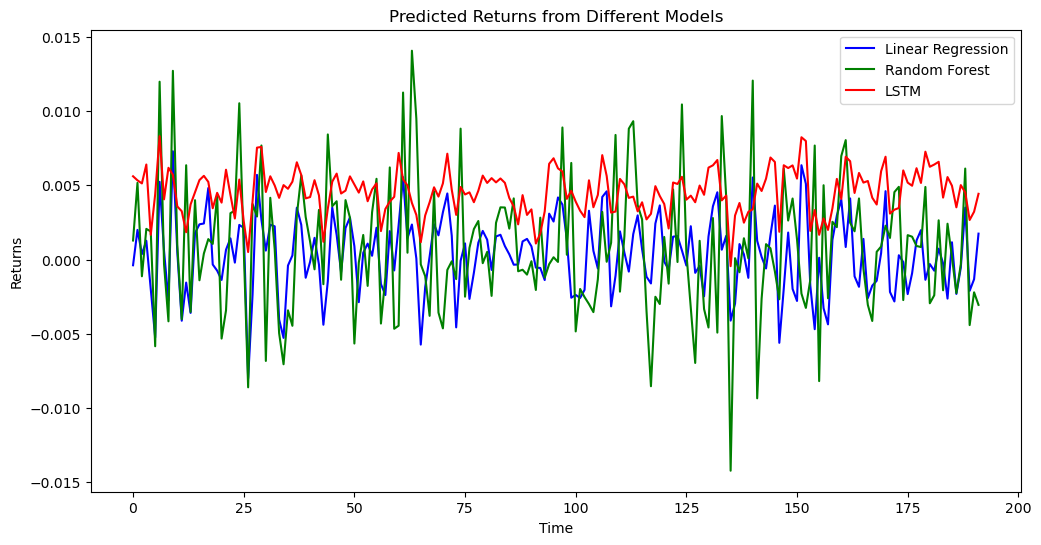
Figure 6. Predicted Returns from Different Models
Based on the performance metrics exhibited by the three models depicted in the figure. The analysis reveals that random forest regression has a substantial degree of variation, but both linear regression and LSTM demonstrate relatively minor levels of variation. In comparison to the current state of affairs, it is evident that the random forest regression model has a reasonably high level of fitting accuracy.
The values of Mean Squared Error (MSE), Mean Absolute Error (MAE), and Root Mean Squared Error (RMSE) can also be compared. Upon horizontal comparison of the evaluation values of the three models, it is observed that the random forest regression model exhibits the lowest values across all three indicators. Although the disparity between the models is not substantial, it can be deduced that random forest regression is comparatively the most suitable model within the dataset of this project. Please refer to Table 4.
Table 4. Comparison of model performance evaluation
Linear Regression | Random Forest | LSTM | |
MSE | 0.0002590998100386075 | 0.00025724736017413 | 0.0002658998930921155 |
MAE | 0.01284357877320789 | 0.012775182114157341 | 0.012846074043384644 |
RMSE | 0.01609657758754717 | 0.016038932638244043 | 0.016306437167331052 |
Due to rapid machine learning research, financial time series forecasting has advanced significantly. Kraus et al. (2017) compared deep neural networks, gradient boosted trees, and random forests. Random forests are the most profitable deep learning method. The experiment was limited by its single-feature setup [9]. In multi-feature settings, Pushpentu et al. (2022) found that the Long Short-Term Memory (LSTM) model outperforms random forest regression. Nabipour’s deep learning study shows that LSTM fits better. Random forest regression and other models often compete [10]. The conclusion analyzes the situation. Larger and more complete data sets will improve testing precision in the future.
4. Conclusion
The objective of this study is to examine the feasibility of utilizing various models in the analysis of financial data to forecast the stock return of Netflix. Three distinct methodologies were employed in this study: linear regression, random forest regression, and Long Short-Term Memory Network (LSTM). The performance of each method was thereafter compared and evaluated.
The simplest of the three models is linear regression. It predicts stock returns using linear relationships. This approach fails to reflect nonlinear relationships in the dataset, which is common in financial markets where complex nonlinear factors affect price fluctuations. Random forest regression is an ensemble learning method that can predict and capture non-linear correlations. This study shows that random forest regression outperforms linear regression in capturing complex stock price fluctuations. LSTM, a deep learning model, can capture complex temporal correlations and nonlinear patterns in time series data. Long Short-Term Memory (LSTM) models are better for stock price prediction, weather forecasting, natural language processing, and other applications. The above model performed poorly in this research compared to the random forest model, maybe due to a small sample size.
Thus, this project has constraints. The linear regression approach assumes linear relationships between variables, making non-linear correlations difficult to handle. Random forests can manage nonlinear interactions, although they can be complex and overfit. Despite its power, LSTM models require a lot of data, computer resources, and parameter tweaking. To improve analysis and prediction, use a larger data collection in future studies.
The field under consideration continues to have extensive potential for further investigation in the future. It is worth considering the inclusion of additional components, such as mood analysis and news events, in order to comprehensively capture the dynamics of the market. The field of financial data analytics is seeing significant growth, driven by advancements in technology and the exponential increase in available data. This trend is expected to result in the development of more precise and dependable financial forecasting models, which will enhance the efficacy of investment decision-making and risk management processes.
References
[1]. Jiang, W. (2021). Applications of deep learning in stock market prediction: recent progress. Expert Systems with Applications, 184, 115537.
[2]. Singh, R., & Srivastava, S. (2017). Stock prediction using deep learning. Multimedia Tools and Applications, 76, 18569-18584.
[3]. https://www.kaggle.com/datasets/jainshukal/netflix-stock-price
[4]. Refenes, A. N., Azema-Barac, M., & Zapranis, A. D. (1993, March). Stock ranking: Neural networks vs multiple linear regression. In IEEE international conference on neural networks (pp. 1419-1426). IEEE.
[5]. Segal, M. R. (2004). Machine learning benchmarks and random forest regression.
[6]. Park, H. J., Kim, Y., & Kim, H. Y. (2022). Stock market forecasting using a multi-task approach integrating long short-term memory and the random forest framework. Applied Soft Computing, 114, 108106.
[7]. Nelson, D. M., Pereira, A. C., & De Oliveira, R. A. (2017, May). Stock market’s price movement prediction with LSTM neural networks. In 2017 International joint conference on neural networks (IJCNN) (pp. 1419-1426). Ieee.
[8]. Parray, I. R., Khurana, S. S., Kumar, M., & Altalbe, A. A. (2020). Time series data analysis of stock price movement using machine learning techniques. Soft Computing, 24, 16509-16517.
[9]. Ghosh, P., Neufeld, A., & Sahoo, J. K. (2022). Forecasting directional movements of stock prices for intraday trading using LSTM and random forests. Finance Research Letters, 46, 102280.
[10]. Nabipour, M.; Nayyeri, P.; Jabani, H.; Mosavi, A.; Salwana, E.; S., S. Deep Learning for Stock Market Prediction. Entropy 2020, 22, 840. https://doi.org/10.3390/e22080840
Cite this article
Li,H. (2023). Data analysis and prediction of Netflix stock. Theoretical and Natural Science,26,164-171.
Data availability
The datasets used and/or analyzed during the current study will be available from the authors upon reasonable request.
Disclaimer/Publisher's Note
The statements, opinions and data contained in all publications are solely those of the individual author(s) and contributor(s) and not of EWA Publishing and/or the editor(s). EWA Publishing and/or the editor(s) disclaim responsibility for any injury to people or property resulting from any ideas, methods, instructions or products referred to in the content.
About volume
Volume title: Proceedings of the 3rd International Conference on Computing Innovation and Applied Physics
© 2024 by the author(s). Licensee EWA Publishing, Oxford, UK. This article is an open access article distributed under the terms and
conditions of the Creative Commons Attribution (CC BY) license. Authors who
publish this series agree to the following terms:
1. Authors retain copyright and grant the series right of first publication with the work simultaneously licensed under a Creative Commons
Attribution License that allows others to share the work with an acknowledgment of the work's authorship and initial publication in this
series.
2. Authors are able to enter into separate, additional contractual arrangements for the non-exclusive distribution of the series's published
version of the work (e.g., post it to an institutional repository or publish it in a book), with an acknowledgment of its initial
publication in this series.
3. Authors are permitted and encouraged to post their work online (e.g., in institutional repositories or on their website) prior to and
during the submission process, as it can lead to productive exchanges, as well as earlier and greater citation of published work (See
Open access policy for details).
References
[1]. Jiang, W. (2021). Applications of deep learning in stock market prediction: recent progress. Expert Systems with Applications, 184, 115537.
[2]. Singh, R., & Srivastava, S. (2017). Stock prediction using deep learning. Multimedia Tools and Applications, 76, 18569-18584.
[3]. https://www.kaggle.com/datasets/jainshukal/netflix-stock-price
[4]. Refenes, A. N., Azema-Barac, M., & Zapranis, A. D. (1993, March). Stock ranking: Neural networks vs multiple linear regression. In IEEE international conference on neural networks (pp. 1419-1426). IEEE.
[5]. Segal, M. R. (2004). Machine learning benchmarks and random forest regression.
[6]. Park, H. J., Kim, Y., & Kim, H. Y. (2022). Stock market forecasting using a multi-task approach integrating long short-term memory and the random forest framework. Applied Soft Computing, 114, 108106.
[7]. Nelson, D. M., Pereira, A. C., & De Oliveira, R. A. (2017, May). Stock market’s price movement prediction with LSTM neural networks. In 2017 International joint conference on neural networks (IJCNN) (pp. 1419-1426). Ieee.
[8]. Parray, I. R., Khurana, S. S., Kumar, M., & Altalbe, A. A. (2020). Time series data analysis of stock price movement using machine learning techniques. Soft Computing, 24, 16509-16517.
[9]. Ghosh, P., Neufeld, A., & Sahoo, J. K. (2022). Forecasting directional movements of stock prices for intraday trading using LSTM and random forests. Finance Research Letters, 46, 102280.
[10]. Nabipour, M.; Nayyeri, P.; Jabani, H.; Mosavi, A.; Salwana, E.; S., S. Deep Learning for Stock Market Prediction. Entropy 2020, 22, 840. https://doi.org/10.3390/e22080840