


1. Introduction
As stock prices are highly volatile due to numerous internal and external factors, stock investment has always been an activity of high risk and high return. And its market plays an important role in the company's capital operation and the country's macroeconomic development [1]. Therefore, predicting the future trend of stocks has always been the focus of investors. Analyzing and predicting stocks through appropriate theories and methods has also become a major point and difficulty in the field of data mining and machine learning.
At present, the existing papers on the use of BP neural network model to predict stock prices can be roughly composed of two categories [2]. One is to use different data types as input layers to predict the rise and fall of stocks, that is, to use the BP neural network model as a classifier to classify dichotomous problems. Zou (2021) adopted BP neural network algorithm optimized by particle swarm optimization, took labels such as the highest price as the input layer, and took the return rate of the next day as the output layer, and finally improved the performance delay of this problem. The other is to extract the data of the first few days of stock prices to predict the data of the next day, that is, to use the back propagation neural network as a predictor to predict the time series data [2]. Huang and Yao used back propagation neural network model based on particle swarm optimization to predict the price of Ping An Bank [1]. After building the model, they traversed all the values of the hidden node, found the optimal value of the hidden node, and obtained the optimal prediction result [1]. Ruan designed a 3-layer back propagation neural network model, taking the price of the previous 5 days of the Shanghai Composite Index as the input variable to forecast the the following day, divided the training set and the test set, and obtained a more accurate model. Zhang and Lou also used BP neural networks to extract trading data from the previous five days to make predictions for the next day. The results they obtained prove that the deep learning fuzzy algorithm is less effective than BP neural network algorithm in predicting the stock price trend [3].
2. Theoretical Research and Analysis
2.1. Linear Regression Model
Regression is an important part of supervised learning, and linear regression is the simplest form of it. The prerequisite for using linear regression is that the dependent variable must be consecutive and have a linear relationship with the independent variable. Use the available data to find a line that is closest to the overall data trend, and then use the line found to predict the future.
The general expression of linear regression:
\( {\hat{y}_{i}}={w_{0}}+{w_{1}}{x_{i1}}+{w_{2}}{x_{i2}}+⋯+{w_{n}}{x_{in}}\ \ \ (1) \)
Machine learning measures the error of the regression model through a loss function. Smaller function values mean higher accuracy.
\( SSE=\sum {(y-{\hat{y}_{i}})^{2}}\ \ \ (2) \)
2.2. Back Propagation Neural Network Model
The neural network algorithm uses the idea of bionics. It simulates the interactive response of the biological nervous system to the real world, usually consisting of multiple simple adaptive units connected to each other [4]. Therefore, neural network algorithms are often used in the field of stock prediction [4]. As displayed in Figure 1, back propagation neural network contains at least three layers. The number of hidden layers and nodes can be freely set on the basis of the complexity of the problem. However, the number of layers and nodes in the input and output of the algorithm are settled. These two layers’ amount is one, and their nodes’ amount is determined by the problem itself. The weights between each layer in the network are propagated forward, and the errors generated during each correction are propagated backward [5]. These two are the two major characteristics of BP neural network.
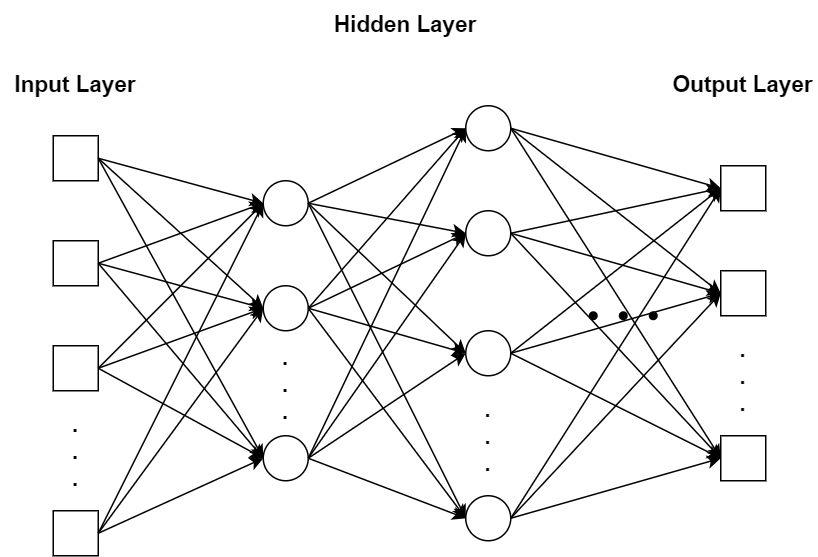
Figure 1. Diagrammatic drawing of BP neural network model
In this paper, the gradient descent method is used to update the weights between each layer.
2.3. Hard Voting Model
Hard voting can be regarded as an integrated classifier that exists primarily in machine learning classification algorithms. It often outputs the class label directly. The core idea is to select the class label with the most output results in the algorithm. If several labels are equal in number in the prediction result, the class is selected in ascending order.
3. Empirical Research and Analysis
3.1. Selection and analysis of data sets
The data set for this article is from the Google Stock (2010-2023) dataset of the Kaggle website. Each row in the data set represents stock information for a trading day, and each column corresponds to an attribute. The date format is YYYY/MM/DD. Taking into account that some corporate actions may affect the stock value, such as stock splits and dividends. AdjClose is the adjusted closing price. Volume indicates the volume of stocks traded that day.
Considering that the data set essentially contains only three characteristic quantities: date, price, and trading volume, this paper first tries to use linear regression to fit the price, and then predicts the future price, and determines the next improvement plan through the fitting results of linear regression.
3.2. Data pre-processing
The missing value of the data is viewed by date, taking into account the closing of the market or the suspension of the stock, so the missing value is removed as an abnormal amount. Because the stock price is volatile, the data is first converted logarithmically and then normalized using the median and quartile moments.
3.3. The application results of three models
3.3.1. Application and analysis of linear regression model. Take the price of the current day as the target value, extract the price data of the previous five days, and make linear regression prediction for the price of Google stock in the following day.
The experimental results are displayed in Figure 2, the prediction model produces overfitting phenomenon, and the "predicted" curve is almost the result of the "real" curve translation. Although the accuracy of the model is as high as 98%, after checking the parameters, it is found that the weight on the first day is close to 1, and the weight on the remaining days is close to 0. It shows that the prediction of this model has no practical significance and it is unreasonable to use the linear regression model to predict the non-linear stock closing price.
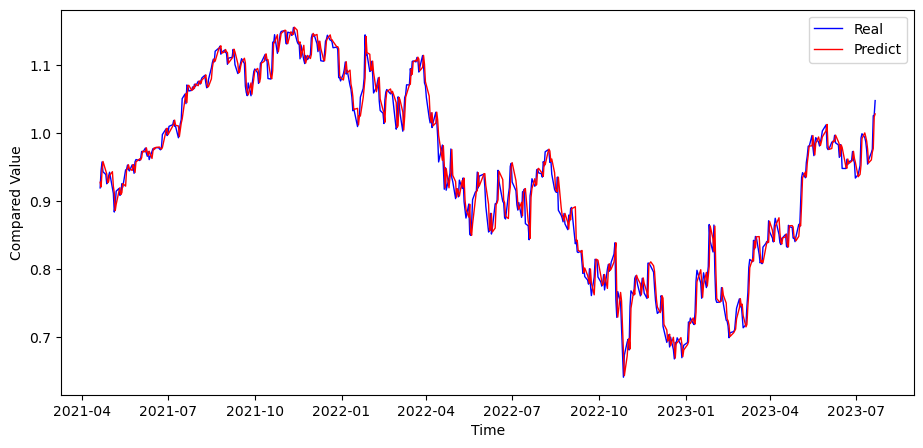
Figure 2. Linear regression test
3.3.2. Application and analysis of BP neural network. Through the application of linear regression model, it can seen that the trend of the price of the stock is not linear, and the stock price fluctuates greatly. Therefore, the BP neural network algorithm which simulates neurons is selected to predict the stock price by its self-adjustment.
Therefore, the back propagation neural network model designed in this paper also needs to input the price of the previous 5 days, and finally output the predicted price of the following day through the deep learning of a single hidden layer. After calculating the trial-and-error formula, num_hidden is set to 4 [6,7]. Learning_rate is set to 0.1 and the maximum number of executions is 1000. The sum of average absolute error and \( {R^{2}} \) is calculated by the code experimental results of the test set, and the model is evaluated.
The results of the code experiment using the test set are displayed in Figure 3. It illustrated that the prediction accuracy in the early stage is not high, but through continuous correction of the model, the eventual prediction result is more accurate. At the same time, the MAE of this model is about 0.07 and \( {R^{2}} \) equals to 1, indicating that the back propagation neural network model optimized based on the gradient descent method can predict the closing price of Google stock more accurately.
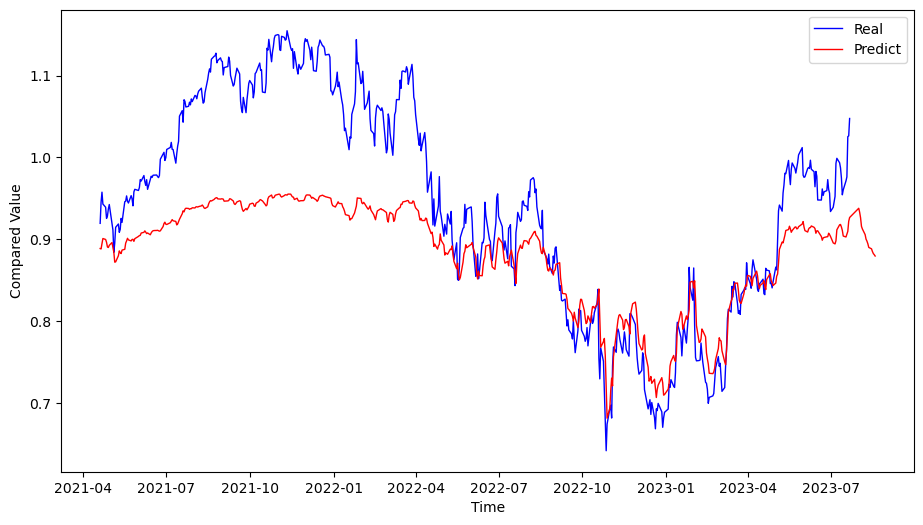
Figure 3. BP neural network test
3.3.3. Application and analysis of the hard voting model. Because the problem of predicting the rise and fall of stocks can be simplified into a binary problem, the hard voting method is chosen to predict the rise and fall of stocks by classification [8,9]. At the same time, the data set contains a small number of features, so the closing prices of the previous five days and the following day are extracted to calculate the stock price growth rate.
Set the tuple with a negative growth rate to 0 and the tuple with a positive growth rate to 1. Then the hard voting model is used to predict the rise and fall of the following day, and the Accuracy is calculated to evaluate the model.
The Accuracy of the experimental results is about 52%, which indicates that the model is not effective.
3.4. Model-based prediction results and analysis
To sum up, the back propagation neural network algorithm is more accurate in predicting the results [10]. So, the results predicted by the test set are used to manually make a reasonable prediction of the closing price of Google stock in the following 15 days.
The result of the final forecast is shown in Figure 4, which shows that the closing price of Google stock continues to decline over the next 15 days. Finally, the forecast results for the next 15 days are added to the original test set to draw a timeline. As shown in Figure 5, you can see the overall trend of the test data.
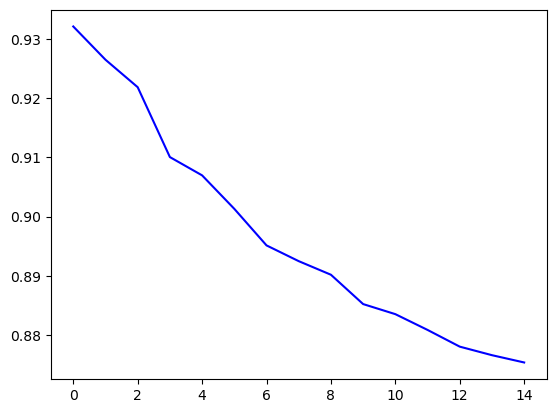
Figure 4. Closing price forecast for the next 15 days
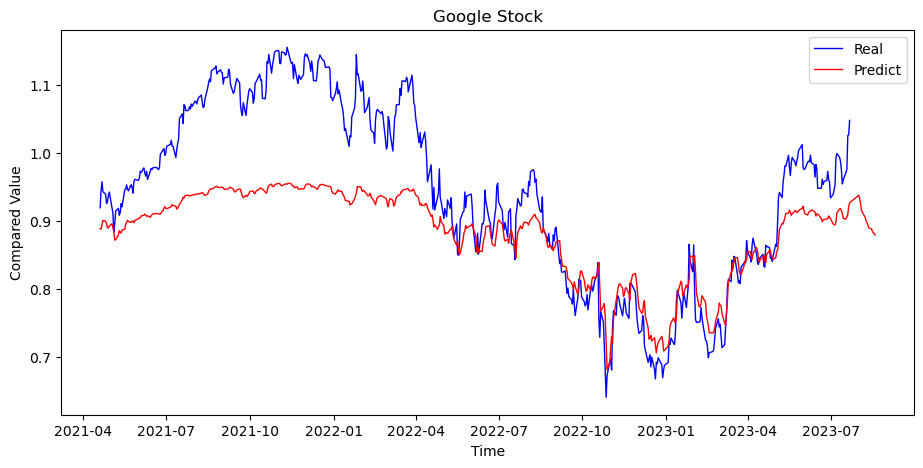
Figure 5. The overall result of the forecast
4. Conclusion
Predicting the future movement of stocks is always one of the key tasks of investors. While it is impossible to predict the precise price of a stock, choosing the right algorithmic model can indeed improve the accuracy and success rate of investment decisions.
This paper uses three models to forecast Google's stock price and analyze the results. The experimental results proved that simple linear regression is not suitable for predicting the stock price with large fluctuations. At the same time, due to the large fluctuation of stock prices, the prediction effect of the combination classifier is not ideal. The BP neural network model shows good prediction effect in stock price prediction. However, through testing, it can be found that the model's prediction results for stock return and growth rate are not ideal. When this model is used to predict the rate of return and growth rate of stocks, the results predicted by this model are similar to the results of speech recognition imaging, and it is difficult to capture the growth trend of stocks, as there is no obvious upward or downward trend and many external influencing factors are received. So this method still needs to be optimized. The next step is to try using a long short-term memory network (LSTM).
References
[1]. Huang, M. X. Yao, C. 2023, PSO-BP Neural Network Model Applied to Stock Prediction. (Journal of Fujian Computer, vol. 39), no. 3, pp. 36-40.
[2]. Ruan, B. B. 2021, Prediction of Stock Market by BP Neural Network Model (Conference Paper). (Journal of Physics: Conference Series, vol.1744), no. 4, pp. 042232
[3]. Zhang, D. H. Lou, S. 2021, The application research of neural network and BP algorithm in stock price pattern classification and prediction. (Future Generation Computer Systems, vol.115), pp. 872-879
[4]. Zeng, W. X. Qian, W. B. 2018 Wang Yinglong,et al.A stock forecasting method based on Python and BP neural network. (Computer Era, vol. 6), pp. 72-75+80.
[5]. Zou, J. H. 2021, Improved Particle Swarm Optimization stock prediction based on BP neural network . Shandong industrial technology, vol. 1), pp. 34-38.
[6]. Zhang, R. M. Zhang, H. M. 2021, Comparative analysis of BP neural network and ARMA-GARCH model in stock prediction . (Science Journal of Normal University, vol. 41), no. 5, pp. 14-20.
[7]. Xiao, L. Jin, L. Q. Wei, X. Y. 2020, Prediction of Stock Price Based on ARIMA and BP Neural Network Combined Model.Advances in Applied Mathematics, vol.9), no. 10, pp. 1776-1786.
[8]. Si, X. H. Wei, J. G. Wei, Y. J. 2022, Default risk prediction of Internet consumer finance borrowers based on weighted hard voting fusion model. (Journal of Wuhan University of Technology (Social Science Edition), vol. 35), no. 3, pp. 18-28
[9]. Jin, G. P. 2019 Planning of Shanghai Composite Index rise and fall forecast scheme based on Voting fusion algorithm. (Shanghai Normal University), 2019
[10]. Liu, X. Guo, J. H. Wang, H. Zhang, F. 2022, Prediction of stock market index based on ISSA-BP neural network. (Expert Systems with Applications,vol. 204), no. 117604
Cite this article
Sun,W. (2023). Google stock price prediction by the back propagation neural network. Theoretical and Natural Science,26,172-177.
Data availability
The datasets used and/or analyzed during the current study will be available from the authors upon reasonable request.
Disclaimer/Publisher's Note
The statements, opinions and data contained in all publications are solely those of the individual author(s) and contributor(s) and not of EWA Publishing and/or the editor(s). EWA Publishing and/or the editor(s) disclaim responsibility for any injury to people or property resulting from any ideas, methods, instructions or products referred to in the content.
About volume
Volume title: Proceedings of the 3rd International Conference on Computing Innovation and Applied Physics
© 2024 by the author(s). Licensee EWA Publishing, Oxford, UK. This article is an open access article distributed under the terms and
conditions of the Creative Commons Attribution (CC BY) license. Authors who
publish this series agree to the following terms:
1. Authors retain copyright and grant the series right of first publication with the work simultaneously licensed under a Creative Commons
Attribution License that allows others to share the work with an acknowledgment of the work's authorship and initial publication in this
series.
2. Authors are able to enter into separate, additional contractual arrangements for the non-exclusive distribution of the series's published
version of the work (e.g., post it to an institutional repository or publish it in a book), with an acknowledgment of its initial
publication in this series.
3. Authors are permitted and encouraged to post their work online (e.g., in institutional repositories or on their website) prior to and
during the submission process, as it can lead to productive exchanges, as well as earlier and greater citation of published work (See
Open access policy for details).
References
[1]. Huang, M. X. Yao, C. 2023, PSO-BP Neural Network Model Applied to Stock Prediction. (Journal of Fujian Computer, vol. 39), no. 3, pp. 36-40.
[2]. Ruan, B. B. 2021, Prediction of Stock Market by BP Neural Network Model (Conference Paper). (Journal of Physics: Conference Series, vol.1744), no. 4, pp. 042232
[3]. Zhang, D. H. Lou, S. 2021, The application research of neural network and BP algorithm in stock price pattern classification and prediction. (Future Generation Computer Systems, vol.115), pp. 872-879
[4]. Zeng, W. X. Qian, W. B. 2018 Wang Yinglong,et al.A stock forecasting method based on Python and BP neural network. (Computer Era, vol. 6), pp. 72-75+80.
[5]. Zou, J. H. 2021, Improved Particle Swarm Optimization stock prediction based on BP neural network . Shandong industrial technology, vol. 1), pp. 34-38.
[6]. Zhang, R. M. Zhang, H. M. 2021, Comparative analysis of BP neural network and ARMA-GARCH model in stock prediction . (Science Journal of Normal University, vol. 41), no. 5, pp. 14-20.
[7]. Xiao, L. Jin, L. Q. Wei, X. Y. 2020, Prediction of Stock Price Based on ARIMA and BP Neural Network Combined Model.Advances in Applied Mathematics, vol.9), no. 10, pp. 1776-1786.
[8]. Si, X. H. Wei, J. G. Wei, Y. J. 2022, Default risk prediction of Internet consumer finance borrowers based on weighted hard voting fusion model. (Journal of Wuhan University of Technology (Social Science Edition), vol. 35), no. 3, pp. 18-28
[9]. Jin, G. P. 2019 Planning of Shanghai Composite Index rise and fall forecast scheme based on Voting fusion algorithm. (Shanghai Normal University), 2019
[10]. Liu, X. Guo, J. H. Wang, H. Zhang, F. 2022, Prediction of stock market index based on ISSA-BP neural network. (Expert Systems with Applications,vol. 204), no. 117604