


1. Introduction
The ECG (electrocardiogram) is a test that measures the electrical activity of the heartbeat. With each beat, an electrical impulse travels through the heart. This wave causes the muscle to squeeze and pump blood from the heart [1-5]. The right and left atria e-polarization makes the first “P wave” [2]. The right and left ventricles depolarization makes the next “QRS complex,” which also contains the repolarization of the atrial. The ventricle repolarization makes the “T wave.”
In general, an electrocardiograph is a graph recording changes in electric potential, which occurs between electrodes placed between a patient’s torsos to aid in the practical demonstration of an individual’s general cardiac activity [3]. This medical-electrical technique is quite essential for many patients. It can be used for effective detection of structural abnormalities and poor blood flows in patients. The electrodes used in the ECG procedure are transducers made of either salts or metals, and an ECG procedure requires approximately 10 electrodes at different body points [10, 11]. To effectively obtain signals from such electrical concepts, effective procedures must be strictly followed.
In this lab, we designed a circuit to record the ECG and convert that ECG signal we received to a version we could clearly observe. We then used a data acquisition system to import our data into Matlab and generated a final plot of the ECG.
The circuit we built consists of three stages. The first stage is an instrumentation amplifier that is comprised of three functions. Its primary function is to enlarge the signal’s amplitude, which was initially too weak for us to observe. It can also measure the voltage difference and serve as a buffer to keep the circuit from being saturated [4, 7, and 8]. The second stage is a bandpass filter. It functions as both the high-pass and the low-pass filter to cut off ECG frequencies that weren’t needed and to keep the ECG frequencies at a specific range. The bandpass filter is an inverting filter that acquires a gain of about 1. The third stage is an inverting amplifier, and its function is to invert the inverted signal back to normal and provide gain.
When building the circuit, it also requires close attention to the troubleshooting and testing of each stage of the circuit to ensure that each stage of the circuit operates properly.
The data acquisition system samples the conditioned ECG signal and imports it into Matlab for display. The ECG plot of an individual can be analyzed to obtain a number of vital information, such as the heart rate of the individual.
2. Theoretical design
An Op-amp is an integrated circuit that is used in the amplification of electrical signals. Usage of Op-amps was thus highly necessary in the circuit construction.
• We situated the gain of the differential amplifier at 25.4 (G=25.4) so that the voltage caused by temperature drop could be more pronounced. We placed the value of G in the formula Rg = 49.4kohm/(G-1) and calculated the voltage of Rg to be 2 Kohm. We then used a multimeter to measure the real value of Rg, which was 1.965 Kohm.
• We situated the cutoff frequency between 0.01 Hz and 225.75 Hz. Based on the specific values of capacitors in the lab, we chose Cf = 0.005 μF. According to the formula 20Pi rad/s = 1/(RfCf), we yielded that the value of Rf ≈ 150 Kohm. We used the multimeter to measure the real value of Rf = 147.7 Kohm. Because the gain of the low pass filter should be 1, the value of Ri was supposed to be equal to Rf, and the real value of Ri = 148.5 ohms. According to the formula 20Pi rad/s = 1/(RiCi), we discovered that the value of Ci should be 102.5 μF ≈ 100 μF.
• To make the total gain of the whole circuit 100, we made the gain of the third stage to be 4 and settled Rf at 47 Kohm. The actual value of Rf was 46.43 Kohm. According to the formula Rf / Rc = G, Rc =11.7 ≈ 10 Kohm. The real value of Rc was 9.82 Kohm.
3. ECG circuit design
• The first stage of the electrical circuit design involved the building of the AD620 instrumentation amplifier.
|
Figure 1. The design drawing of the AD620 amplifier with the designed value of the resistor |
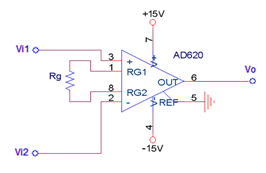
• The diagram above is the instrumentation amplifier, which was tasked with numerous roles during the experiment. The primary role of the instrumentation amplifier was to aid the amplification of the signal amplitude for more accessible observation [10]. The instrumentation amplifier also measured the voltage differences and further served as a circuit buffer.
• A bandpass filter in the circuit was constructed in the second stage of the circuit design.
|
Figure 2. The design drawing of the OP07AH amplifier with the designed value of resistor and capacitor |
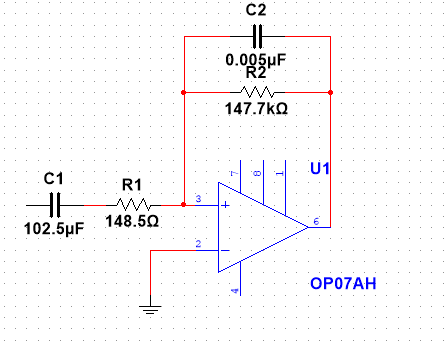
• The second stage of the circuit construction involved the building of a bandpass filter. The circuit consists of an operational amplifier, two resistors, and two capacitors, which parameters are stated in the diagram [6]. The primary role of a bandpass filter was to block signals of both lower and higher frequencies, thus allowing for only the desired signals to pass. The bandpass filter had a unit gain of 1.
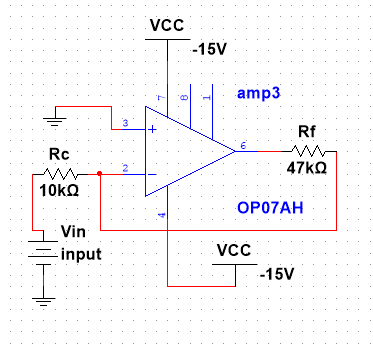
• The third stage of the circuit construction involved the construction of an inverting amplifier.
• The circuit below is an inverting amplifier whose primary role was to bring the inverted signal back into its normal form [11]. The circuit construction also supported the provision of again.
|
Figure 3. The drawing of the second OP07AH amplifier with the designed value of the resistor |
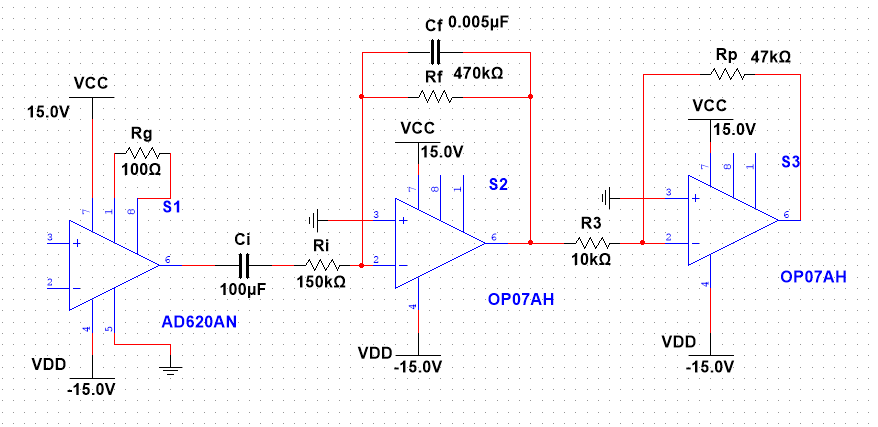
• A revised version of the whole ECG circuit: increased gain to 500
• The diagram below shows the three stages of the instrumentation amplifier, the bandpass amplifier, and the inverting amplifier.
|
Figure 4. The drawing of the total designed system with designed value |
4. Circuit function verification
To understand how each circuit stage works, we connected each stage to the input signal and tested their output signal separately. According to the difference between input and output signal, we realized that the first stage produced a signal and amplified it by 500; the second stage filtered out unnecessary signals with a too high or too low frequency; the third stage inverted the whole signal and amplified it as well. Then we were able to corroborate that the whole ECG circuit would work as expected to generate valuable results.
In the first stage of our circuit, we adjusted and tested the wave generator to create a 100 mV peak, a 30 Hz sine wave input, +15V and -15V for DC power supply, and the oscilloscope was used to measure the input and output signal. We were able to calculate the actual gain with that input and output signal and compare it with the theoretical gain. The actual gain was 23.675 and was close to the theoretical value of 25.
In the second stage of our circuit, we adjusted and tested the DC power supply to +15V and -15V output voltage and used the wave generator to create a 100mV peak to peak, 30 Hz sine wave input. To evaluate whether the cutoff frequencies were successfully set to 0.01Hz and 225 Hz, we increased the frequency of the input signal and observed a decrease in output voltage. This proved that the bandpass filter took the signal with a high frequency out of the system. We then collected a series of gains and transferred them into dB. The plot of dB versus frequency showed a linear decreasing pattern after the designed higher passband, which proved that stage 2 was accurately functioning.
In the third stage of our circuit, we intended to check if the gain was set to 4 as expected and if the signal was inverted. We charged the opamp with +-15V voltage and used an oscillator to create a 100mV peak to peak, 30 Hz sine wave input. We then tested the input and output together with the oscillator and derived the real gain to be 3.13. The output wave appeared to be opposite to the input, so the third stage was functioning properly.
During the experiment, we changed the gain for the instrumentation amplifier from 25.4 to 500 and processed it again through the bandpass filter, which was about 3.13, to make the signal clearer. We also changed the cutoff frequency from 0.01Hz-225Hz to 0.01Hz-72Hz. We then troubleshot and remeasured the gain and cutoff frequency. However, when we attempted to use the data acquisition system, we found that the National Instruments Data Acquisition Module USB-6211 was not functioning, which might occur because of instrument malfunction and other troubles. In addition, we found that our ECG signal, which appeared in the oscillator, displayed considerably distracting noises.
5. ECG signal data analysis
To ensure that our circuit worked as expected, we first calculated the theoretical resistance value of each stage using the equation Rg = 49.4kohm/(G-1), then selected the resistor with the closest value to build the circuit and used an oscillator to create an input signal with small frequency. We subsequently used an oscillator to measure the amplitude of input and output signal and divide the output by input to verify if the specific opamp created gain as expected. Our actual data was within an acceptable range of percent error compared to the theoretical value. The error was due to imperfect op-amps, so that we would assess our data collection as successful. The corresponding calculations of percent error in gain are listed in table I.
Table 1. Theoretical and experimental contraction | |||
Data | Theoretical Value | Actual Value | % Error |
Gd (1st stage) | 25 | 23.675 | 3.79 |
Gc (1st stage) | 0 | 0.364 | • (TV = 0) |
CMRR (1st stage) | 100 | 83.5 | 16.5 |
Gd (2nd stage) | 1 | 0.95 | 5 |
6. MatLab evaluation
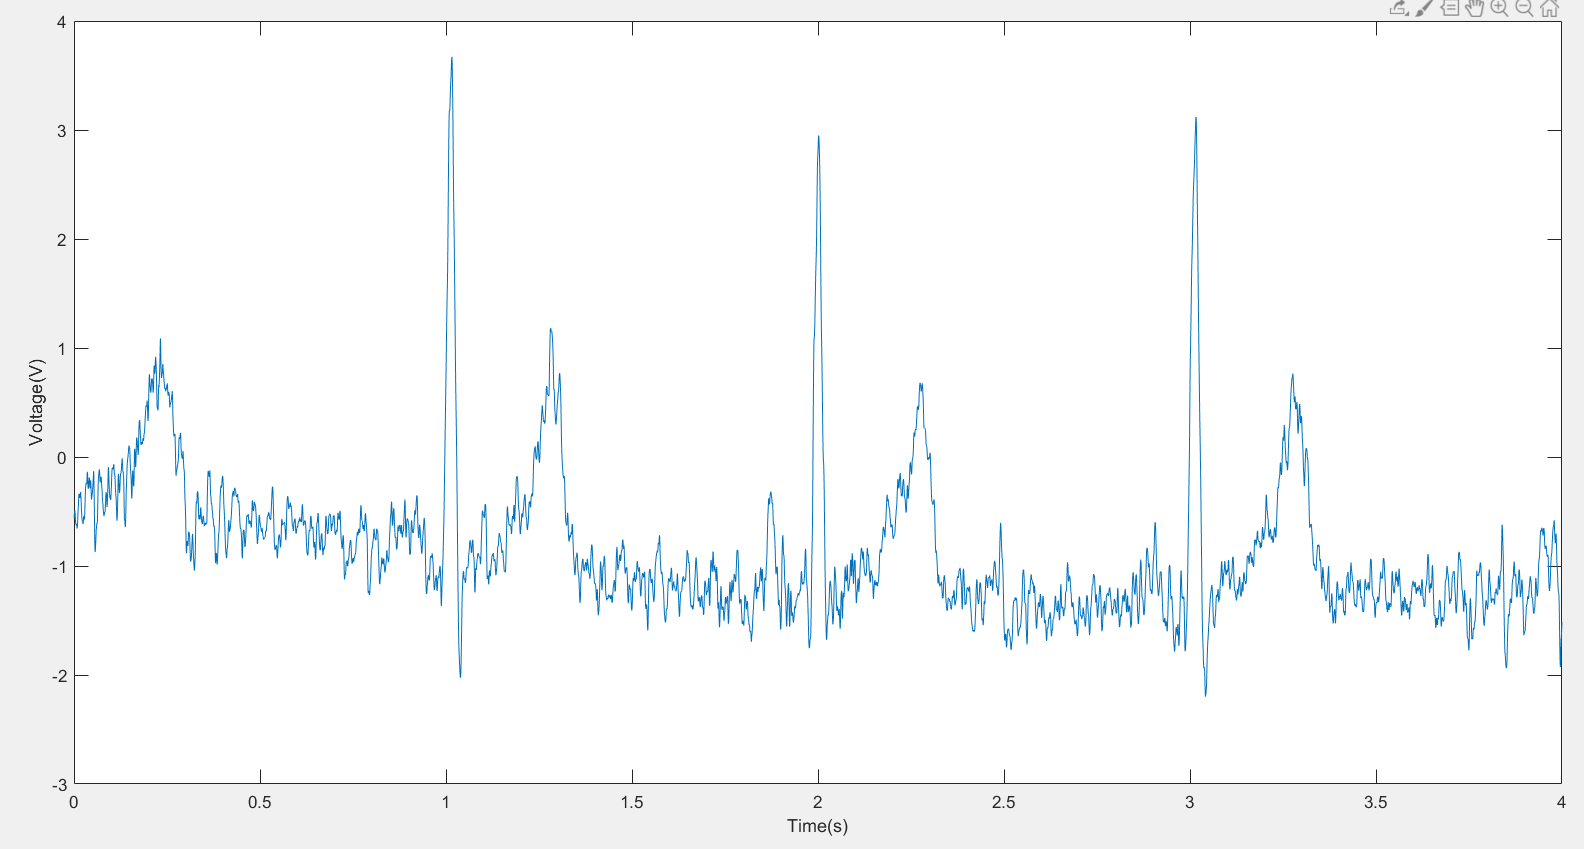
After analyzing the data, we plotted an ECG diagram using MATLAB. According to the picture, the ECG signal included PQRST stages with little noise.
|
Figure 5. This plot is a real-time human ECG plot using MATLAB, it first starts with a T wave and a small p wave following, then is the QRS complex and follows a T wave and U wave. A clear ECG cycle can be seen at the second wave. |
7. Conclusion
For this ECG lab, our main purpose is to acquire the ECG signal of the subject and analyze the signal. To achieve such goal, a circuit is needed to amplify the weak signal, which can rarely be caught, and then a data acquisition system is required to obtain the data in a single plot. In general, our experiment was successful in terms of the circuit building as we successfully tested and troubleshot each stage of our circuit, and we were able to discover a general trend of the ECG plot in the oscillator. However, the signal still appeared noisy for a single-lead ECG recording system.
Testing all the instruments to guarantee proper operation is a major step during the experiment. When we connected the circuit, it required us to ensure that each clip was connected appropriately and cables were checked to secure clean signals. In this way, we could acquire signals of higher quality. Drawing the circuit diagrams before connecting the actual circuit can also make our work in achieving the general demands of the experiment much more effective and successful.
References
[1]. Berkaya, Selcan Kaplan, et al. "A survey on ECG analysis." Biomedical Signal Processing and Control 43 (2018): 216-235.
[2]. L. Keselbrener, M. Keselbrener, and S. Akselrod, “Nonlinear high pass filter for R-wave detection in ECG signal,” Med. Eng. Phys., vol. 19, no. 5, pp. 481–484, 1997.
[3]. M. S. Manikandan and K. P. Soman, “A novel method for detecting R-peaks in electrocardiogram (ECG) signal,” Biomed. Signal Process. Control, vol. 7, no. 2, pp. 118–128, 2012.
[4]. S. Ari, M. K. Das, and A. Chacko, “ECG signal enhancement using S-Transform,” Comput. Biol. Med., vol. 43, no. 6, pp. 649–660, 2013.
[5]. S. C. Yener and R. Mutlu, “A microcontroller-based ECG signal generator design utilizing microcontroller PWM output and experimental ECG data,” in 2018 Electric Electronics, Computer Science, Biomedical Engineerings’ Meeting (EBBT), 2018, pp. 1–4.
[6]. L. Ju-Won and L. Gun-Ki, “Design of an adaptive filter with a dynamic structure for ECG signal processing,” Int. J. Control Autom. Syst., vol. 3, no. 1, pp. 137–142, 2005.
[7]. L. Wieclaw, Y. Khoma, P. Falat, D. Sabodashko, and V. Herasymenko, “Biometrie identification from raw ECG signal using deep learning techniques,” in 2017 9th IEEE International Conference on Intelligent Data Acquisition and Advanced Computing Systems: Technology and Applications (IDAACS), 2017, vol. 1, pp. 129–133.
[8]. M. Blanco-Velasco, B. Weng, and K. E. Barner, “ECG signal denoising and baseline wander correction based on the empirical mode decomposition,” Comput. Biol. Med., vol. 38, no. 1, pp. 1–13, 2008.
[9]. “ShieldSquare Captcha,” Iop.org. [Online]. Available: https://iopscience.iop.org/article/10.1088/1742-6596/970/1/012012/meta. [Accessed: 28-Oct-2021].
[10]. S. Cuomo, G. De Pietro, R. Farina, A. Galletti, and G. Sannino, “A novel O ( n ) numerical scheme for ECG signal denoising,” Procedia Comput. Sci., vol. 51, pp. 775–784, 2015.
[11]. Y. Xu and G.-Y. Liu, “A method of emotion recognition based on ECG signal,” in 2009 International Conference on Computational Intelligence and Natural Computing, 2009, vol. 1, pp. 202–205.
Cite this article
Zhu,Q. (2023). Single-Lead ECG Signal Collecting System Design. Theoretical and Natural Science,4,287-292.
Data availability
The datasets used and/or analyzed during the current study will be available from the authors upon reasonable request.
Disclaimer/Publisher's Note
The statements, opinions and data contained in all publications are solely those of the individual author(s) and contributor(s) and not of EWA Publishing and/or the editor(s). EWA Publishing and/or the editor(s) disclaim responsibility for any injury to people or property resulting from any ideas, methods, instructions or products referred to in the content.
About volume
Volume title: Proceedings of the 2nd International Conference on Biological Engineering and Medical Science (ICBioMed 2022), Part II
© 2024 by the author(s). Licensee EWA Publishing, Oxford, UK. This article is an open access article distributed under the terms and
conditions of the Creative Commons Attribution (CC BY) license. Authors who
publish this series agree to the following terms:
1. Authors retain copyright and grant the series right of first publication with the work simultaneously licensed under a Creative Commons
Attribution License that allows others to share the work with an acknowledgment of the work's authorship and initial publication in this
series.
2. Authors are able to enter into separate, additional contractual arrangements for the non-exclusive distribution of the series's published
version of the work (e.g., post it to an institutional repository or publish it in a book), with an acknowledgment of its initial
publication in this series.
3. Authors are permitted and encouraged to post their work online (e.g., in institutional repositories or on their website) prior to and
during the submission process, as it can lead to productive exchanges, as well as earlier and greater citation of published work (See
Open access policy for details).
References
[1]. Berkaya, Selcan Kaplan, et al. "A survey on ECG analysis." Biomedical Signal Processing and Control 43 (2018): 216-235.
[2]. L. Keselbrener, M. Keselbrener, and S. Akselrod, “Nonlinear high pass filter for R-wave detection in ECG signal,” Med. Eng. Phys., vol. 19, no. 5, pp. 481–484, 1997.
[3]. M. S. Manikandan and K. P. Soman, “A novel method for detecting R-peaks in electrocardiogram (ECG) signal,” Biomed. Signal Process. Control, vol. 7, no. 2, pp. 118–128, 2012.
[4]. S. Ari, M. K. Das, and A. Chacko, “ECG signal enhancement using S-Transform,” Comput. Biol. Med., vol. 43, no. 6, pp. 649–660, 2013.
[5]. S. C. Yener and R. Mutlu, “A microcontroller-based ECG signal generator design utilizing microcontroller PWM output and experimental ECG data,” in 2018 Electric Electronics, Computer Science, Biomedical Engineerings’ Meeting (EBBT), 2018, pp. 1–4.
[6]. L. Ju-Won and L. Gun-Ki, “Design of an adaptive filter with a dynamic structure for ECG signal processing,” Int. J. Control Autom. Syst., vol. 3, no. 1, pp. 137–142, 2005.
[7]. L. Wieclaw, Y. Khoma, P. Falat, D. Sabodashko, and V. Herasymenko, “Biometrie identification from raw ECG signal using deep learning techniques,” in 2017 9th IEEE International Conference on Intelligent Data Acquisition and Advanced Computing Systems: Technology and Applications (IDAACS), 2017, vol. 1, pp. 129–133.
[8]. M. Blanco-Velasco, B. Weng, and K. E. Barner, “ECG signal denoising and baseline wander correction based on the empirical mode decomposition,” Comput. Biol. Med., vol. 38, no. 1, pp. 1–13, 2008.
[9]. “ShieldSquare Captcha,” Iop.org. [Online]. Available: https://iopscience.iop.org/article/10.1088/1742-6596/970/1/012012/meta. [Accessed: 28-Oct-2021].
[10]. S. Cuomo, G. De Pietro, R. Farina, A. Galletti, and G. Sannino, “A novel O ( n ) numerical scheme for ECG signal denoising,” Procedia Comput. Sci., vol. 51, pp. 775–784, 2015.
[11]. Y. Xu and G.-Y. Liu, “A method of emotion recognition based on ECG signal,” in 2009 International Conference on Computational Intelligence and Natural Computing, 2009, vol. 1, pp. 202–205.