


1. Introduction
The intersection of econometrics and data science represents a significant evolution in the methodology of economic research and analysis. Econometrics, with its foundation in statistical models and emphasis on understanding relationships between economic variables, has long been the cornerstone of empirical economics. However, the advent of data science, characterized by its focus on machine learning algorithms, big data analytics, and the processing of unstructured data, offers a new set of tools and methodologies to tackle the increasingly complex and nuanced challenges facing economists today. This paper embarks on a comprehensive examination of how the integration of econometrics and data science is reshaping the landscape of economic analysis, fostering a more sophisticated understanding of economic dynamics and providing actionable insights for economic policy. The significance of this integration lies not only in the enhancement of analytical capabilities but also in its potential to address limitations inherent in traditional econometric approaches. The advent of big data and the proliferation of digital information sources have resulted in datasets of unprecedented scale and complexity, challenging conventional methods of economic analysis. In response, the fusion of econometrics and data science introduces innovative approaches to model selection, data processing, and predictive analytics, enabling economists to navigate the vast landscapes of data more effectively. Furthermore, this interdisciplinary approach facilitates a more dynamic and flexible framework for economic analysis, capable of adapting to the rapidly changing economic environment. By leveraging the computational power and advanced algorithms of data science, researchers can explore complex, non-linear relationships and patterns within data that were previously inaccessible, offering new perspectives on economic phenomena. As we delve into the theoretical underpinnings and methodological advancements brought about by this integration, we also highlight practical applications across various domains of economic analysis [1]. From enhancing economic forecasting and policy analysis to improving risk management in financial markets and informing public policy through social economic analysis, the convergence of econometrics and data science stands as a pivotal development in the field. This paper aims to provide a thorough overview of the current state of this interdisciplinary area, identifying key contributions, challenges, and future directions for research and application.
2. Theoretical Foundations
2.1. Econometric Principles and Data Science Techniques
Econometric analysis has traditionally served as the backbone for empirical research in economics, employing statistical models to understand and quantify the relationships between economic variables. A fundamental approach in econometrics involves regression analysis, where relationships between a dependent variable and one or more independent variables are estimated. However, the advent of data science has expanded the econometric toolbox, introducing machine learning algorithms such as random forests, support vector machines, and neural networks. These algorithms excel in identifying complex, nonlinear relationships and interaction effects in large and diverse datasets, often beyond the reach of traditional econometric methods [2]. For instance, machine learning’s capability to process high-dimensional data allows for the inclusion of numerous potential explanatory variables without the need to pre-specify a rigid model form. This flexibility can unveil hidden patterns and relationships in the data, providing new insights into economic phenomena. Moreover, big data analytics, part of the data science domain, enables the handling of vast amounts of unstructured data, such as text and images, which can be transformed into quantitative measures and included in econometric models. An application of this integration can be seen in sentiment analysis of social media posts to predict stock market trends, where traditional econometric models are augmented with natural language processing techniques, a data science tool, to capture the sentiment of investors and its impact on stock prices.
2.2. Mathematical Models in Economic Analysis
Mathematical modeling in economics aims to formalize theories and concepts into structured frameworks that can be empirically tested. One compelling example of a mathematical model that illustrates the integration of data science techniques and traditional econometric methods is the Cobb-Douglas production function:
\( Y=A×{L^{α}}×{K^{β}} \ \ \ (1) \)
Where Y is the total production (the amount of output), A is a constant representing total factor productivity, L is the amount of labor used, K is the amount of capital used, α and β are the output elasticities of labor and capital, respectively, which are constants that measure the responsiveness of output to a change in levels of either labor or capital. This model embodies the properties of increasing returns to scale if α+β>1, constant returns to scale if α+β=1, and decreasing returns to scale if α+β<1.
Econometric models often take the form of equations that relate a set of explanatory variables to a response variable, allowing for hypothesis testing and prediction [3]. The integration of data science introduces a paradigm shift in how these models are constructed and estimated. For example, the use of computational algorithms facilitates the exploration of models that include interaction terms, nonlinearities, and high-dimensional data inputs without sacrificing computational efficiency. An important contribution of data science to mathematical modeling in economics is the application of optimization algorithms. These algorithms can efficiently solve complex models that are nonlinear, dynamic, and subject to numerous constraints, which are common in economic analyses. Consider the problem of optimizing an agent’s utility function subject to budget constraints over time, a common problem in macroeconomic models. Data science techniques, such as genetic algorithms and gradient descent methods, offer powerful solutions to these optimization problems, enabling economists to solve more realistic and complex models that better capture the dynamics of economic systems.
2.3. Quantitative Analysis and Predictive Modeling
Quantitative analysis in econometrics has been greatly enhanced by the predictive capabilities introduced through data science methodologies. Traditional econometric forecasting techniques, such as ARIMA models for time series analysis, are now complemented with machine learning-based predictive models. These models can handle a broader array of data characteristics, including non-stationarity and high frequency, which are challenging for traditional models. A significant advancement in this area is the application of machine learning algorithms for predictive modeling in economic forecasting. For example, ensemble methods, which combine predictions from multiple models to improve forecast accuracy, have shown great promise in economic prediction tasks. These methods can integrate traditional time-series models with machine learning predictors, thereby leveraging the strengths of both approaches [4]. Furthermore, the incorporation of cross-validation techniques from data science ensures that the predictive models are robust and not overfitted to historical data, enhancing their reliability for economic forecasting. In addition, the use of neural networks, particularly recurrent neural networks (RNNs) and long short-term memory (LSTM) networks, has revolutionized the forecasting of economic time series data. These models are adept at capturing complex patterns in sequential data, making them particularly useful for predicting economic indicators over time. An application of this is in the prediction of GDP growth rates, where LSTM models can incorporate a wide range of economic and non-economic indicators (such as sentiment indices derived from text data) to forecast future growth with a higher degree of accuracy than traditional models:
\( {GDP_{t+1}}=LSTM({GDP_{t}}, {U_{t}},{I_{t}}, {C_{t}},{S_{t}},{R_{t}}, {Sent_{t}}) \ \ \ (2) \)
Where \( {GDP_{t+1}} \) is the predicted GDP growth rate for the next time period, LSTM represents the Long Short-Term Memory model function, \( {GDP_{t}} \) is the GDP growth rate at time t, \( {U_{t}} \) is the unemployment rate at time t, \( {I_{t}} \) is the inflation rate at time t, \( {C_{t}} \) is the consumer confidence index at time t, \( {S_{t}} \) is the stock market index at time t, \( {R_{t}} \) is the interest rate at time t, \( {Sent_{t}} \) is the sentiment index derived from text data (e.g., news articles, social media) at time t.
3. Methodological Advancements
3.1. Big Data and Econometric Analysis
The integration of big data into econometric analysis has necessitated the development of new methodological frameworks to manage the sheer volume, velocity, and variety of data. One of the primary challenges is ensuring data quality, especially given the heterogeneous sources of big data. To address this, econometricians employ sophisticated data cleaning and preprocessing techniques, such as anomaly detection algorithms and imputation methods for handling missing data, ensuring the reliability and accuracy of econometric analyses. Dimensionality reduction is another critical area, as econometric models traditionally struggle with the “curse of dimensionality.” Techniques such as Principal Component Analysis (PCA) and t-Distributed Stochastic Neighbor Embedding (t-SNE) are increasingly used to extract relevant features and reduce the dimensionality of data without significant loss of information. These methods help in identifying underlying patterns and relationships in the data that are not apparent in high-dimensional space [5]. Furthermore, the integration of unstructured data (e.g., text, images) into econometric models presents new opportunities for analysis. Natural Language Processing (NLP) and image recognition techniques are being applied to convert unstructured data into a structured form that can be incorporated into econometric models. This allows for a more comprehensive analysis that takes into account a wider range of information sources, including social media sentiment, news articles, and visual data, thereby enriching the econometric analysis with nuanced insights that were previously unattainable [6].
3.2. Machine Learning and Model Selection
Machine learning (ML) algorithms have become indispensable in the econometric model selection process. These algorithms, through methods such as Lasso and Ridge regression, automatically identify and select variables that contribute most significantly to the predictive accuracy of a model. This automation significantly reduces the time and expertise required for model selection, allowing econometricians to focus on interpretation and further analysis. Moreover, ML algorithms facilitate the exploration of non-linear relationships and interactions among variables that traditional econometric models may overlook. Table 1 synthesizes the application of ML algorithms in the econometric model selection process. Techniques such as Random Forests and Gradient Boosting Machines (GBMs) are adept at capturing complex patterns in the data, offering a more nuanced understanding of the economic phenomena under study. However, the use of ML in econometrics is not without challenges. One of the key issues is the “black box” nature of many ML models, which can impede interpretability and the understanding of causal relationships. Efforts are underway to develop more interpretable ML models and techniques, such as SHAP (SHapley Additive exPlanations) values, that provide insights into the contribution of each variable to the predictive model, thereby bridging the gap between predictive power and interpretability [7].
Table 1. Comparative Analysis of Variable Importance in Econometric Model Selection Using Machine Learning Algorithms
Variable | Lasso Coefficients | Ridge Coefficients | Random Forest Importance | GBM Importance | SHAP Values (Impact on Model Output) |
X1 (Economic Growth) | 0.85 | 0.82 | 0.30 | 0.35 | 0.80 |
X2 (Interest Rate) | -0.24 | -0.22 | 0.25 | 0.20 | -0.20 |
X3 (Inflation Rate) | 0.00 | 0.05 | 0.20 | 0.25 | 0.15 |
X4 (Unemployment Rate) | 0.00 | 0.03 | 0.15 | 0.10 | 0.05 |
X5 (Consumer Sentiment) | 0.52 | 0.50 | 0.10 | 0.10 | 0.40 |
4. Practical Applications
4.1. Economic Forecasting and Policy Analysis
The integration of econometrics and data science has revolutionized economic forecasting and policy analysis by facilitating the use of comprehensive datasets and sophisticated predictive models. For instance, a notable case study involves the use of machine learning algorithms to forecast economic growth rates across different countries. By incorporating a wide array of variables, including GDP, trade balances, inflation rates, and even social media sentiment indices, analysts were able to predict economic downturns with a higher degree of accuracy than traditional models. Furthermore, the application of ensemble methods, which combine the forecasts of multiple models, has been shown to significantly reduce forecast errors. This enhanced forecasting capability is crucial for policymakers who rely on accurate economic predictions to make informed decisions regarding monetary policy, fiscal adjustments, and other economic interventions. In another example, the European Central Bank utilized advanced time-series models, integrating machine learning techniques, to assess the potential impact of quantitative easing on inflation and unemployment rates [8]. The models incorporated not only traditional economic indicators but also novel data sources, such as online job postings and consumer sentiment analysis from social media, to provide a more nuanced view of the economy.
4.2. Financial Markets and Risk Management
The financial sector has witnessed the benefits of merging econometrics and data science, especially in the realm of market analysis and risk management. A compelling case is the development of predictive models for stock market volatility using high-frequency trading data. These models, built on the foundation of GARCH (Generalized Autoregressive Conditional Heteroskedasticity) models and enhanced with machine learning algorithms like Random Forests and Support Vector Machines, have provided investors and risk managers with more reliable measures of market risk. Additionally, the application of network analysis, a data science technique, to examine the interconnectedness of financial institutions, has improved the understanding of systemic risk in the financial system. This approach has been pivotal in identifying potential points of failure and implementing preemptive measures to mitigate financial crises. Another significant application is in the area of credit risk assessment. Financial institutions now employ complex models that integrate traditional credit scoring models with data science techniques, including natural language processing of borrowers’ digital footprints, to predict default probabilities [9]. These models have proven to be particularly effective in enhancing the accuracy of risk assessment, thereby reducing the incidence of bad loans and optimizing capital allocation.
4.3. Social Economic Analysis and Public Policy
The confluence of econometrics and data science has also enriched the analysis of social economic issues and the formulation of public policies. A notable application is in the evaluation of education policies. By leveraging large-scale educational data and applying causal inference models, researchers have been able to assess the effectiveness of various teaching methods and interventions on student outcomes. For example, the use of Difference-in-Differences (DiD) analysis, augmented with machine learning techniques to control for confounding variables, has provided insights into the impact of technology integration in classrooms on student performance, as shown in Figure 1.
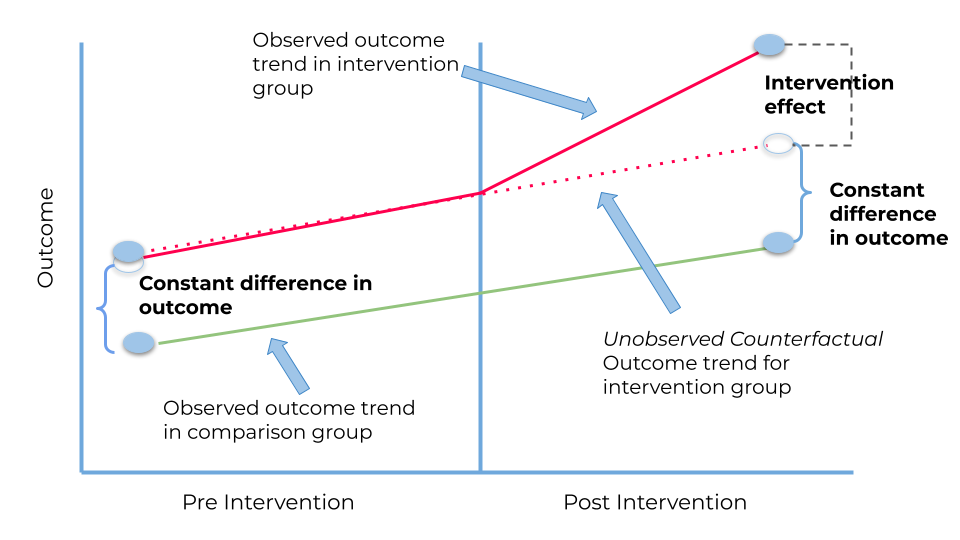
Figure 1. Difference-in-Differences
In the realm of public health policy, the integration of these disciplines has facilitated the analysis of the socioeconomic determinants of health and the effectiveness of health interventions. A case in point is the use of predictive analytics to model the spread of infectious diseases and evaluate the potential impact of vaccination programs, quarantine measures, and other public health interventions. By incorporating a wide range of data sources, including healthcare records, mobility data, and social media activity, these models have provided policymakers with valuable insights for decision-making during health crises.
5. Conclusion
The integration of econometrics and data science marks a significant milestone in the evolution of economic analysis. This interdisciplinary approach not only enriches the econometric toolbox with advanced data science techniques but also opens up new horizons for understanding and interpreting complex economic phenomena. The theoretical foundations laid by the fusion of these disciplines enhance our capacity to model economic dynamics accurately, while methodological advancements address the challenges posed by big data and the need for more sophisticated analytical techniques. Practical applications in economic forecasting, financial market analysis, and public policy evaluation further underscore the value of this integration, offering more precise and actionable insights for economic decision-making. As we navigate the complexities of modern economic landscapes, the confluence of econometrics and data science emerges as a powerful ally, equipping researchers, policymakers, and practitioners with the tools necessary for informed analysis and effective intervention. However, the journey is far from complete. The ongoing challenge lies in refining these methodologies, improving model interpretability, and extending their application to new and emerging areas of economic inquiry. The future of economic analysis, shaped by the continuing integration of econometrics and data science, promises not only enhanced analytical precision but also a deeper understanding of the economic forces that shape our world.
References
[1]. Bekun, F. V., et al. “Econometrics analysis on cement production and environmental quality in European Union countries.” International Journal of Environmental Science and Technology 20.4 (2023): 4265-4280.
[2]. Di Vece, Marzio, Diego Garlaschelli, and Tiziano Squartini. “Reconciling econometrics with continuous maximum-entropy network models.” Chaos, Solitons & Fractals 166 (2023): 112958.
[3]. Ahmad, Mahyudin, and Stephen G. Hall. “The growth effects of economic and political institutions: new evidence from spatial econometrics analysis using historical-based institutional matrix.” Economic Change and Restructuring 56.2 (2023): 749-780.
[4]. Aldieri, Luigi, Andrea Gatto, and Concetto Paolo Vinci. “Panel data and descriptor for energy econometrics–an efficiency, resilience and innovation analysis.” Quality & Quantity 57.2 (2023): 1649-1656.
[5]. Himeur, Yassine, et al. “AI-big data analytics for building automation and management systems: a survey, actual challenges and future perspectives.” Artificial Intelligence Review 56.6 (2023): 4929-5021.
[6]. Pebesma, Edzer, and Roger Bivand. Spatial data science: With applications in R. Chapman and Hall/CRC, 2023.
[7]. Zamani, Efpraxia D., et al. “Artificial intelligence and big data analytics for supply chain resilience: a systematic literature review.” Annals of Operations Research 327.2 (2023): 605-632.
[8]. Quvvatov, Behruz. “SQL DATABASES AND BIG DATA ANALYTICS: NAVIGATING THE DATA MANAGEMENT LANDSCAPE.” Development of pedagogical technologies in modern sciences 3.1 (2024): 117-124.
[9]. Alsmadi, Ayman Abdalmajeed, et al. “Big data analytics and innovation in e-commerce: current insights and future directions.” Journal of Financial Services Marketing (2023): 1-18.
Cite this article
Zhao,Y.;Liu,W.;Yan,Y.;Li,F. (2024). Navigating the confluence of econometrics and data science: Implications for economic analysis and policy. Theoretical and Natural Science,38,26-31.
Data availability
The datasets used and/or analyzed during the current study will be available from the authors upon reasonable request.
Disclaimer/Publisher's Note
The statements, opinions and data contained in all publications are solely those of the individual author(s) and contributor(s) and not of EWA Publishing and/or the editor(s). EWA Publishing and/or the editor(s) disclaim responsibility for any injury to people or property resulting from any ideas, methods, instructions or products referred to in the content.
About volume
Volume title: Proceedings of the 2nd International Conference on Mathematical Physics and Computational Simulation
© 2024 by the author(s). Licensee EWA Publishing, Oxford, UK. This article is an open access article distributed under the terms and
conditions of the Creative Commons Attribution (CC BY) license. Authors who
publish this series agree to the following terms:
1. Authors retain copyright and grant the series right of first publication with the work simultaneously licensed under a Creative Commons
Attribution License that allows others to share the work with an acknowledgment of the work's authorship and initial publication in this
series.
2. Authors are able to enter into separate, additional contractual arrangements for the non-exclusive distribution of the series's published
version of the work (e.g., post it to an institutional repository or publish it in a book), with an acknowledgment of its initial
publication in this series.
3. Authors are permitted and encouraged to post their work online (e.g., in institutional repositories or on their website) prior to and
during the submission process, as it can lead to productive exchanges, as well as earlier and greater citation of published work (See
Open access policy for details).
References
[1]. Bekun, F. V., et al. “Econometrics analysis on cement production and environmental quality in European Union countries.” International Journal of Environmental Science and Technology 20.4 (2023): 4265-4280.
[2]. Di Vece, Marzio, Diego Garlaschelli, and Tiziano Squartini. “Reconciling econometrics with continuous maximum-entropy network models.” Chaos, Solitons & Fractals 166 (2023): 112958.
[3]. Ahmad, Mahyudin, and Stephen G. Hall. “The growth effects of economic and political institutions: new evidence from spatial econometrics analysis using historical-based institutional matrix.” Economic Change and Restructuring 56.2 (2023): 749-780.
[4]. Aldieri, Luigi, Andrea Gatto, and Concetto Paolo Vinci. “Panel data and descriptor for energy econometrics–an efficiency, resilience and innovation analysis.” Quality & Quantity 57.2 (2023): 1649-1656.
[5]. Himeur, Yassine, et al. “AI-big data analytics for building automation and management systems: a survey, actual challenges and future perspectives.” Artificial Intelligence Review 56.6 (2023): 4929-5021.
[6]. Pebesma, Edzer, and Roger Bivand. Spatial data science: With applications in R. Chapman and Hall/CRC, 2023.
[7]. Zamani, Efpraxia D., et al. “Artificial intelligence and big data analytics for supply chain resilience: a systematic literature review.” Annals of Operations Research 327.2 (2023): 605-632.
[8]. Quvvatov, Behruz. “SQL DATABASES AND BIG DATA ANALYTICS: NAVIGATING THE DATA MANAGEMENT LANDSCAPE.” Development of pedagogical technologies in modern sciences 3.1 (2024): 117-124.
[9]. Alsmadi, Ayman Abdalmajeed, et al. “Big data analytics and innovation in e-commerce: current insights and future directions.” Journal of Financial Services Marketing (2023): 1-18.