


1. Introduction
From the first industrial revolution to the rapid development of high technology today, the automobile is undoubtedly one of humanity’s greatest inventions, pivotal to the process of industrialization. While its emergence significantly propelled industrialization, it concurrently introduced environmental and energy challenges, such as climate change, to human society. As a major emitter of greenhouse gases, China faces increasing political and economic pressure due to climate change in the processes of industrialization and urbanization. Therefore, we should actively adopt energy and environmental policies for intervention and adjustment. Entering the 21st century, with lithium batteries as the representative, the energy density of energy storage units has rapidly increased, resolving the endurance problem that has plagued the electric vehicle industry for nearly a century. The development path of electric vehicles has broadened, gradually making them mainstream products in the market [1, 2].
The goal of this paper is to comprehensively consider various factors, including the ecological impact of pure electric bus fleets on regions, the potential external costs of replacing vehicle models, and complete the long-term planning for the replacement of large metropolitan buses. By utilizing this model, we aim to predict and formulate the most suitable pure electric bus development plan for urban development with a population of more than 500,000.
The first model is to help the city understand the ecological impact that the transition from a mixed mode of fuel cars and electric cars to a pure electric bus fleet may bring. The second model is to explore the financial impact that the transition will soon bring to the urban. This paper consider the additional costs and potential external funds caused by the transition, which will influence the final ten-year transformation plan for the city [3, 4]. Using a comparative approach between fuel buses and electric buses, we will comprehensively consider additional factors due to the conversion to rank expenditures from high to low. The third step will integrate the two models mentioned above to provide a ten-year planning roadmap for the selected city, explaining its rationality and practicability. This model will help alleviate environmental pollution and energy crises caused by traditional vehicle models.
2. Methodology
2.1. Energy required and consumption
Considering the energy consumption of each vehicle over a distance of 100 kilometers as comprising three components. The first component is the energy required for manufacturing fuel [5]. The second component is the fuel consumption for each type of vehicle over the 100-kilometer distance. For conventional fuel-powered vehicles as shown in Eq. (1). For electric vehicles as shown in Eq. (2). According to tailpipe emissions, the energy equivalent of CO2 emissions from diesel vehicles were calculated.
\( {P_{D}}{×T_{D100}}= {E_{TD}} \ \ \ (1) \)
\( {P_{{CO_{2}}}}{×T_{EC100}}{=T_{{CO_{2}}}} \ \ \ (2) \)
where P is the price of purchasing the buses and its value is 1000000 RMB; PD is the energy for manufacture of diesel per gallon; \( {P_{{CO_{2}}}} \) is the CO2 emitted for 1kwh of electricity; T is the tax of buying the buses and its value is 100000 RMB.
2.2. Population growth to the number of buses
Due to the simultaneous growth of the population and the rise in the number of buses in response to this population growth, this paper will derive two formulas through fitting using population and bus data from Beijing.
The observed population growth in the data aligns with logistic regression, as a region’s population typically exhibits an upper limit constrained by available resources. Similarly, the growth of buses follows a comparable logic: even with an increasing population and greater demand for buses, the rate of bus additions tends to decelerate.
The relationship between time and population is shown in Eq. (3). The relationship between population and vehicles is shown in Eq. (4).
\( {N_{p}}=\frac{2469.61809}{{1+1.3225×e^{-0.1069t}}} \ \ \ (3) \)
where Np is the number of people in the city.
\( {N_{b}}=\frac{23169.42}{{1+1942.7e^{{-0.00544N_{p}}}}} \ \ \ (4) \)
where Nb is the total number of buses in the city.
2.3. Vehicle conversion quantity model
Due to the decreasing trend of diesel buses over time and the necessity to compensate for this reduction, as shown in Eq. (5).
\( |{N_{D}}|{=N_{C1}} \ \ \ (5) \)
where Nd is the number of buses using diesels; Nc is the number of buses using batteries(cell).
Additionally, to ensure an overall upward trend and considering that all new vehicles added annually due to population growth in recent years in Beijing data are electric buses, the Eq. (6)-(9) was proposed.
\( {N_{b}}{=N_{C2}} \ \ \ (6) \)
\( t=n t=n+1\ \ \ (7) \)
\( {N_{C}}{=N_{b}}+|{N_{D}}| \ \ \ (8) \)
\( |{N_{D}}|{=370×e^{-0.013x}} \ \ \ (9) \)
Through Eq. (9), the year at which the sum of \( |{N_{D}}| \) is equal to NDinit by integrating can be obtained, which is also marked the end of this model, as shown in Eq. (10).
\( {N_{D}}init=\int _{0.1}^{n}{e^{-0.013t}}dt \ \ \ (10) \)
2.4. Termination condition
According to the given prompt, the model will stop predicting when the number of diesel buses reaches zero. This serves as our termination condition. In the final state is shown in Eq. (11).
\( {E_{total}}{=N_{D}}{{{×E_{D}}+N_{C}}×E_{C}} \ \ \ (11) \)
where ND value is the total number of buses in the city; Ec is the ecological evaluation index of each E-buses (kJ/car) and the value is 9.8921987588×10⁹.
2.5. Model for bus company’s income
This study presents a prospectus for the future development of electric buses in Beijing over the next decade [6]. Despite the relatively low fare and the resulting deficit status of public bus transportation in Beijing, we contend that advertising fees incurred by the transit companies should be considered within the scope of their overall revenue. This paper undertakes a fitting and predictive analysis of the anticipated changes in electric bus demand, concurrently speculating on the future revenue trends of the public transit companies.
In this analysis, meticulously account for the contribution of advertising fees, aiming to reveal the economic conditions of future public transit systems in a more comprehensive and scholarly manner. The research endeavors to furnish a reliable theoretical foundation for future urban transportation planning, considering the diversification of income sources in public transit. The text handles the reduction of diesel buses and the introduction of electric buses on an incremental basis due to the discrete nature of the data. Subsequently, linear regression is employed to facilitate the presentation of a comprehensive model [7].
2.6. Model for future growth of the number of buses
This study suggests that the annual growth of electric buses in public transit aligns with an exponential pattern, acknowledging diverse plans and objectives across governments, organizations, and companies. This assertion is grounded that public transit companies’ planning akin to the national GDP’s annual growth plan of X%, with the electric bus quantity developing at a fixed rate of M% each year. It’s worth noting that the increase in electric buses tends to stabilize once it meets population demands. This highlights the relevance of exponential functions in describing such trends, offering a clear explanation of the regularity in electric bus growth. As of the writing of this paper, the public transit group has not yet released the electric bus data for 2023, as the year has not concluded. Considering the calculation starting from 2022, the tenth year falls in 2033 (Eq. (12)).
\( r=\frac{{Nb_{n+1}}}{{Nb_{1}}} \ \ \ (12) \)
where 𝑁1 is 23456 (number of electric bus in 2022), 𝑁11 is 38774.
3. Results and discussion
3.1. Ecological evaluation
3.1.1. Ecological evaluation index. The term “environmental impact” poses a challenging state to quantify. Here, all energy consumption is considered as various forms of pollution. Given that energy usage involves conversion processes, inherent losses and inefficiencies exist in each step. Consequently, within our assumption, emissions can be interchangeably viewed as a form of energy.
In analysis, adopt a comprehensive approach using the life cycle analysis method to thoroughly incorporate energy consumption and noise generated from the vehicle. This spans from its deployment to its decommissioning [8]. Certain values employed in our assessment, such as the energy required for gasoline production, remain essentially constant and are not significantly influenced by different urban environments. These values are considered fixed parameters in analysis.
3.1.2. Ecological evaluation model. Through the formulas, the number of years were obtained, denoted as “n”, for the diesel buses to reach zero when transitioning from a certain proportion of diesel buses (Eq. (13)).
\( n=-\frac{1}{0.013}×ln(\frac{0.013}{370}×{N_{b}}init×{N_{D}}ratio +{e^{-0.013}}\ \ \ (13) \)
This represents the difference between the sum of the Ecological Evaluation Index in the final state and the sum of the Ecological Evaluation Index in the initial state (Eq. (14)).
\( {E=(E_{C}}×\frac{23169.3}{{1+1942.7e^{-\frac{13.435}{{1+1.323e^{-0.107n}}}}}}{-(E_{D}} {×N_{b}}{init×N_{D}}{ratio+E_{D}}{×N_{b}}init×({1-N_{d}}ratio))\ \ \ (14) \)
If E0, the ecological consequence of changing to a full electic bus fleet is positive; otherwise, we believe it is negative. ED is the ecological evaluation index of each diesel buses (kJ/car) and its’ value is 6.1290×10¹⁰.
3.2. Full life cycle cost for public buses
3.2.1. Maintenance cost. The comprehensive maintenance cost for a single electric bus should encompass both the direct expenses associated with repairs and the subsidy allocated for recycling. Maintenance costs for a bus exhibit dynamic variation over its life cycle. As time progresses, these expenses gradually diminish due to escalating labor costs [9].
Consequently, the overall maintenance cost is intricately linked to factors such as labor costs, inherent repair expenses, and the subsidy granted for recycling. Hence, the maintenance cost can be expressed as Eq. (15).
\( {C_{0}}=N+M-S \ \ \ (15) \)
Regarding labor costs (N), these costs and average wages will consistently escalate due to the influences of inflation and currency appreciation or depreciation. Technological advancements contribute to a gradual reduction in actual repair expenses as high-tech solutions become more prevalent. Simultaneously, the burgeoning population, coupled with increasing price levels, leads to an augmented demand for wages naturally expect their remuneration to rise over time.
Drawing insights from corporate reports, such as those from Beiqi Foton, it is evident that labor costs tend to increase at an annual rate of 5%. Consequently, the function for labor cost (N) was calculated as 7.61.05t RMB.
In depicting the relationship between exclusive maintenance costs (y) and time (x), the serves as a visual representation of how these costs evolve over the specified timeframe. It provides a clear visualization of the trends and patterns associated with exclusive maintenance costs, allowing for a more nuanced understanding of the dynamic nature of these expenses [10].
In the pursuit of the most realistic fit to real-world scenarios, select an exponential function with the base ‘e’ for curve-fitting analysis. This choice is making our model more reflective of practical circumstances. The resulting mathematical expression, derived from the curve-fitting exercise, adds another layer of sophistication to analysis. Table 1 is the average cost of Full life cycle electricity retirement allowance. It not only enhances the precision of predictions but also aligns more closely with the complex and evolving nature of exclusive maintenance costs within the context of a prolonged 10-year forecast was 5.881.05-0.16t RMB.
Table 1. Average cost of Full life cycle electricity retirement allowance.
Year | 1 | 2 | 3 | 4 | 5 | 6 | 7 | 8 |
10,000 RMB | 108 | 118 | 128 | 137 | 147 | 156 | 166 | 175 |
Upon the decommissioning of a fully electric bus, governmental regulations stipulate that each retired vehicle is entitled to a subsidy equivalent to 4% of the initial purchase cost. The bus scrapping subsidy is 4.4104 RMB, the total cost of the whole process from purchasing to scrapping is (7.661.05t+5.881.05-0.16t-4.4104) RMB.
3.2.2. Using buses cost. Within the scope of this research, focus centers on the operational costs of fully electric buses, with a particular emphasis on the electricity consumption expenses incurred by an individual bus over the course of a year [11]. This cost primarily involves expenditures related to electrical power. As such, we define the methodology for calculating the annual total electricity cost as the product of the annual mileage and the energy consumption per kilometer, further multiplied by the unit cost of electricity.
The average distance a bus travels in a year was 73440 km. The lack of direct correlation between the annual mileage of a fully electric bus and its overall life cycle. In other words, the yearly mileage is presumed to remain constant throughout the vehicle’s operational life. To establish a consistent and reliable estimate for the annual mileage, we extract specific driving data for individual buses from charts provided by Beiqi Foton (Table 2).
Table 2. Basic Information Investigated from BeiQi Foton
One way (km) | Pure electric range(km) | Daily round trip | Daily mileage (km) | Annual operating days(Days) | Annual operating mileage(km) |
18 | 200 | 6 | 216 | 340 | 73440 |
Energy consumption per kilometer reflects the bus’s efficiency in using electricity over a distance, which was calculated as 115kWh/100km. the average price of electricity (Pi) represents the financial aspect of procuring the required energy, which was calculated as 0.75 RMB/kWh. The cost of using the buses and its value is 59120. The prices of purchasing the buses and its value is 1000000 RMB. The fuel cost of Diesel is 8.04 RMB/L. The fuel cost of electricity was 0.7 RMB/kWh
After finding the points corresponding to each part, overlay them to obtain the cost of a single pure electric bus in different years of its life cycle, which is (7.661.05t+5.881.05-0.16t-4.4+111.5) 104 RMB. The total cost of all the buses throughout a year is \( \frac{(7.66{1.05^{t}}+{5.88^{-0.16t}}-4.4+111.5)23169}{{1+1942.7e^{-0.00544{N_{p}}}}} \)
3.2.3. Charging station cost. Public charging stations for fully electric buses constitute a pivotal infrastructure supporting the electrification of urban public transportation. Generally, charging station costs encompass equipment procurement, installation fees, land leasing costs (if applicable), power connection charges, as well as operational and maintenance expenses, denoted collectively as charging. The power capacity of charging stations is contingent on design specifications and market demands.
For the purposes of this study, focus on a specific type of charging station, namely the dual-gun 240 kW station, with a cost of 70,000 RMB per station. This cost encompasses equipment procurement, installation, and power connection charges. Furthermore, the power and interface design of charging stations dictate the types of electric vehicles they can service. The dual-gun 240 kW charging station studied here has the capacity to simultaneously service four buses, with the construction quantity contingent upon the number of buses in the fleet.
While government support for electric transportation infrastructure development is prevalent in many regions, including subsidies, tax incentives, reduced land rents, or direct government grants for charging infrastructure, it’s crucial to note that, as described in the preceding section denoted as R, the Chinese government will cease subsidies for electric bus-related constructions by 2023. Consequently, this aspect is excluded from the considerations in this paper. In line with focus on charging station construction considerations, land costs are omitted from this model. The total cost of building public charging piles is \( \frac{4.055{10^{8}}}{{1+1942.7e^{-\frac{13.435}{1+{1.323e^{-0.107t}}}}}} \)
3.3. Prospect and expectation for the next 10 years
3.3.1. Company’s income. Based on official data from the Beijing Public Transport Group, as of the year 2022, the inventory of diesel buses stands at 9318 vehicles. To comprehensively consider the scenarios involving the replacement of diesel buses and the addition of new electric buses in the future, this study combines this figure with the anticipated number of new electric vehicles (6000 units). Consequently, the total number of buses in 2022 is calculated to be 15,318.
Concurrently, employing a linear regression approach based on the annual industrial output values from 2000 to 2016 in the data provided by the Beijing Public Transport Group (Table 3 and Figure 1). This research estimates the total industrial output of the public transit company for the years 2023 to 2032. This analytical process aims to offer more precise predictions for the economic activities of the public transit company in the coming decade through trend inference. Through this rigorous and logical methodology, we can achieve a more comprehensive understanding and outlook for the future development and economic performance of the public transportation system in Beijing. We can conclude that: y=8987.4845x-1.789×10⁷ (The variable y represents the industrial output of the public transit company in the year x).
Table 3. The number of bus from 2000 to 2016
Year | Income | Income |
2000 | 89986 | 16717 |
2001 | 94473 | 19221 |
2002 | 81044 | 21049 |
2003 | 52099 | 22696 |
2004 | 99763 | 24153 |
2005 | 105893 | 24091 |
2006 | 128455 | 25409 |
2007 | 128543 | 25368 |
2008 | 229406 | 28071 |
2009 | 85616 | 27963 |
2010 | 86833 | 27569 |
2011 | 118544 | 28343 |
2012 | 285170 | 21218 |
2013 | 269054 | 22555 |
2014 | 150963 | 22630 |
2015 | 159612 | 22250 |
2016 | 170343 | 29515 |
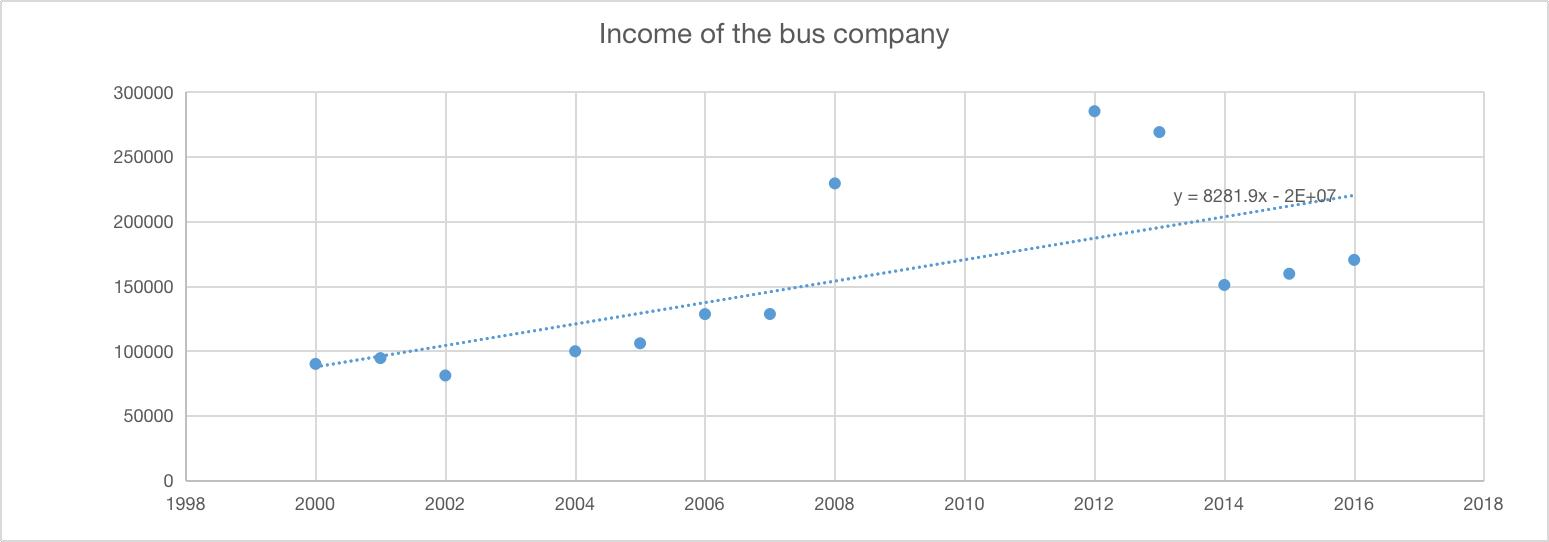
Figure 1. Using a linear function to fit the data. (Photo/Picture credit: Original)
3.3.2. Future growth of the number buses. In the scenario where the growth rate (r) is determined to be 1.046753, indicating that the electric bus quantity in the second year grows by approximately 1.05 times relative to the first year, this study can construct a progressive data table for the annual demand for electric buses, as shown in Table 4. 𝑁1 is 23456 (number of electric bus in 2022), 𝑁11 is 38774.
Table 4. Blueprint of buying electric bus and charging piles and relating costs
Income (RMB) | Expense (RMB) | Number of bus | Growth number | Income minus expense (RMB) | Cost per bus (RMB) | Total maintain cost (RMB) | |
2022 | 282,695.48 | 23456 | |||||
2023 | 291,682.96 | 234,429.62 | 24553 | 1097 | 57,253.34 | 5.00 | 122,846.67 |
2024 | 300,670.45 | 226,160.13 | 25700 | 1147 | 74,510.32 | 4.26 | 109,360.34 |
2025 | 309,657.94 | 219,615.09 | 26902 | 1201 | 90,042.84 | 3.62 | 97,354.56 |
2026 | 318,645.42 | 214,643.38 | 28159 | 1257 | 104,002.04 | 3.08 | 86,666.80 |
2027 | 327,632.91 | 211,112.23 | 29476 | 1316 | 116,520.68 | 2.62 | 77,152.36 |
2028 | 336,620.39 | 208,905.33 | 30854 | 1378 | 127,715.07 | 2.23 | 68,682.43 |
2029 | 345,607.88 | 207,921.08 | 32297 | 1442 | 137,686.79 | 1.89 | 61,142.35 |
2030 | 354,595.36 | 208,071.11 | 33807 | 1509 | 146,524.25 | 1.61 | 54,430.03 |
2031 | 363,582.85 | 209,278.86 | 35387 | 1580 | 154,303.98 | 1.37 | 48,454.60 |
2032 | 372,570.33 | 211,478.45 | 37042 | 1654 | 161,091.89 | 1.16 | 43,135.17 |
2033 | 381,557.82 | 214,613.54 | 38773 | 1731 | 166,944.28 | 0.99 | 38,399.71 |
With the annual data on the number of buses in hand, can calculate the financial outlay required for the procurement of new energy equipment. Based on data provided by Beiqi Foton Motor Co., Ltd. (the primary supplier for the Beijing public transit system), the approximate purchase price for each electric bus is 1 million RMB. Given the relatively longer charging time for electric buses compared to the refueling time for diesel buses, there arises a demand for more charging stations. According to statistics, the ratio of electric buses to charging stations is approximately 1: 4. The acquisition cost for each charging station is 70,000 RMB.
3.3.3. Application of the maintenance cost. Exponential functions suit this problem, reflecting national economic growth’s impact on rising labor costs and decreasing machine costs. With battery electric buses being predominantly recent, and not yet reaching full coverage, we assume the government won’t incur additional expenses [12, 13]. Some buses with external wiring have disposal costs similar to diesel buses, forming a natural scrapping process without special considerations. This argument underscores the relevance of exponential functions in describing economic factors, offering a nuanced analysis of electric bus disposal costs (Eq. (16)). This paper delineates the annual maintenance costs (W), as illustrated as Table 5.
\( y=5.88t-0.16\ \ \ (16) \)
where y represents the annual maintenance cost for every two electric buses, and t denotes the time interval from the year 2023 (with t=1 in 2023).
Table 5. Government fiscal expense in the next 10 years (Data credit: Original)
Year | 2023 | 2024 | 2025 | 2026 | 2027 | 2028 | 2029 | 2030 | 2031 | 2032 |
Expense (RMB) | 109360 | 97355 | 86667 | 77152 | 68682 | 61142 | 54430 | 48455 | 43135 | 38400 |
Despite rising demand for electric buses, Beijing Public Transit Group covers procurement costs with ample revenue, earning 13.3 billion over a decade without subsidies. Our model predicts Tokyo’s successful integration, while Los Angeles, initially short on buses, can complete the plan by 2035 with 66.7% financial assistance. This is because Los Angeles needs to buy a large number of buses and charging piles in a short time. Table 6 is the prospect for the future consumption of buses and charging piles. Figure 2 is the population of Los angeles from 1990 to 2023. Table 7 is the data of future expectation of buses in Los Angeles. Table 8 is Tokyo future prediction.
Table 6. The prospect for the future consumption of buses and charging piles
Number of buses | Number of charging piles | |
2022 | 23456 | 5864 |
2023 | 24553 | 6138 |
2024 | 25701 | 6425 |
2025 | 26902 | 6726 |
2026 | 28160 | 7040 |
2027 | 29476 | 7369 |
2028 | 30855 | 7714 |
2029 | 32297 | 8074 |
2030 | 33807 | 8452 |
2031 | 35388 | 8847 |
2032 | 37042 | 9261 |
2033 | 38774 | 9261 |
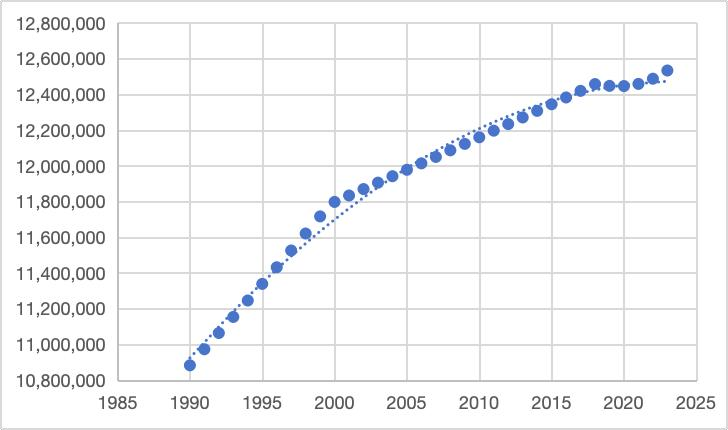
Figure 2. The population of Los angeles from 1990 to 2023 (Photo/Picture credit: Original)
Table 7. Data of future expectation of buses in Los Angeles
Year | Number of buses | Number of charging pile | Spend | Income | Income minus Expence |
2020 | 4000 | 571 | 404000 | 354750 | 660250 |
2021 | 4640 | 662 | 468640 | 363738 | 622574 |
2022 | 5382 | 769 | 543622.4 | 372725 | 574552.6 |
2023 | 6243 | 892 | 630601.984 | 381713 | 514537.016 |
2024 | 7242 | 1034 | 731498.3014 | 390700 | 440601.6986 |
2025 | 8401 | 1200 | 848538.0297 | 3999688 | 11150525.97 |
2026 | 9745 | 1392 | 984304.1144 | 408675 | 241720.8856 |
2027 | 11304 | 1615 | 1141792.773 | 417663 | 111196.2273 |
2028 | 13113 | 1873 | 1324479.616 | 426650 | -44529.6163 |
2029 | 15211 | 2173 | 1536396.355 | 435638 | -229482.355 |
2030 | 17645 | 2520 | 1782219.772 | 444625 | -448344.771 |
2031 | 20469 | 2924 | 2067374.935 | 453613 | -706535.935 |
2032 | 23744.1081 | 3392.01545 | 2398154.925 | 462600 | -1010354.92 |
2033 | 27543.1654 | 3934.73792 | 2781859.713 | 471588 | -1367095.71 |
2034 | 31950.0719 | 4564.29599 | 3226957.267 | 480575 | -1785232.26 |
2035 | 37062.0834 | 5294.58335 | 3743270.43 | 489563 | -2274581.43 |
Table 8. Tokyo future prediction (income-expense=147483 RMB)
Year | Number of buses | Number of charging pile | Spend | Income | Income minus Expense |
2020 | 3280 | 546 | 331826.6667 | 264718.69 | 197610.7133 |
2021 | 3608 | 601 | 365009.3333 | 273706.17 | 182403.0067 |
2022 | 3968 | 661 | 401510.2667 | 282695.4788 | 163880.6909 |
2023 | 4365 | 727 | 441661.2933 | 291682.9642 | 141704.6351 |
2024 | 4802 | 800 | 485827.4227 | 300670.4496 | 115513.4765 |
2025 | 5282 | 880 | 534410.1649 | 309657.935 | 84905.70507 |
2026 | 5810 | 968 | 587851.1814 | 318645.4204 | 49439.65937 |
2027 | 6391 | 1065 | 646636.2996 | 327632.9058 | 8629.512031 |
2028 | 7030 | 1171 | 711299.9295 | 336620.3912 | -38059.14713 |
2029 | 7734 | 1289 | 782429.9225 | 345607.8766 | -91214.16928 |
2030 | 8507 | 1417 | 860672.9147 | 354595.362 | -151482.1907 |
2031 | 9358 | 1559 | 946740.2062 | 363582.8474 | -219574.5114 |
2032 | 10294 | 1715 | 1041414.227 | 372570.3328 | -296273.5612 |
4. Conclusion
To achieve carbon neutrality and reduce carbon emissions, the utilization of clean energy is imperative. Over the next decade, the number of fuel-powered buses is expected to gradually decrease, giving way to their electric counterparts. Concurrently, sustained population growth is anticipated, resulting in an upward trend in the demand for public transportation. This study asserts that public transit agencies predominantly lean towards the procurement of new energy electric buses when acquiring new vehicles. Notably, the paper does not delve into the subsidies and income derived from the phase-out of diesel buses, as transit agencies have already incurred corresponding (or even greater) costs during the initial purchase of these vehicles. The model proposed in this study posits mainly about that the annual acquisition of new electric buses and charging stations is contingent upon the budget for the year and the previous year’s expenditure of the transit company. Simultaneously, the research refrains from an in-depth discussion on the impact of government subsidies, as per our model’s predictions, the fiscal revenue of the transit agencies is anticipated to sufficiently cover the procurement of charging stations and electric buses, along with the maintenance costs. This elucidation underscores the significance of decision-making and fiscal feasibility in transitioning to new energy sources in the public transportation sector, providing robust theoretical support for future urban transportation planning.
References
[1]. Peled I, Lee K, Jiang Y 2021 Comm. Trans. Res. 1 100008
[2]. An K 2020 Trans. Res. Part C: Eme. Tech. 111 572-587
[3]. Wu X, Feng Q, Bai C 2021 Energy 224 120106
[4]. Liu Z and Song Z 2017 Trans. Res. Part C: Eme. Tech. 83 77-103
[5]. Gao Z, Lin Z, La T 2017 Energy 122 588-600
[6]. Yang Y, Zhang Y, Tian J 2018 Energies 11 2177
[7]. Zhang Z, Ma T, Ji N 2019 Adva. Mech. Engi. 11 16878.
[8]. Liu Y 2018 Beijing: Beijing Jiaotong University (in Chinese)
[9]. Wang J, Kang L, Liu Y 2020 Rene. Sustain. Ene. Rev. 130 109978
[10]. Wang F 2014 Beijing: Beijing Jiaotong University (in Chinese)
[11]. Chen Y and Vincent F 2022 Mob. Trans. in China
[12]. 2024 Ene. and the Environ.
[13]. Bahar S K and Ali K 2016 Entropy 18 387
[14]. https://www.bjbus.com/home/index.php
Cite this article
Liang,R. (2024). Environmental impact and cost study of vehicles. Theoretical and Natural Science,48,108-117.
Data availability
The datasets used and/or analyzed during the current study will be available from the authors upon reasonable request.
Disclaimer/Publisher's Note
The statements, opinions and data contained in all publications are solely those of the individual author(s) and contributor(s) and not of EWA Publishing and/or the editor(s). EWA Publishing and/or the editor(s) disclaim responsibility for any injury to people or property resulting from any ideas, methods, instructions or products referred to in the content.
About volume
Volume title: Proceedings of the 2nd International Conference on Environmental Geoscience and Earth Ecology
© 2024 by the author(s). Licensee EWA Publishing, Oxford, UK. This article is an open access article distributed under the terms and
conditions of the Creative Commons Attribution (CC BY) license. Authors who
publish this series agree to the following terms:
1. Authors retain copyright and grant the series right of first publication with the work simultaneously licensed under a Creative Commons
Attribution License that allows others to share the work with an acknowledgment of the work's authorship and initial publication in this
series.
2. Authors are able to enter into separate, additional contractual arrangements for the non-exclusive distribution of the series's published
version of the work (e.g., post it to an institutional repository or publish it in a book), with an acknowledgment of its initial
publication in this series.
3. Authors are permitted and encouraged to post their work online (e.g., in institutional repositories or on their website) prior to and
during the submission process, as it can lead to productive exchanges, as well as earlier and greater citation of published work (See
Open access policy for details).
References
[1]. Peled I, Lee K, Jiang Y 2021 Comm. Trans. Res. 1 100008
[2]. An K 2020 Trans. Res. Part C: Eme. Tech. 111 572-587
[3]. Wu X, Feng Q, Bai C 2021 Energy 224 120106
[4]. Liu Z and Song Z 2017 Trans. Res. Part C: Eme. Tech. 83 77-103
[5]. Gao Z, Lin Z, La T 2017 Energy 122 588-600
[6]. Yang Y, Zhang Y, Tian J 2018 Energies 11 2177
[7]. Zhang Z, Ma T, Ji N 2019 Adva. Mech. Engi. 11 16878.
[8]. Liu Y 2018 Beijing: Beijing Jiaotong University (in Chinese)
[9]. Wang J, Kang L, Liu Y 2020 Rene. Sustain. Ene. Rev. 130 109978
[10]. Wang F 2014 Beijing: Beijing Jiaotong University (in Chinese)
[11]. Chen Y and Vincent F 2022 Mob. Trans. in China
[12]. 2024 Ene. and the Environ.
[13]. Bahar S K and Ali K 2016 Entropy 18 387
[14]. https://www.bjbus.com/home/index.php