


1. Introduction
This paper focuses on the dynamic price transmission relationship between the U.S. dollar, the price of gold and crude oil. Whether recent interest rate fluctuations in the dollar directly affect the market price of gold, and how to analyze and determine this effect. The experiment looks at the effect of dollar fluctuations on the price range of gold by using a regression model and analyzes the price characteristics of the dollar and gold. The study will consider the impact of external factors, such as financial markets and political changes, on the relationship between the U.S. dollar and the price of gold, to provide investors with valuable investment advice.
Gold as an investment tool is seen to protect financial assets and is famous for its ability to hedge against market turbulence [1]. As a global currency, the US dollar is used in most international transactions and settlements. Studies have shown that the dollar maintains its importance in key areas of international trade and finance [2]. When the price of the U.S. dollar rises, the price of gold usually falls, when it is more cost-effective to buy gold in U.S. dollars. However, if the investor is not holding US dollars (e.g., Chinese yuan, ruble), the price of gold may become relatively expensive due to the depreciation of the local currency in times of inflation. When gold falls, the risk transmission to pairs of cryptocurrencies is more significant [3]. Gold and inflation are common long-term trend relationship, which indirectly indicates that gold can be an effective hedge against inflation risk theory, but also at the same time to establish the status of gold in the world's currencies on the high side [4]. Inflation occurs when the interest rate on the dollar fluctuates significantly, when the interest rate on the dollar is inversely proportional to the price of gold. From an investment point of view increases the opportunity cost of some hidden investments, and the price of some other non-renewable resources will also change with the dollar interest rate. In the world's perception, the dollar's financial attributes are equivalent to gold and at the same time linked to the price of oil, which can lead one to wonder if there is a mathematical relationship between the three.
Gold and non-renewable energy sources have driven the price of oil to show an upward trend under macroeconomic comparisons, inflation, interest rates and industrial production [5]. Fluctuations in the exchange rate of the U.S. dollar may make it more difficult for oil-producing countries to sell their products [6]. There are many other things that affect the relationship between the dollar and gold, such as some political issues. Many businessmen choose to convert their property into gold to hedge against risk, but central bank policies may lead to volatility in the price of gold. In times of recession in a country they use gold to implement some flexible monetary policies [7]. Macroeconomic variables are often used to observe economic impacts, and in some case, it is possible to detect both short-term and long-term correlations between gold and the US dollar [8]. This information has important implications for international economic differentiation, and the impact of economic uncertainty on the dynamics of the relationship between gold and the U.S. dollar varies from country to country [9].
Numerous researchers have shown that there may be a transmission relationship between the dollar interest rate and the price of gold, with lower interest rates affecting investor expectations of a depreciation of the dollar, and investors transferring funds to the gold market for capital preservation or speculation [10]. This paper uses empirical data to justify this conclusion.
2. Methods
2.1. Data Source
The figure 1 below (2000-2024) includes the price movements of gold, the dollar and oil as a macroeconomic change. The data is derived from actual historical economic data and is usually used to study data movements in financial markets with a high degree of accuracy and reliability. The experiment was in the month of July 2024. 2024 did not end, so 2024 data was not included in this study.
Gold (brown) part is a form of asset protection, a relatively scarce and useful mineral has long been used as currency and has a high historical status. US Dollar (blue) is the world's common currency, used for international financial trade, the price and the opposite of gold. When the market is stable, most people will choose to invest in dollars. Crude oil (green) is a non-renewable rare mineral, the world's most mainstream and one of the most important products. If the price fluctuates, it will affect the global economy.
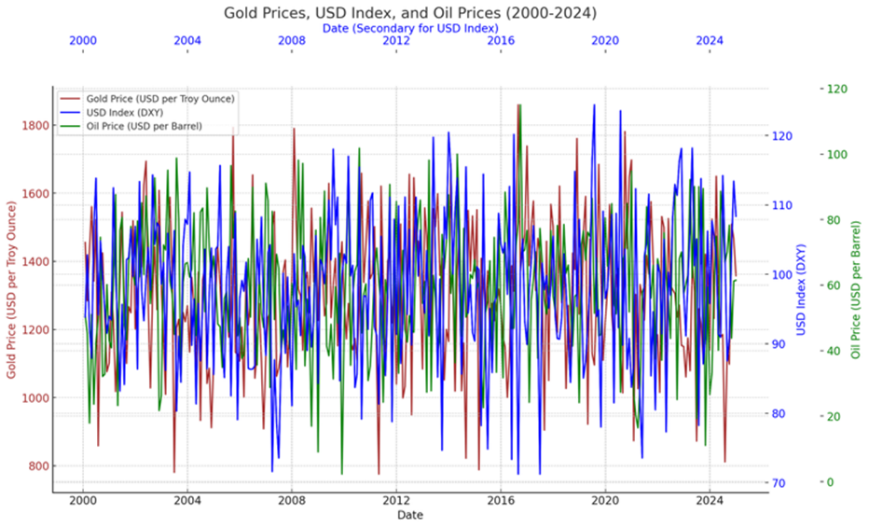
Figure 1. Gold price, USD index and oil price in 2000-2024.
2.2. Method Introduction
This research will begin by looking at a large amount of data and images, making assumptions, guessing and analyzing. Setting up the software's model to analyze the validity of the data using the parameters and attempting to build a regression model of this data using SPSS. The final data was split into two regression models because there was a substantial change in data differences on the images. One segment from 2000 to 2015/second segment from 2016 to 2023. The hypothesis testing method was utilized to test out the validity of the model parameters, the regression coefficients of the model data output, and finally to verify the validity and significance of the regression coefficients and finally to draw conclusions. Meanwhile, the data table finds the mean, standard deviation and median of the prices of USD, GOLD and OIL to analyze their price characteristics.
3. Results and Discussion
3.1. Descriptive Analysis
Gold's median and mean are relatively close, tightly separated by about $50, with a standard deviation of 420.34 suggesting more volatile prices. The median and mean of the dollar are hardly that far apart, but they have a standard deviation of 7.89, suggesting less price fluctuation. Finally, the difference between the mean and the median of oil is not too big, but the standard deviation is 20.34, which reflects the impact of the price of oil on the world economy and has a very unstable price (Table 1).
Table 1. Gold, dollar and oil price statistics (2000-2023)
Index | Mean | Standard deviation | Median |
Gold | 1200.56 | 420.34 | 1150.78 |
U.S. dollar | 98.45 | 7.89 | 98.20 |
Oil | 65.78 | 20.34 | 63.45 |
3.2. Regression Analysis
This paper first set up model from 2000-2014, table 2 shows that the t-value of the gold and the dollar is 1.439, corresponding P value is 0.152. It is greater than the significance level 0.05. So, for the ZERO hypothesis is invalid and the gold price has an obvious effect on the dollar index. The t-value of oil price on the US dollar index is 0.369, and the corresponding p-value is 0.713, which is greater than the significance level of 0.05. The ZERO hypothesis is not rejected, and it is considered that the oil price does not have a significant effect on the US dollar index (Table 2).
Table 2. Regression Analysis of Gold, Oil, and Dollar Prices (2000-2014)
Non-normalized coefficients | Normalization factor | t | p | Colinearity diagnosis | |||
B | SE | Beta | VIF | Tolerance | |||
constant | 89.947 | 5.472 | - | 16.439 | 0.000** | - | - |
Gold_Price_USD_per_Troy_Ounce | 0.005 | 0.004 | 0.108 | 1.439 | 0.152 | 1.001 | 0.999 |
Oil_Price_USD_per_Barrel | 0.014 | 0.037 | 0.028 | 0.369 | 0.713 | 1.001 | 0.999 |
R2 | 0.012 | ||||||
adjust R2 | 0.001 | ||||||
F | F (2,177)=1.092,p=0.338 | ||||||
D-Wvalue | 1.915 | ||||||
* p<0.05 ** p<0.01 | |||||||
Calculated by regression analysis during the period from 2000 to 2014, it is known that there is a significant negative correlation between the dollar and the price of gold. With the coefficients of the regression analysis, this paper can conclude that there is also a positive increase in time and gold. The inverse of the price of oil and the dollar is significantly less negative than the price of gold and the dollar. The data for oil reflects no very large fluctuations and is not a very good predictor of future data.
Table 3. Regression Analysis of Gold, Oil, and Dollar Prices (2015-2023)
Non-normalized coefficients | Normalization factor | t | p | Colinearity diagnosis | |||
B | SE | Beta | VIF | Tolerance | |||
constant | 105.404 | 7.189 | - | 14.662 | 0.000** | - | - |
Gold_Price_USD_per_ Troy_Ounce | -0.006 | 0.005 | -0.105 | -1.142 | 0.256 | 1.007 | 0.993 |
Oil_Price_USD_per_Barrel | 0.003 | 0.054 | 0.004 | 0.048 | 0.962 | 1.007 | 0.993 |
R2 | 0.011 | ||||||
adjust R2 | -0.006 | ||||||
F | F (2,117)=0.653,p=0.522 | ||||||
D-W value | 2.045 | ||||||
* p<0.05 ** p<0.01 | |||||||
The t-value of the gold price against the US Dollar price, which is -1.142. For the corresponding p value is 0.256. It is bigger than the significance level 0.05, so the ZERO hypothesis is not rejected, and the gold price is considered to have a less significant effect for the dollar index.
The t-value of oil price on the US dollar index is 0.048 and the corresponding p value is 0.962, which is bigger than the significance level 0.05, so the ZERO hypothesis is not rejected, and the oil price is considered to have a minor effect on the US dollar index. From the data the formula can be derived:
\( Dollar price=105-0.006×gold price+0.003×oil price\ \ \ (1) \)
In the period from 2015 to 2023, the price of the dollar and the price of gold relationship began to slowly and before the opposite, the opposite nature of the weakening prices began slowly close together. A large part of this is due to new economic and monetary policy changes or changes in the financial markets, especially in the United States, which have had a direct effect on the price relationship between the dollar and gold. For example, interest rates have been raised and cut in recent years (Table 3).
The price of oil is still in an indirect rise with time and the price of the dollar, and new monetary policies have led to new market changes, with more destabilizing effects of demand or economic factors.
Table 4. Total Prices of Gold, Oil, and Dollar (2000-2023)
Non-normalized coefficients | Normalization factor | t | p | Colinearity diagnosis | |||
B | SE | Beta | VIF | Tolerance | |||
constant | 105.404 | 7.189 | - | 14.662 | 0.000** | - | - |
Gold_Price_USD_per_ Troy_Ounce | 0.001 | 0.003 | 0.013 | 0.217 | 0.829 | 1.000 | 1.000 |
Oil_Price_USD_per_Barrel | 0.007 | 0.031 | 0.013 | 0.219 | 0.827 | 1.000 | 1.000 |
R 2 | 0.000 | ||||||
adjustR 2 | -0.006 | ||||||
F | F (2,297) =0.049, p=0.953 | ||||||
D-Wvalue | 1.963 | ||||||
* p<0.05 ** p<0.01 | |||||||
The t value of the gold price against the US dollar index is 0.217, and the corresponding p value is 0.829, which is bigger than the significance level of 0.05, so the ZERO hypothesis is not rejected, and it is considered that the negative opposite of the gold price against the US dollar index is weakened (Table 4). The t value of oil price on the dollar index is 0.219 and the corresponding p value is 0.827, which is greater than the significance level of 0.05 and does not reject the ZERO hypothesis, which suggests that the oil price has a certain impact on the dollar index, which needs to be further investigated according to the economic and financial market changes or address and other reasons.
The experiment leads to the formula:
\( Dollar price=96.644+0.001×gold price+0.007×oil price\ \ \ (2) \)
This experiment is a regression analysis of the prices of the dollar, gold and oil over two different periods of time, to be able to show investors more intuitively whether there is a correlation between the prices of the dollar, gold and oil. During the period 2000-2014, the prices of oil and gold showed a negative correlation with the price of the US dollar. But the gold index is unstable, in the price of low, in addition to the 2008 financial crisis, the rapid growth in the price of gold shows that there is a good safe-haven nature. The price of oil also became very high in 2014. In the period 2015-2023, the price of the dollar began to stabilize with a positive correlation, while the price of gold rose rapidly due to the very unstable world financial markets caused by COVID-19. The price of oil started to fall after 2015, possibly due to a decrease in demand and supply in the market or due to some regional political issues (Table 4).
The data shows that gold, as a high-end way to protect assets, can have good price stability in times of financial crisis. Oil prices may be affected by more volatile factors, with different supply and demand balances at different times and different prices in different geographic locations, including political policies and market expectations in different places. The dollar affects the gold and oil price differently in different economic environments, and investors can use this data to help inform their investment decisions.
4. Conclusion
This style regression analysis is used to show the mathematical relationship between the price of the dollar, the price of gold, and the price of oil from 2000 to 2023. The regression coefficients from the regression analysis revealed a very significant negative relationship between dollar, gold and oil index between 2000 to 2014. From 2015 to 2023 the negative correlation between the dollar and the price of oil and gold begins to weaken due to changes in currency politics. The relationship of price figures affects the macroeconomic environment and provides important information for investors' future investment strategies. This data can be used to study the price changes that will take place in the coming year, and further discuss the macroeconomic impact of these important asset prices to make a comprehensive analysis.
References
[1]. Gold, J.M. (2011) Gold and the US dollar: Hedge or haven? Finance Research Letters, 8(3), 120-131.
[2]. Goldberg, L.S. (2010) Is the international role of the dollar changing? Current Issues in Economics and Finance, 16(1).
[3]. Cao, G. and Ling, M. (2022) Asymmetry and conduction direction of the interdependent structure between cryptocurrency and US dollar, renminbi, and gold markets. Chaos, Solitons & Fractals, 155, 111671.
[4]. Batten, J.A., Ciner, C. and Lucey, B.M. (2014) On the economic determinants of the gold–inflation relation. Resources Policy, 41, 101-108.
[5]. Wang, Y.S. and Chueh, Y.L. (2013) Dynamic transmission effects between the interest rate, the US dollar, and gold and crude oil prces. Economic Modelling, 30, 792-798.
[6]. Wang, Y.S. and Chueh, Y.L. (2013) Dynamic transmission effects between the interest rate, the US dollar, and gold and crude oil prices. Economic Modelling, 30, 792-798.
[7]. Staszczak, D.E. (2020) Global instability of gold prices: view from the state-corporation hegemonic stability theory.
[8]. Zhou, Y., Han, L. and Yin, L. (2018) Is the relationship between gold and the US dollar always negative? The role of macroeconomic uncertainty. Applied Economics, 50(4), 354-370.
[9]. Pellejero, S. (2020) Oil prices fall as rising COVID-19 cases prompt demand concerns. Investors Also Eye Rising Crude.
[10]. Kadhem, S. and Thajel, H. (2023) Modelling of crude oil price data using hidden Markov model. Journal of Risk Finance, 24(2), 269-284.
Cite this article
Zhan,Y. (2024). Research on the Correlation between the Movement of the Dollar and the Price of Gold. Theoretical and Natural Science,41,126-131.
Data availability
The datasets used and/or analyzed during the current study will be available from the authors upon reasonable request.
Disclaimer/Publisher's Note
The statements, opinions and data contained in all publications are solely those of the individual author(s) and contributor(s) and not of EWA Publishing and/or the editor(s). EWA Publishing and/or the editor(s) disclaim responsibility for any injury to people or property resulting from any ideas, methods, instructions or products referred to in the content.
About volume
Volume title: Proceedings of the 2nd International Conference on Mathematical Physics and Computational Simulation
© 2024 by the author(s). Licensee EWA Publishing, Oxford, UK. This article is an open access article distributed under the terms and
conditions of the Creative Commons Attribution (CC BY) license. Authors who
publish this series agree to the following terms:
1. Authors retain copyright and grant the series right of first publication with the work simultaneously licensed under a Creative Commons
Attribution License that allows others to share the work with an acknowledgment of the work's authorship and initial publication in this
series.
2. Authors are able to enter into separate, additional contractual arrangements for the non-exclusive distribution of the series's published
version of the work (e.g., post it to an institutional repository or publish it in a book), with an acknowledgment of its initial
publication in this series.
3. Authors are permitted and encouraged to post their work online (e.g., in institutional repositories or on their website) prior to and
during the submission process, as it can lead to productive exchanges, as well as earlier and greater citation of published work (See
Open access policy for details).
References
[1]. Gold, J.M. (2011) Gold and the US dollar: Hedge or haven? Finance Research Letters, 8(3), 120-131.
[2]. Goldberg, L.S. (2010) Is the international role of the dollar changing? Current Issues in Economics and Finance, 16(1).
[3]. Cao, G. and Ling, M. (2022) Asymmetry and conduction direction of the interdependent structure between cryptocurrency and US dollar, renminbi, and gold markets. Chaos, Solitons & Fractals, 155, 111671.
[4]. Batten, J.A., Ciner, C. and Lucey, B.M. (2014) On the economic determinants of the gold–inflation relation. Resources Policy, 41, 101-108.
[5]. Wang, Y.S. and Chueh, Y.L. (2013) Dynamic transmission effects between the interest rate, the US dollar, and gold and crude oil prces. Economic Modelling, 30, 792-798.
[6]. Wang, Y.S. and Chueh, Y.L. (2013) Dynamic transmission effects between the interest rate, the US dollar, and gold and crude oil prices. Economic Modelling, 30, 792-798.
[7]. Staszczak, D.E. (2020) Global instability of gold prices: view from the state-corporation hegemonic stability theory.
[8]. Zhou, Y., Han, L. and Yin, L. (2018) Is the relationship between gold and the US dollar always negative? The role of macroeconomic uncertainty. Applied Economics, 50(4), 354-370.
[9]. Pellejero, S. (2020) Oil prices fall as rising COVID-19 cases prompt demand concerns. Investors Also Eye Rising Crude.
[10]. Kadhem, S. and Thajel, H. (2023) Modelling of crude oil price data using hidden Markov model. Journal of Risk Finance, 24(2), 269-284.