


1. Introduction
With the development of the Internet and the increasing demand for arts and entertainment, music platforms have become an indispensable part of people's daily lives. Among all music platforms, Spotify is one of the largest music streaming service providers. It was founded in 2006 and has over 590 million monthly active users. Spotify's huge overseas user base and rich music library make its data have high analytical significance and representative. In the process of using the platform, the data of users' behavior such as playing songs, making comments, and purchasing albums can directly reflect the development trend of various types of music. The integration and research of user behavior data mainly includes analyzing the characteristics of songs such as genre, instrument, tone, etc., the change of song popularity over time, and the influence of artists on the popularity of songs [1-2].
The in-depth analysis of Spotify user behavior data holds immense potential in predicting the future popular trends in music. This predictive capability not only assists music producers in precisely aligning their creations with the unique preferences of their target audience but also ensures that their offerings meet the highly personalized needs of listeners. The resulting insights gained from analyzing these data enable music platforms to further enhance their precision in song recommendations, tailored precisely to individual users' interests and preferences. To enhance the accuracy and efficiency of music trend prediction, researchers have proposed improved LSTM (Long Short-Term Memory) prediction algorithms [3-5]. These algorithms demonstrate a higher degree of accuracy and reduced mean error over a longer period, making them valuable tools for predicting music trends. One such example is the time series-based music prediction algorithm employed by Yu Weisheng et al. [6]. Their approach utilizes the category optima value selection method to forecast music popularity and trends, providing valuable insights into the dynamics of musical preferences. Moreover, the integration of the long short-time memory network of the cyclic neural network and the attention mechanism has been explored to predict music popularity trends [7]. This approach utilizes daily view counts and average view counts of songs as samples, allowing for a more fine-grained analysis of music popularity. Finally, a prediction model based on neural network and data mining technology has been developed [8-10]. In the above-mentioned study, the dataset lacks sufficient diversity and comprehensiveness, which may lead to biases in predicting music popularity. The description focuses on specific prediction algorithms and datasets, lacking a comprehensive analysis of other factors that could influence music popularity. Additionally, there is no detailed discussion on how these models are applied in the actual music industry. This model aims to steer the trends of popular music based on user preferences, enabling music platforms to offer a more tailored and personalized music experience. By leveraging these advanced analytical techniques, the music industry can better anticipate future trends and cater to the ever-evolving tastes of music lovers.
Based on a reliable dataset, this paper will determine the correlations between different pairs of music features and top significant factors that influence music trends. The paper will also make suggestions for music producers and platforms according to the research results.
2. Dataset
The dataset in the paper comes from Kaggle. It provides many reliable datasets in economy, business, AI, and medical care fields. The datasets on the website are processed and optimized. Under the premise of ensuring the accuracy of the data, the abnormal data is transformed or deleted.
The dataset used to analyze music popularity trend in the paper mainly includes factors and characteristics as follow. Track name, artist(s) name, artist count, and released date are basic information of songs. The dataset provides the number of playlists, presence and ranks, and streams of songs across multiple music player platform, including Spotify, Apple, Deezer, and Shazam. Moreover, the dataset also lists some indicators relate to a song’s characteristics in music aspect. Bpm (beats per minute) shows the tempo of the song. Key and mode are basic information about a song’s tonality. Danceability, valence and energy reveal and quantify people objective feelings when listening to certain songs. Acousticness and instrumentalness evaluate the composition of a song, and measure the amount of acoustic sounds and instrumental sounds in the song. Liveness shows the presence of live performance elements. Speechiness refers to the amount of spoken words in a song.
The dataset contains the data of 953 hit songs on Spotify as shown in Table 1. Among them, 4% of songs are created by Taylor Swift, making her the artist with the most hit songs in the year. The mean value of artist count for 953 songs is 1.56, showing that most songs are produced by only one artist individually, and some are cooperated by 2 artists. The mean beats per minute of these hit songs is 122.54. It reveals that users prone to prefer songs with medium tempo. This feature allows the music to develop in various styles. The mean value of danceability is 66.97, indicating that songs with characteristics that fit in enthusiastic dance scene are more likely to gain popularity. The standard deviation of speechiness is 9.91. This value is very high compares to its mean value 10.13. This shows that speechiness is not a very important factor that determine the popularity of a song. Rap songs with a large number of spoken words and songs with a small number of spoken words that highlight the emotions or soundtracks are both have potential to catch people’s eyes.
In Figure 1, the correlation heatmap provides a comprehensive overview of the various factors that contribute to a song's popularity and its representation across different music platforms. Notably, the presence of a song on the Spotify and Apple charts exhibits a high positive correlation with the number of streams it receives. This suggests that songs that manage to make their way onto these prestigious charts tend to enjoy a significant boost in their streaming numbers. A hit song is highly likely to find its way onto the charts or playlists of multiple music platforms. This indicates that widespread popularity and appeal across various platforms are intertwined and mutually reinforcing. When a song gains momentum and popularity on one platform, it often translates into similar success on other platforms as well. An interesting finding from the heatmap is the relatively high negative correlation between the energy and acousticness of music. This suggests that songs with lower acousticness and a more prominent electronic sound tend to be perceived as more energetic. Such songs often feature a faster tempo, heavier beats, and synthesized instrumentation, which contribute to their perceived energy. However, it's worth noting that not all combinations in the figure exhibit high correlations. This indicates that while certain factors may influence a song's popularity and representation, there are numerous other variables at play. The complexity of music popularity and its representation across platforms cannot be fully explained by a single factor or a simple combination of factors. The paper explores the correlation between music features (energy, danceability, valence, BPM) and user behavior. However, users may be more concerned with features such as music genre, lyrics, melody, and the artist in real life as we thought.
Table 1. Statistics of Music Features
mean | std | min | 25% | 50% | 75% | max | |
artist_count | 1.56 | 0.89 | 1 | 1 | 1 | 2 | 8 |
released_year | 2018 | 11 | 1930 | 2020 | 2022 | 2022 | 2023 |
released_month | 6.03 | 3.57 | 1 | 3 | 6 | 9 | 12 |
released_day | 13.93 | 9.20 | 1 | 6 | 13 | 22 | 31 |
in_spotify_playlists | 5200 | 7897 | 31 | 875 | 2224 | 5542 | 52898 |
in_spotify_charts | 12.01 | 19.58 | 0 | 0 | 3 | 16 | 147 |
in_apple_playlists | 67.81 | 86.44 | 0 | 13 | 34 | 88 | 672 |
in_apple_charts | 51.91 | 50.63 | 0 | 7 | 38 | 87 | 275 |
in_deezer_charts | 2.67 | 6.04 | 0 | 0 | 0 | 2 | 58 |
bpm | 122 | 28 | 65 | 100 | 121 | 140 | 206 |
danceability_% | 66.97 | 14.63 | 23 | 57 | 69 | 78 | 96 |
valence_% | 51.43 | 23.48 | 4 | 32 | 51 | 70 | 97 |
energy_% | 64.28 | 16.55 | 9 | 53 | 66 | 77 | 97 |
acousticness_% | 27.06 | 26.00 | 0 | 6 | 18 | 43 | 97 |
instrumentalness_% | 1.58 | 8.41 | 0 | 0 | 0 | 0 | 91 |
liveness_% | 18.21 | 13.71 | 3 | 10 | 12 | 24 | 97 |
speechiness_% | 10.13 | 9.91 | 2 | 4 | 6 | 11 | 64 |
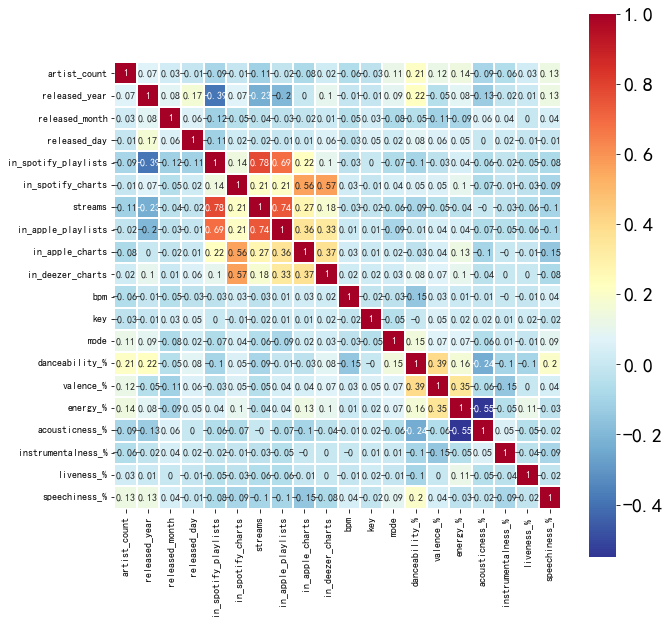
Figure 1. Correlation of Music Features
3. Models
3.1. Decision Tree
Decision Tree is a tree-like hierarchical model to test specific attribute and represent the outcome of the test through the paths from root to leaf as shown in Figure 2. The bottom leaves represent the final classification. Decision Tree has its own advantages comparing to other machine learning methods. Decision Tree has fast training speed. It can test features that are non-numerical, and realize nonlinear classification. Moreover, in Decision Trees, continuous and categorical variables can co-exist. Standardizing data is not necessary in Decision Tree algorithm.
In each step of a Decision Tree, the algorithm needs to choose the features with maximum information gain after splitting to test. Information is represented by entropy. The entropy at each step is defined by the equation:
\( i(p)=-\sum _{j}P({ω_{j}}){log_{2}}{P({ω_{j}})}\ \ \ (1) \)
\( P({ω_{j}}) \) represents the probability of the sample being category j.
The difference in entropy before and after splitting is represented by the equation:
\( ∆i(p)=i(p)-\sum _{c}{P_{c}}i({p_{c}})\ \ \ (2) \)
\( {p_{c}} \) represents the child node of node p, and \( {P_{c}} \) is the probability of the sample splitting to \( {p_{c}} \) . By calculating \( ∆i(p) \) and finding the maximum value, we can split the feature with the greatest information gain.
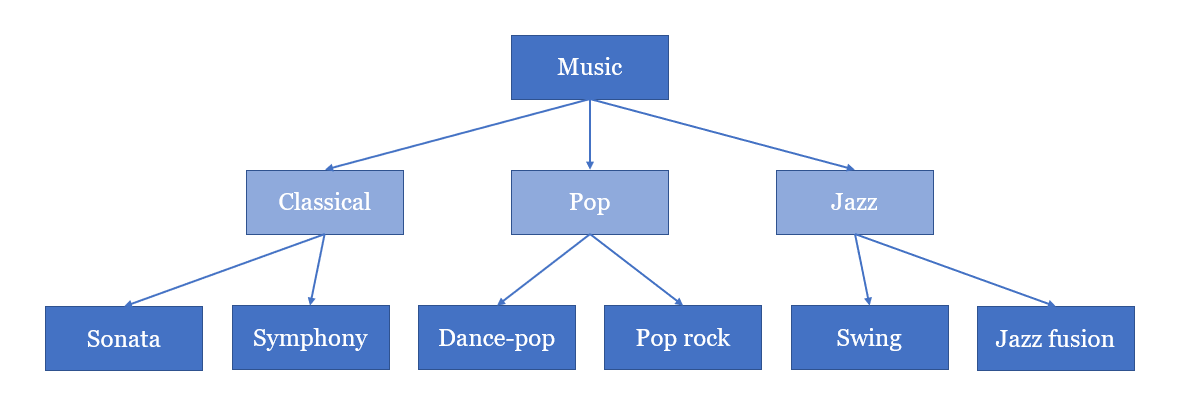
Figure 2. Decision Tree
3.2. Random Forest
A single Decision Tree indeed has its limitations in prediction ability. To address this challenge, we can harness the power of multiple Decision Trees by combining them into a robust classifier known as Random Forest. The process of amalgamating these individual trees into a unified forest is accomplished through the application of the bagging method. The bagging method works by generating multiple subsets, or "bags," of the original training data through random sampling with replacement. Each bag is then used to train an independent Decision Tree. This parallel structure of Decision Trees, combined with the use of randomly selected data subsets, not only enhances the prediction accuracy of the overall model but also significantly reduces the instability and overfitting tendencies of a single Decision Tree. By aggregating the predictions of the individual trees through voting or averaging, Random Forest is able to provide a more robust and reliable prediction compared to a single Decision Tree. This ensemble approach harnesses the collective wisdom of multiple trees, effectively balancing out the weaknesses of any individual tree and leveraging their collective strengths.
In the bagging method, numerous Bootstrap data sets are selected from the original data set, and are trained independently to become weak classifiers as shown in Figure 3. Those Decision Trees are combined through a method similar to voting. Among all Decision Trees, the category that is derived most times is the final result of the Random Forest.
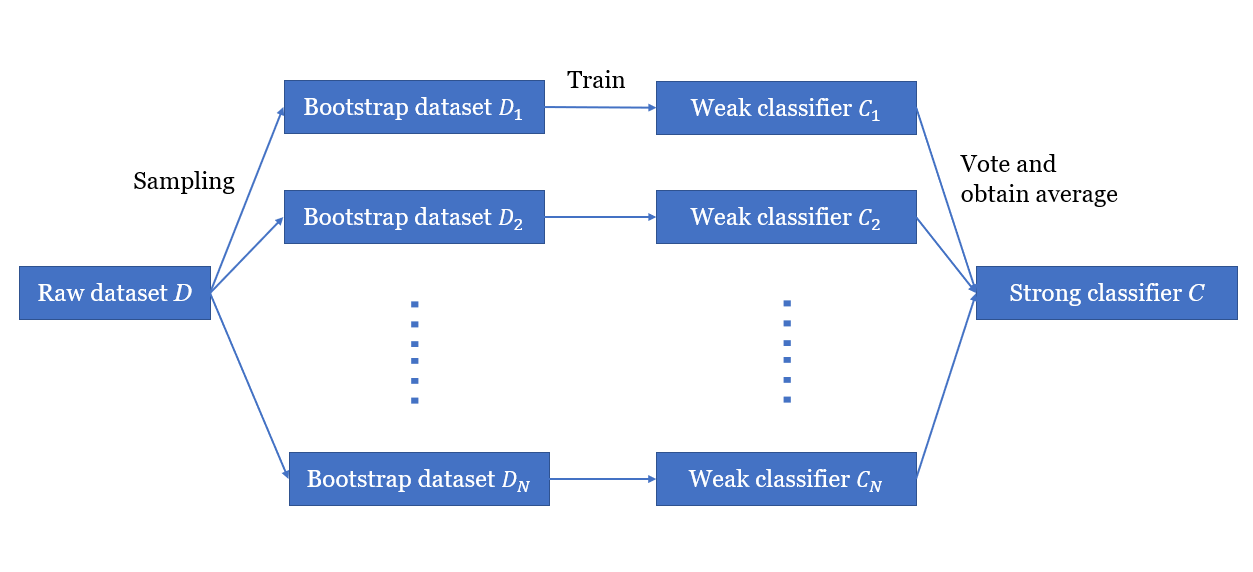
Figure 3. Random Forest
4. Results
Table 2. Error Analysis Data for Decision Tree and Random Forest
Model | Decision Tree | Random Forest |
Mean Absolute Error | 1.8E+08 | 1.26E+08 |
Root Mean Squared Error | 2.96E+08 | 1.86E+08 |
R-squared | 0.659 | 0.865 |
Mean Absolute Percentage Error | 10609 | 20759 |
Explained Variance Score | 0.659689 | 0.86607 |
Max Error | 1.33E+09 | 6.6E+08 |
Median Absolute Error | 82868260 | 72276021 |
Mean Squared Logarithmic Error | 2.46 | 2.36 |
The indicators shown in the chart above evaluate the performances of the Random Forest Regressor. Explained variance score is the explanatory variance score represents the proportion of variance that the model can account for, ranging from 0 to 1. The explained variance score being closer to 1 indicates the model's ability to explain the data is strong. Median absolute error is the median of the difference between the predicted value and the actual value. It is insensitive to outliers. Mean Squared Logarithmic Error (MSLE) is the mean square error between the predicted value and the actual value after the logarithm conversion. It is usually used when the target value has a relatively large range.
These indicators can help evaluate the performance of the Random Forest regressor and understand the prediction accuracy, fitness, and errors of the model. Different indicators provide different aspects of the model performance evaluation. The combination of multiple indicators can make more comprehensive model evaluations. By comparing the values in the chart according to the interpretations of different indicators, it can be concluded that Random Forest are more effective and accurate than Decision Trees under multiple standards.
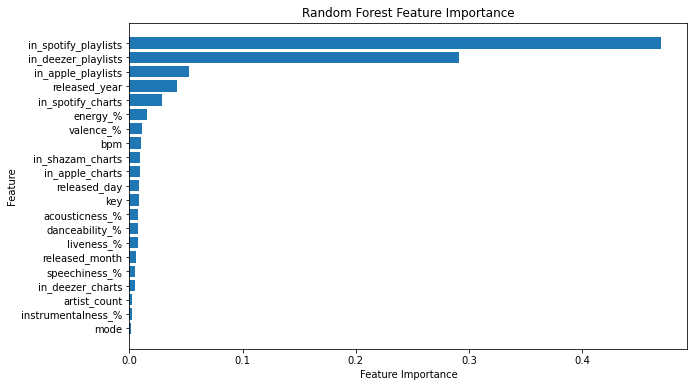
Figure 4. Random Forest Feature Importance
According to Random Forest Feature Importance, Artist count, instrumentalness and mode are irrelevant to music popularity. The trends of music have little dependence on these features. The top three important features for music popular trends are Spotify, Deezer and Apple playlists. The released year, energy, valence and beats per minute also play significant roles. For music creators who want their music to be a persistent hit, it is better for them to maintain a frequent release of new songs and produce music with appropriate bpm value as well as containing strong vitality and energy. These features help attract a large audience and ensure the sustainability of their contribution to the songs’ popularity over time.
Based on these results, the music platforms can understand users’ preferences and realize the precise control of music trends. This helps to optimize the recommendation algorithms of music platforms, thereby enhancing user engagement and activity. Platforms can increase their popularity, influence, and revenue. In this case, users can enjoy personalized services, and it is easier for them to find music that suits their interests. For music creators, the analysis results of music popularity and trends make it easier for them to understand the popular preferences and the commonalities of hit songs, so as to create lasting popular songs that meet the audience's aesthetic.
5. Conclusions
This paper delves into the intricate correlations between music features and their evolving impacts on musical popularity trends over time, utilizing Decision Trees and Random Forest algorithms. The outcomes reveal that a song that achieves popularity is likely to feature prominently in charts or playlists across multiple music platforms. In particular, music pieces with reduced acousticness and a heavier reliance on electronic elements tend to exude a greater sense of energy. When considering the impact of these features on musical trends, it becomes apparent that songs that possess high energy levels and positive valence, regardless of their inclusion in playlists on various platforms, are more prone to attaining widespread popularity. This paper offers a precise means of monitoring and controlling musical popularity trends, highlighting the significance of user preferences in shaping these trends. To enhance the scope and rigor of this research, incorporating additional analytical and predictive models would be beneficial. This would allow for a more comprehensive exploration of the complex relationships between music features and popularity trends. Furthermore, acquiring a broader and more diverse dataset would enable the inclusion of a wider range of musical styles, genres, and time periods, further strengthening the model's predictive accuracy. Moreover, including additional music features in the analysis, such as rhythmic complexity, melodic contours, and harmonic variations, would provide a deeper understanding of how these elements contribute to a song's popularity. Additionally, factors such as the song's release date, the artist's popularity, and social media engagement could also be considered to capture external influences that might affect musical trends.
The contribution of this paper lies in emphasizing that popular songs frequently exhibit lower acoustic elements, rely more on electronic components, and convey higher energy levels. Songs with high energy and positive valence are more prone to widespread popularity. The study highlights the influence of user preferences on shaping musical trends and recommends broadening the analysis by integrating more analytical models, diverse datasets, and additional music features to enhance the understanding of factors influencing popularity. In summary, this paper lays a solid foundation for understanding the dynamics of musical popularity trends, but there is ample room for improvement through the inclusion of additional models, datasets, and music features. This paper shows a more comprehensive and accurate understanding of the factors that shape our musical preferences and trends.
References
[1]. Interiano Myra, et al. Music Trends and Predictability of success in Contemporary Songs in and out of the Top Charts. Royal Society Open Science, 2018.
[2]. Lee Junghyuk, Lee Jong-Seok. Music Popularity: Metrics, Characteristics, and Audio-based Prediction. IEEE Transactions on Multimedia, 2018.
[3]. Li Kun, et al. Research for Music Trend Prediction Based on LSTM-RPA[C]. Computer Engineering and Applications, 2022, 58(24).
[4]. Liu Xiangli. Music Trend Prediction Based on Improved LSTM and Random Forest Algotithm. Journal of Sensors, 2022.
[5]. Cai Honghao, et al. Research on the Influence Factors and Genre Development Trends of Music Based on PageRank and LSTM Model. IEEE Xplore, 2021.
[6]. Yu Weisheng, et al. Music Popular Trends Prediction Based on Time Series. Computer Engineering & Science, 2018.
[7]. Wang Zhen-ye, et al. Music Trend Forecast Based on LSTM-Att Method. Computer Technology and Development, 2020.
[8]. Xu Yichen, et al. Prediction Model of Music Popular Trend Based on NNS and DM Technology. Mathematical Modeling for Next-Generation Big Data Technologies, 2022.
[9]. Xuyan Wang. Prediction Algorithm of Music Trend Based on Neural Network. The International Conference on Cyber Security Intelligence and Analytics, 2022.
[10]. Kim Yekyung, et al. Now Playing the Future Billboard: Mining Music Listening Behaviors of Twitter Users for Hit Song Prediction. Proceedings of the first international workshop on Social Media Retrieval and Analysis, 2014.
Cite this article
Shu,M. (2024). Exploring Spotify's Music Popularity Dynamics and Forecasting with Machine Learning. Theoretical and Natural Science,53,83-89.
Data availability
The datasets used and/or analyzed during the current study will be available from the authors upon reasonable request.
Disclaimer/Publisher's Note
The statements, opinions and data contained in all publications are solely those of the individual author(s) and contributor(s) and not of EWA Publishing and/or the editor(s). EWA Publishing and/or the editor(s) disclaim responsibility for any injury to people or property resulting from any ideas, methods, instructions or products referred to in the content.
About volume
Volume title: Proceedings of the 2nd International Conference on Applied Physics and Mathematical Modeling
© 2024 by the author(s). Licensee EWA Publishing, Oxford, UK. This article is an open access article distributed under the terms and
conditions of the Creative Commons Attribution (CC BY) license. Authors who
publish this series agree to the following terms:
1. Authors retain copyright and grant the series right of first publication with the work simultaneously licensed under a Creative Commons
Attribution License that allows others to share the work with an acknowledgment of the work's authorship and initial publication in this
series.
2. Authors are able to enter into separate, additional contractual arrangements for the non-exclusive distribution of the series's published
version of the work (e.g., post it to an institutional repository or publish it in a book), with an acknowledgment of its initial
publication in this series.
3. Authors are permitted and encouraged to post their work online (e.g., in institutional repositories or on their website) prior to and
during the submission process, as it can lead to productive exchanges, as well as earlier and greater citation of published work (See
Open access policy for details).
References
[1]. Interiano Myra, et al. Music Trends and Predictability of success in Contemporary Songs in and out of the Top Charts. Royal Society Open Science, 2018.
[2]. Lee Junghyuk, Lee Jong-Seok. Music Popularity: Metrics, Characteristics, and Audio-based Prediction. IEEE Transactions on Multimedia, 2018.
[3]. Li Kun, et al. Research for Music Trend Prediction Based on LSTM-RPA[C]. Computer Engineering and Applications, 2022, 58(24).
[4]. Liu Xiangli. Music Trend Prediction Based on Improved LSTM and Random Forest Algotithm. Journal of Sensors, 2022.
[5]. Cai Honghao, et al. Research on the Influence Factors and Genre Development Trends of Music Based on PageRank and LSTM Model. IEEE Xplore, 2021.
[6]. Yu Weisheng, et al. Music Popular Trends Prediction Based on Time Series. Computer Engineering & Science, 2018.
[7]. Wang Zhen-ye, et al. Music Trend Forecast Based on LSTM-Att Method. Computer Technology and Development, 2020.
[8]. Xu Yichen, et al. Prediction Model of Music Popular Trend Based on NNS and DM Technology. Mathematical Modeling for Next-Generation Big Data Technologies, 2022.
[9]. Xuyan Wang. Prediction Algorithm of Music Trend Based on Neural Network. The International Conference on Cyber Security Intelligence and Analytics, 2022.
[10]. Kim Yekyung, et al. Now Playing the Future Billboard: Mining Music Listening Behaviors of Twitter Users for Hit Song Prediction. Proceedings of the first international workshop on Social Media Retrieval and Analysis, 2014.