


1. Introduction
There are many leaning towers in the world, and most of them tilt because they are built on weak soil or shallow foundations. The soil sinks and deforms under the tower’s weight, causing the tilt. Among these towers, the Leaning Tower of Pisa is the most famous. It is in Pisa, Italy, and was built starting in 1173, taking nearly 200 years to finish. Over the last 850 years, a lot of research has been done on this tower, looking at its structure and architecture. For example, Burland et al. studied how the tower interacts with the soft soil underneath it, showing how the combination of the weak soil and the way the foundation was built led to the leaning [1]. More recently, Antonaci et al. used modern computer models to look at how the tower might react to earthquakes [2]. These studies have helped us understand why the tower leans, but most of them focus only on how it stands or on the nearby soil.
Our research looks at how different soil stiffness (Young's Modulus) and the weight of the tower affect its leaning and how it vibrates. We used the ANSYS program to make a 1:1 model of the tower and the ground, and then we studied how changes in the soil and construction process affect the tilt. This research is new because it also looks at how the soil’s stiffness changes the way the tower behaves over time, which has not been studied much before.
The results of this research can help protect other leaning towers around the world. By understanding how the soil and tower interact, engineers can come up with better ways to keep these towers safe. This study will be helpful for preserving old towers in different types of soil.
2. Methodology
2.1. Model
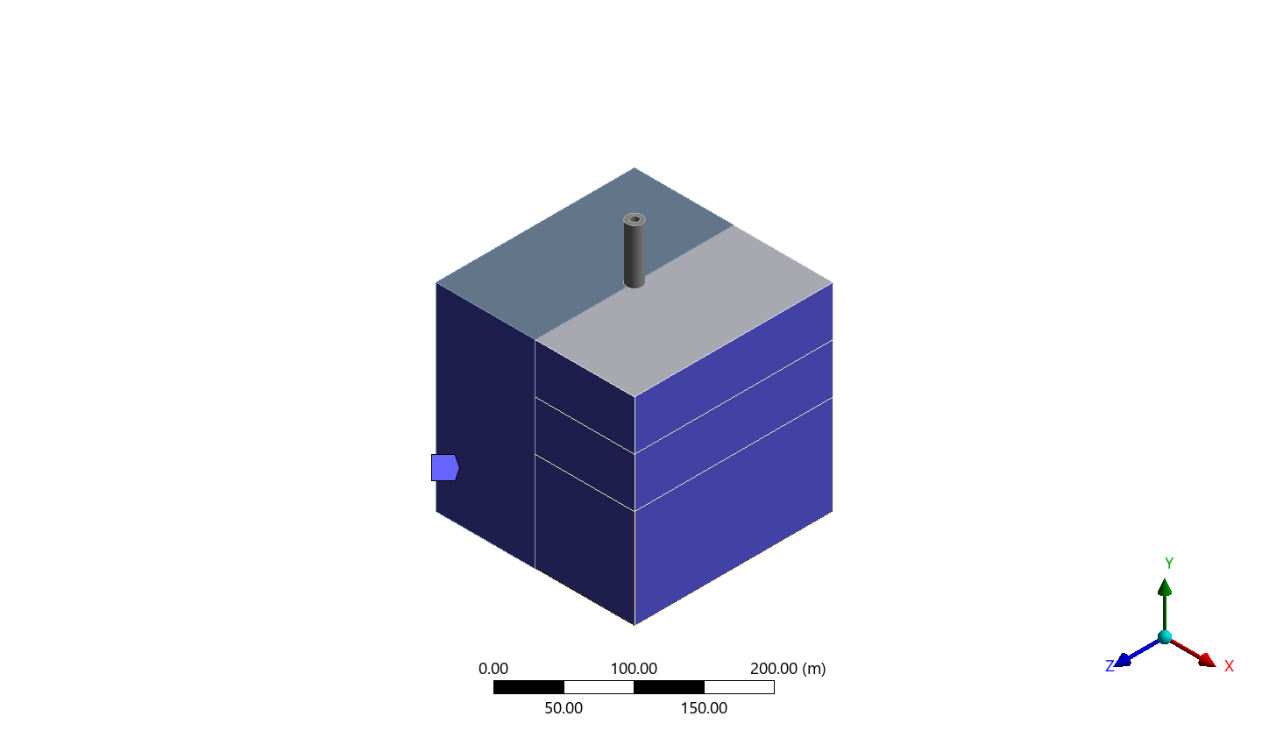
The team conducted a 100m*100m*100m soil block and divided it into four small soil blocks. The left side block and the upper block, lower block on the right side were filled with soft clay, and the middle block on the right side was filled with stiff clay. This step aimed to create a condition that enable the tower to lean.
In the first experiment, the team simulated the building process of the tower. By searching information on the Internet, the team created three models and divided the building process into tree stages: stage one, the height of the tower was 12.7 meters; stage two, the height of the tower was 24.6 meters; stage three, the height of the tower was 55 meters. Also, the team collected some data of the tower’s diameter: the inner diameter was 7.4 meters, and the outer diameter was 15.5 meters. Regarding the capacity of ANSYS, the team only built a rough model of the tower, without details such as columns and stones around the tower [3].
In the second experiment, the team chose the model in stage three and the tower’s height was 55 meters immutably. The model in ANSYS Spaceclaim has been shown in Fig.1[4].
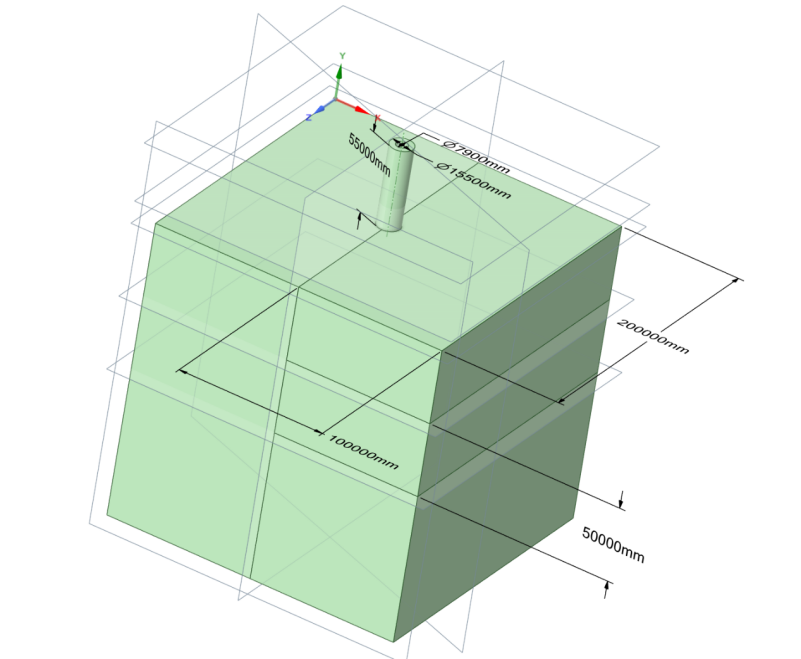
Figure 1. Model schematic diagram.
2.2. Material Selection
In the first experiment, the team used a constant material data. The team didn’t find any literature about the name of the tower’s material. Members searched and got that the tower material is marble[5]. After searching some relative literatures, the team knew that the density of the tower is approximately \( 2750kg/{m^{3}} \) .
For the stiff clay, the density is 1900kg/m3, the Young’ s modulus is 2E+08Pa. Poisson ratio is 0.3. For the soft clay, the density is 1900kg/m3, the Young’ s modulus is 2E+07Pa and the Poisson ratio is 0.3. The material’s data has been shown in Table 1&2[6].
In the second experiment, the team take the Young’s Modulus of the soft clay as the variable and changed it three times. In the first experiment, the team used soft clay with 1E+07Pa. In the second experiment, the team changed it into 1.5E+07Pa. In the third experiment, the team finally changed it into 2E+07Pa.
Table 1. Material Settings in Experiment 1.
\( Material Name \) | \( Density \) | \( Young \prime s Modulus \) | \( Poisson \prime s Ratio \) |
\( Marble \) | \( {2750kg/m^{3}} \) | \( 6×{10^{10}}Pa \) | \( 0.25 \) |
\( Stiff Clay \) | \( 1900kg/{m^{3}} \) | \( 2×{10^{8}}Pa \) | \( 0.3 \) |
\( Soft Clay \) | \( 1900kg/{m^{3}} \) | \( 2×{10^{7}}Pa \) | \( 0.3 \) |
Table 2. Material Settings in Experiment 2.
\( Material Name \) | \( Density \) | \( Youn{g^{ \prime }}s Modulus \) | \( Poisso{n^{ \prime }}s Ratio \) |
\( Marble \) | \( 2750kg/{m^{3}} \) | \( 6×{10^{10}}Pa \) | \( 0.25 \) |
\( Stiff Clay \) | \( 1900kg/{m^{3}} \) | \( 2×{10^{8}}Pa \) | \( 0.3 \) |
\( Soft Clay 1 \) | \( 1900kg/{m^{3}} \) | \( 1×{10^{7}}Pa \) | \( 0.3 \) |
\( Soft Clay 2 \) | \( 1900kg/{m^{3}} \) | \( 1.5×{10^{7}}Pa \) | \( 0.3 \) |
\( Soft Clay 3 \) | \( 1900kg/{m^{3}} \) | \( 2×{10^{7}}Pa \) | \( 0.3 \) |
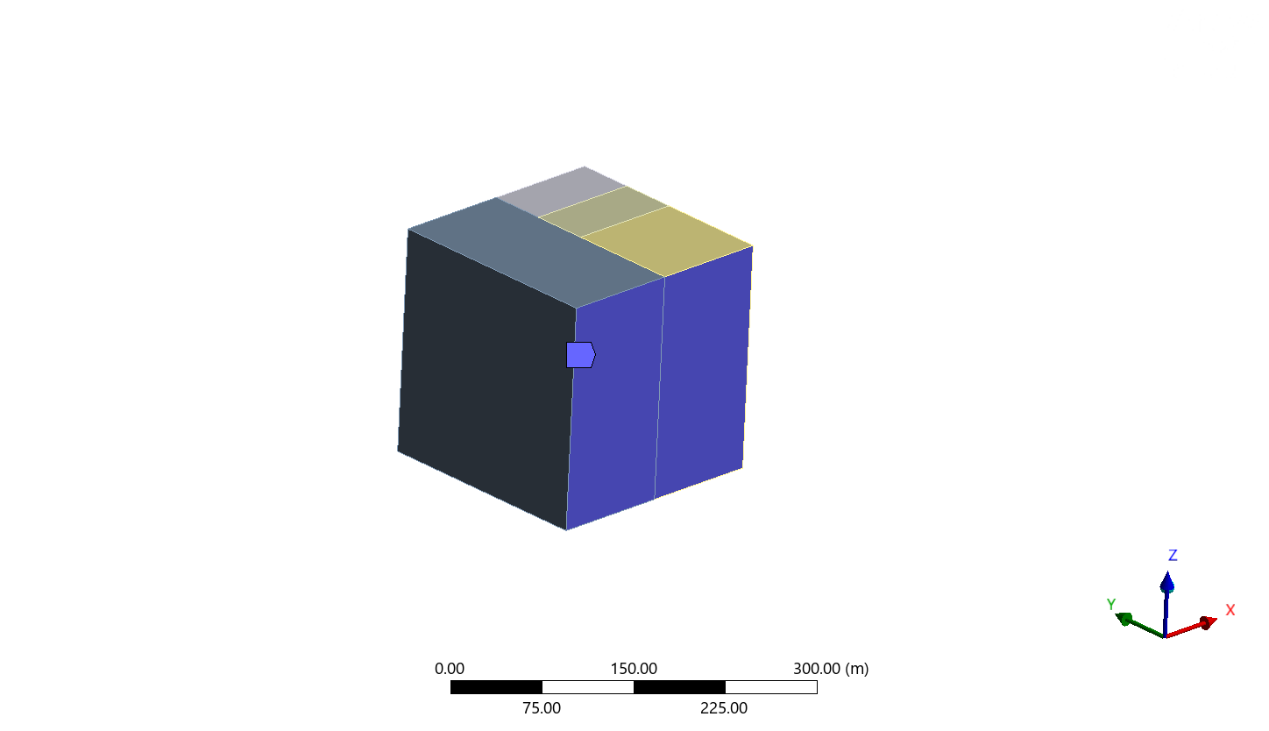
2.3. Boundary Conditions
In the whole experiment, the team set two kinds of boundary conditions. At the bottom of the soil blocks, the team set “fixed support” boundary condition to avoid the destruction of the bottom soil. Around the soil blocks, the team set “only compressive support” to simulate the real situation-the soil may be compressed during the deformation of the tower. The boundary conditions have been shown in Fig.2 and Fig.3 [7].
|
|
Figure 2. Fixed support. | Figure 3. Compression only. |
2.4. Mesh Generating
However, the precision of meshes would affect experiment results. To determine this impact, the research team chose the model which has tower height 55m. The team members chose meshes with three sizes:1m, 10m, 18.982m(default), the mesh images have been shown in Fig.4, 5&6. and the results have been shown in Table 3 [8].
|
|
|
Figure 4. Mesh size:1m. | Figure 5. Mesh size: 10m. | Figure 6. Mesh size: 18.982m (default). |
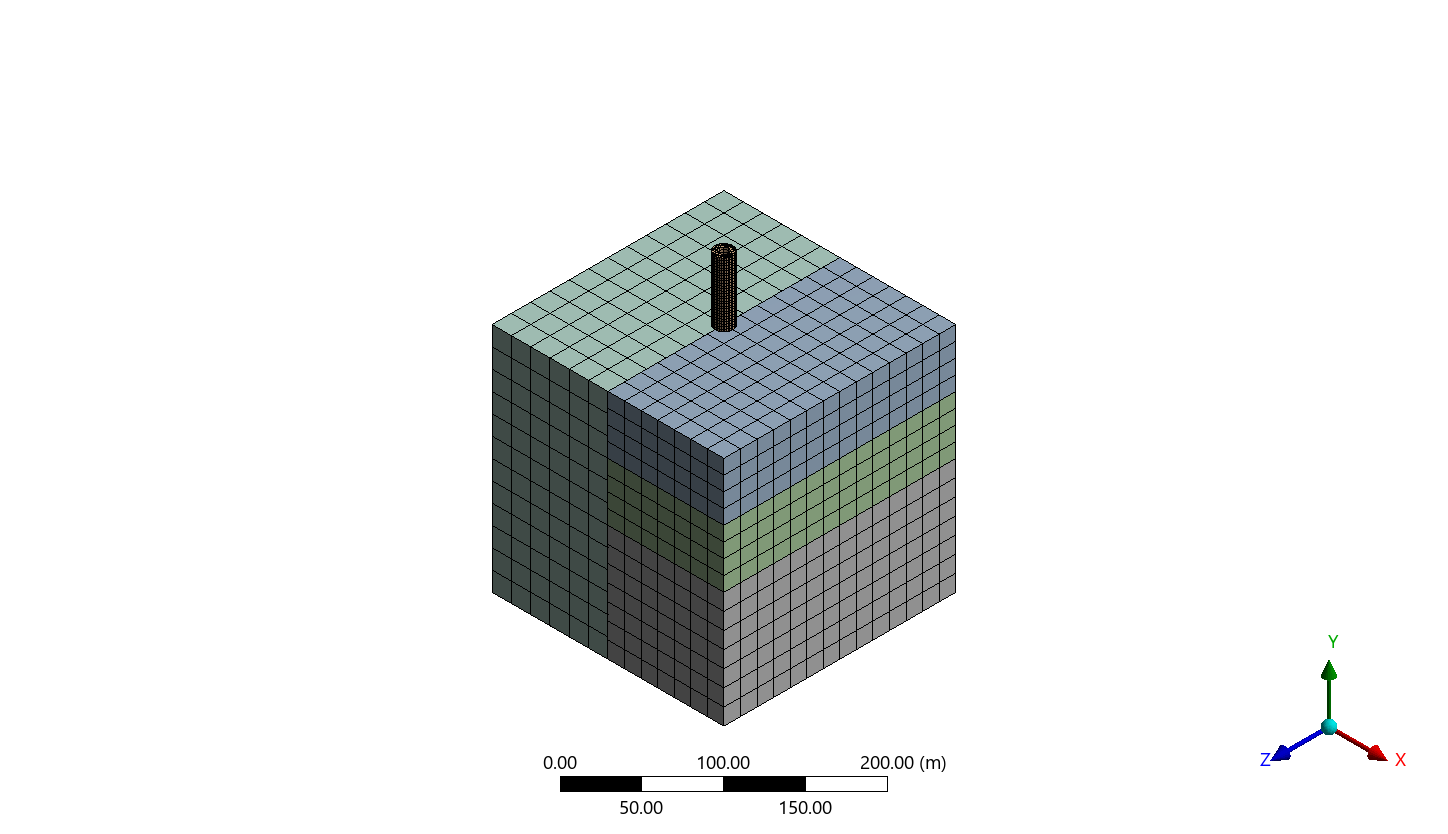
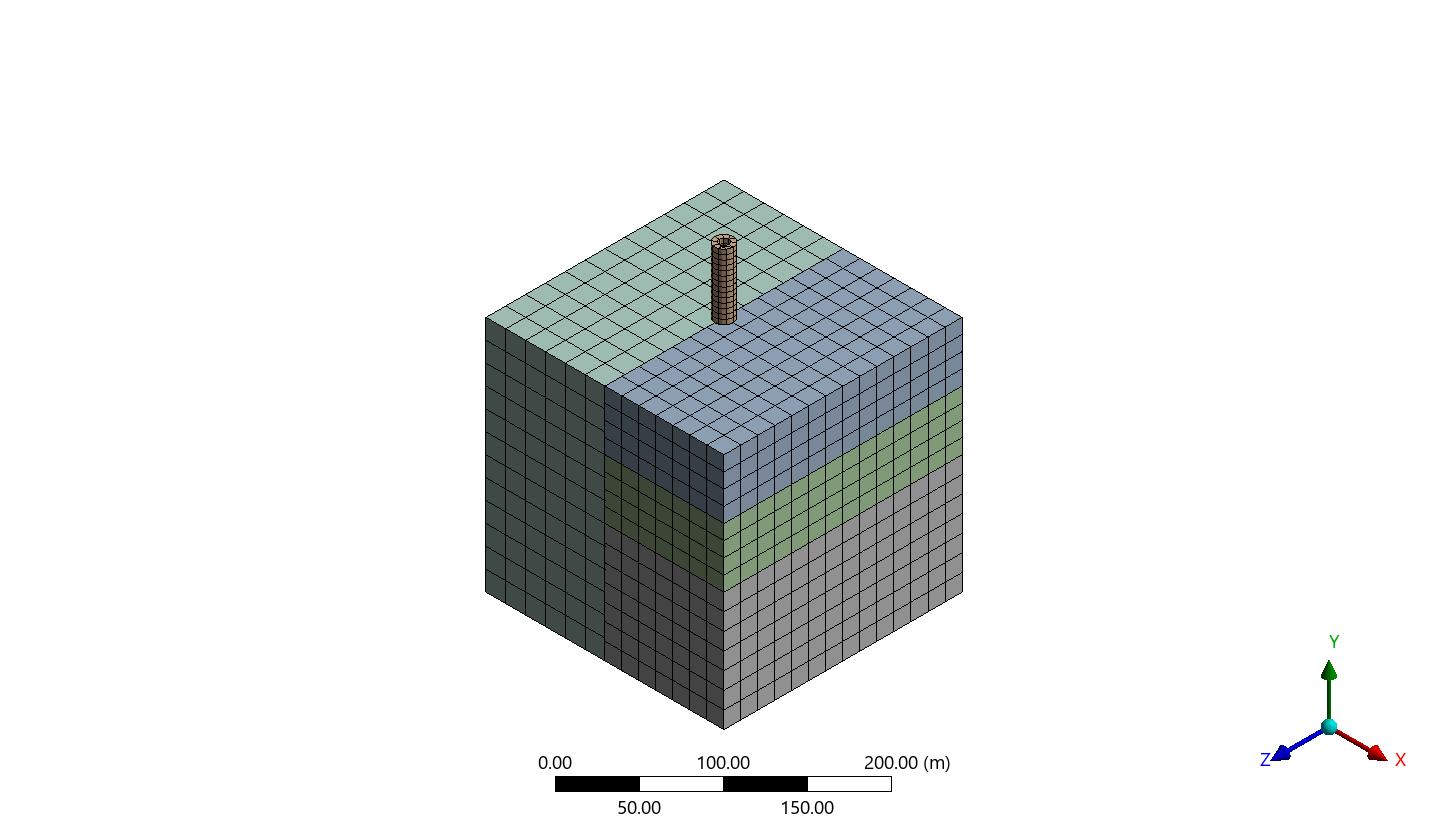
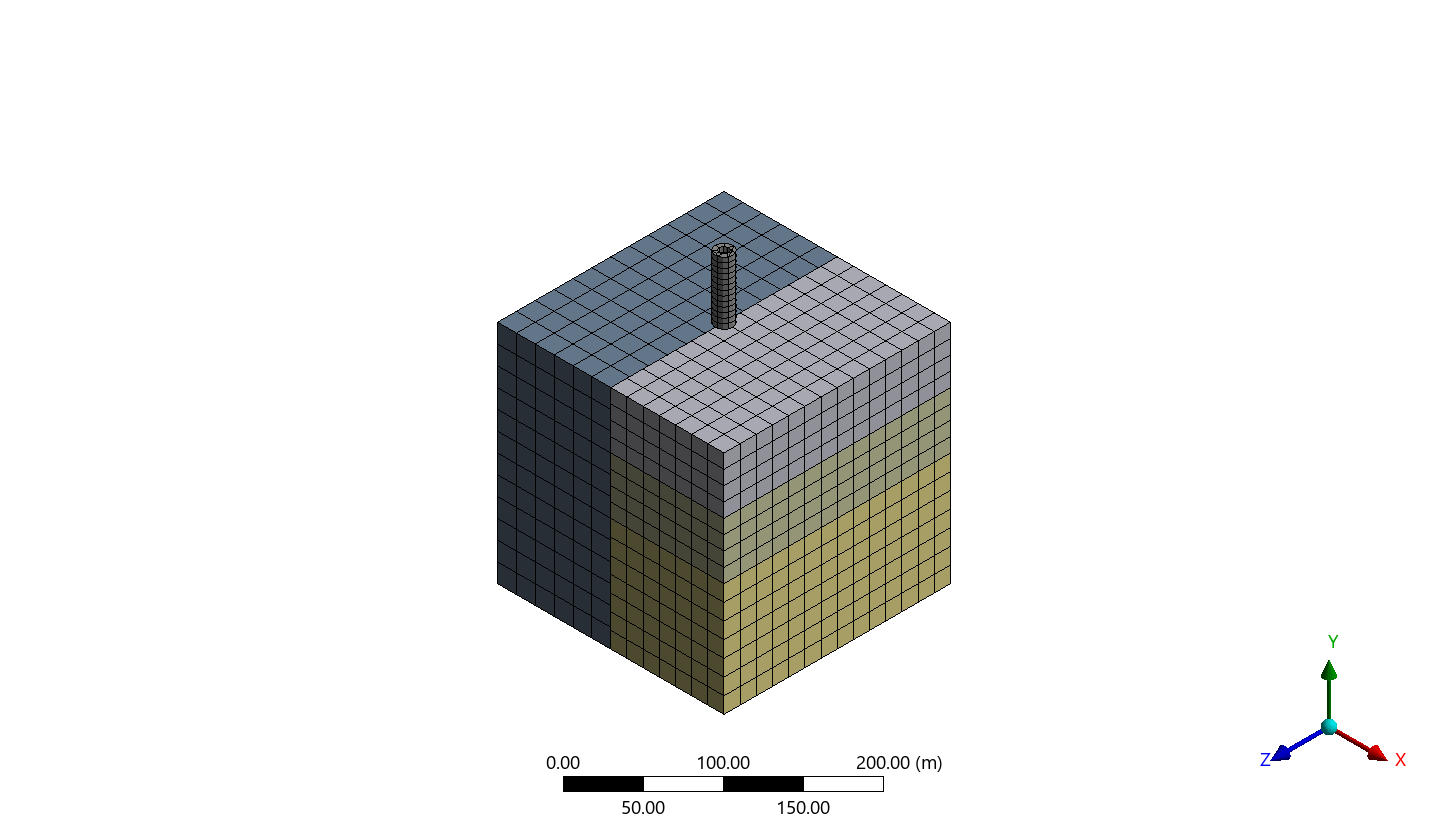
Table 3. Frequencies under different mesh size.
Mesh size | Vibration frequency of the whole model | Deformation of the tower |
1m | 0.15388Hz | 1.3276×10^(-5) m |
10m | 0.15381Hz | 1.3346×10^(-5) m |
18.982m(default) | 0.15388Hz | 1.3275×10^(-5) m |
To see the change of the vibration frequency and the deformation of the tower during the change of the mesh size clearly, the team made two graphs by Excel. The graphs are Fig.7 & Fig.8.
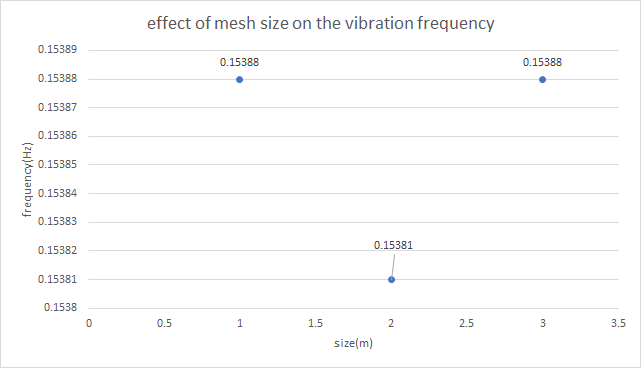
Figure 7. Change in vibration frequency of the whole model during the increase in mesh size.
In this graph, the team realized that during the increase of the mesh size, the vibration frequency decreases initially and increases finally. In addition, the frequencies at 1m and 18.982m are approximately the same.
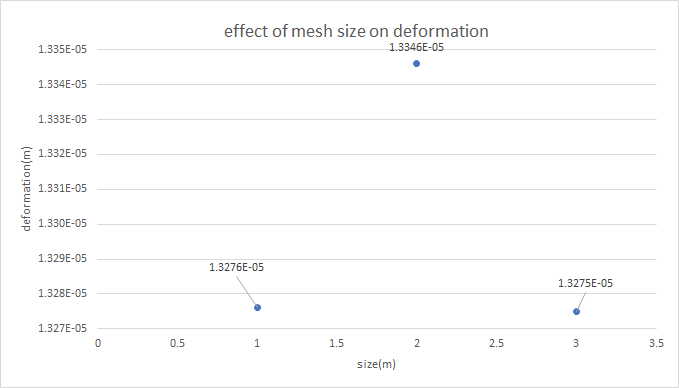
Figure 8. Change in deformation of the tower during the increase in mesh sizing.
In this graph team found that with the increase in the mesh size, the deformation of the tower increases initially and decreases finally. In addition, the deformations at 1m and 18.892m have approximately the same value. Overall, the team decided to use mesh with size 18.982m because the precision is approximately the same with the mesh with size 1m. Also, the team considered the capacities of the laptops.
3. Results
3.1. Results of the first experiment
In the first experiment, the team simulated the building process of the tower and recorded the change of deformation. The team used the “mechanical” function in Ansys to record the vibration frequency and the deformation of the tower, the result image has been shown in Fig.9, Fig.10 and Figure11, the results data has been shown in Table 4.
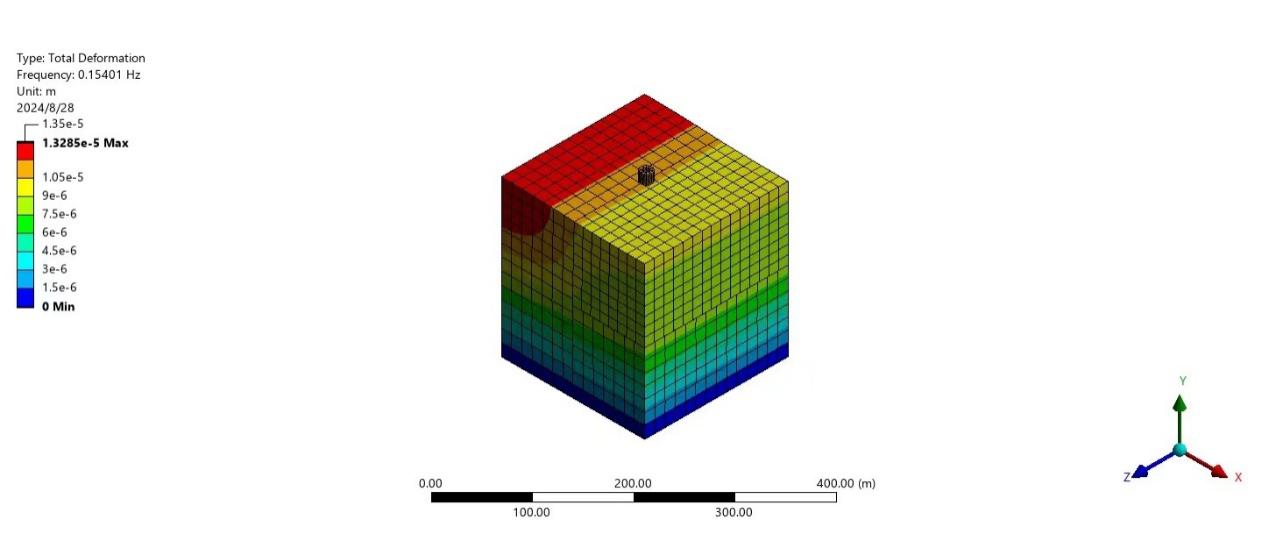
Figure 9. Stage one (12.7m).
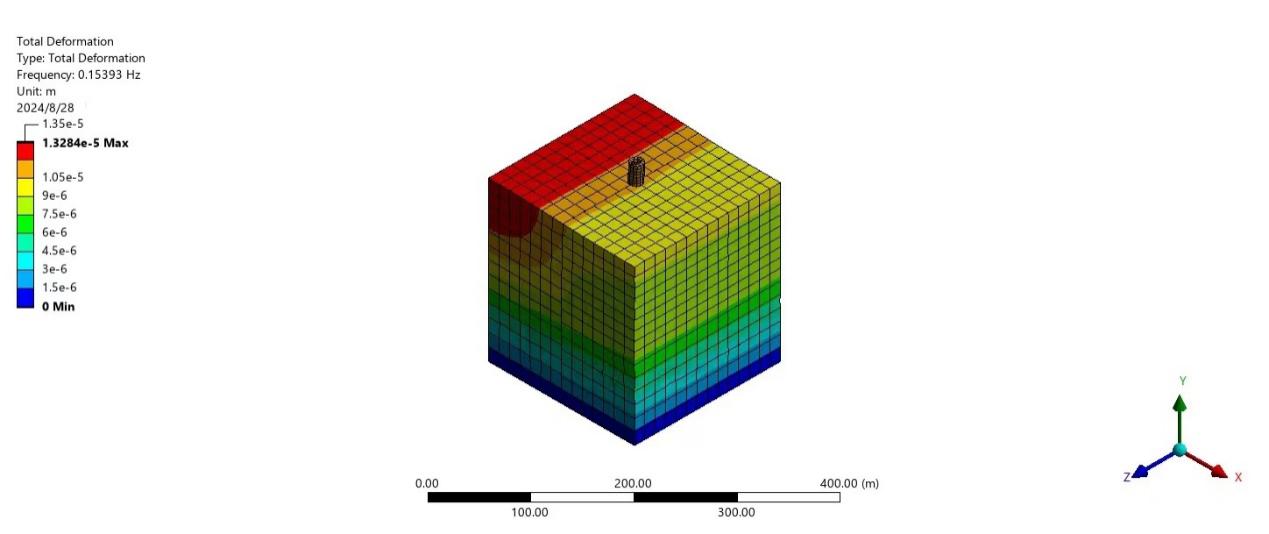
Figure 10. Stage two (24.6m).
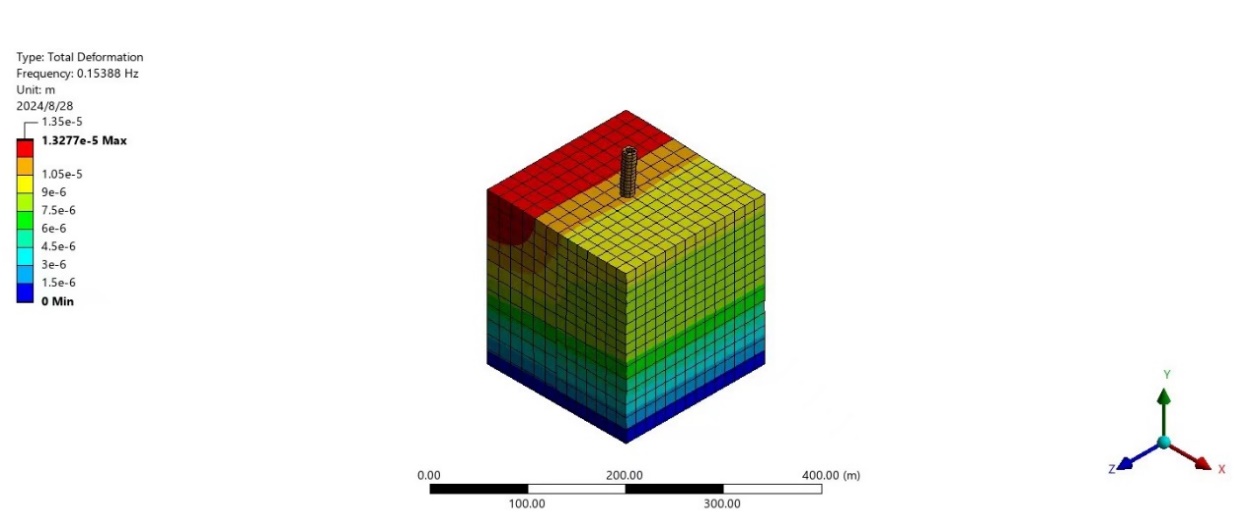
Figure 11. Stage three (55m).
Table 4. The results of the first experiments.
Stage | Deformation | Vibration frequency |
12.7m | 1.3285×10^(-5) m | 0.15401Hz |
24.6m | 1.3284×10^(-5) m | 0.15393Hz |
55m | 1.3275×10^(-5) m | 0.15388Hz |
According to this experiment, the team summarized the output data and made two diagrams: the change in vibration frequency of the soil block with respect to the increase of the tower’s height, which has been shown in Fig.12 and the change in deformation of the soil with respect to the increase of the tower’s height, which has been shown in Fig.13.
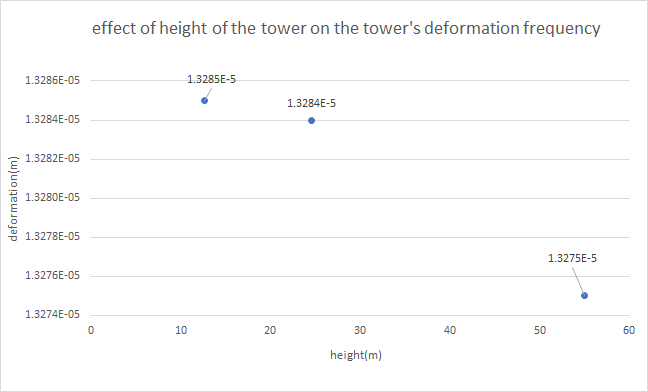
Figure 12. Deformation of the tower during the increase of tower height.
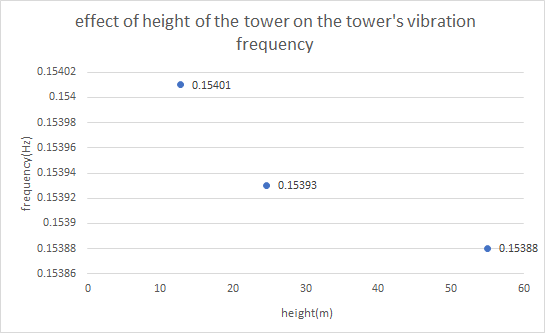
Figure 13. Vibration frequency of the model during the increase of the tower height.
In these two diagrams, it is obvious that both the deformation of the tower and the natural vibration frequency of the block decrease with the increase of the height. However, it’s difficult to see whether the slopes of the graphs are increasing or decreasing. The team used the equation below to calculate the average slope in a particular interval:
\( slope=\frac{Frequency2-Frequency1}{height2-height1} or slope=\frac{deformation2-deformation1}{height2-height1} \) (1)
After calculating, the team knew that the deformation curve’s slope decrease(slope<0) with the increase of the height, which shows that when the tower becomes higher, its impact on deformation become bigger. In addition, the vibration curve’ s slope increases, which shows that when the tower becomes higher, its impact on deformation becomes smaller.
3.2. Results of the second experiment
In the second experiment, the team took the Young’ s modulus of the soft clay as the variable, conducted three experiments which have been stated before. The results images have been shown in Fig.14, 15 and 16. The team used the “mechanical” function in Ansys to record the vibration frequency and the deformation of the tower. The result data has been shown in Table 5.
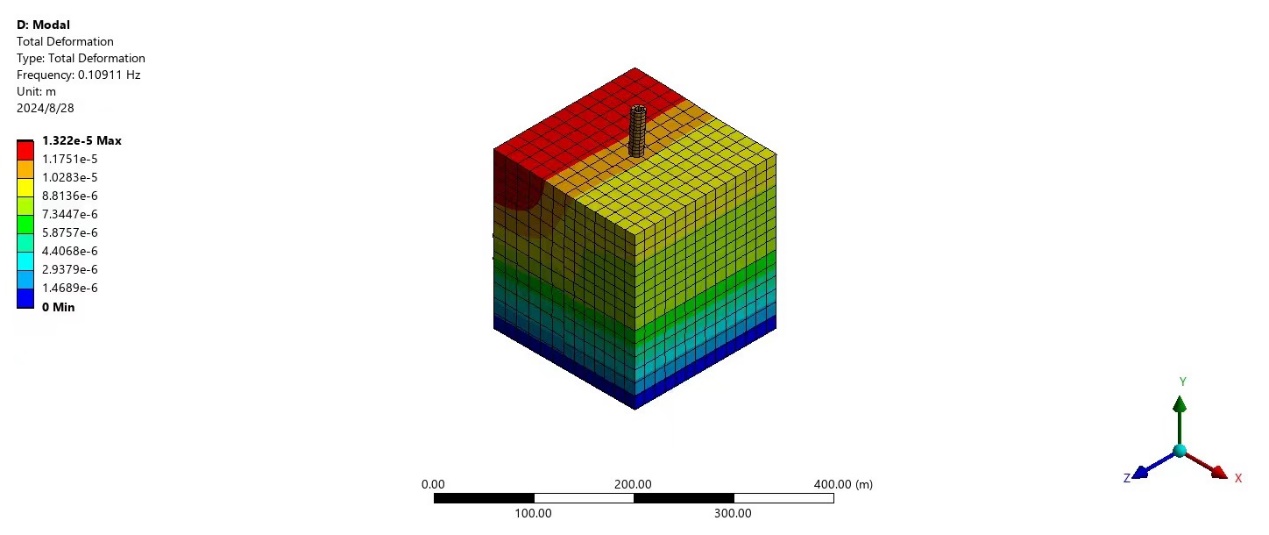
Figure 14. Young’s modulus was 1E+07.
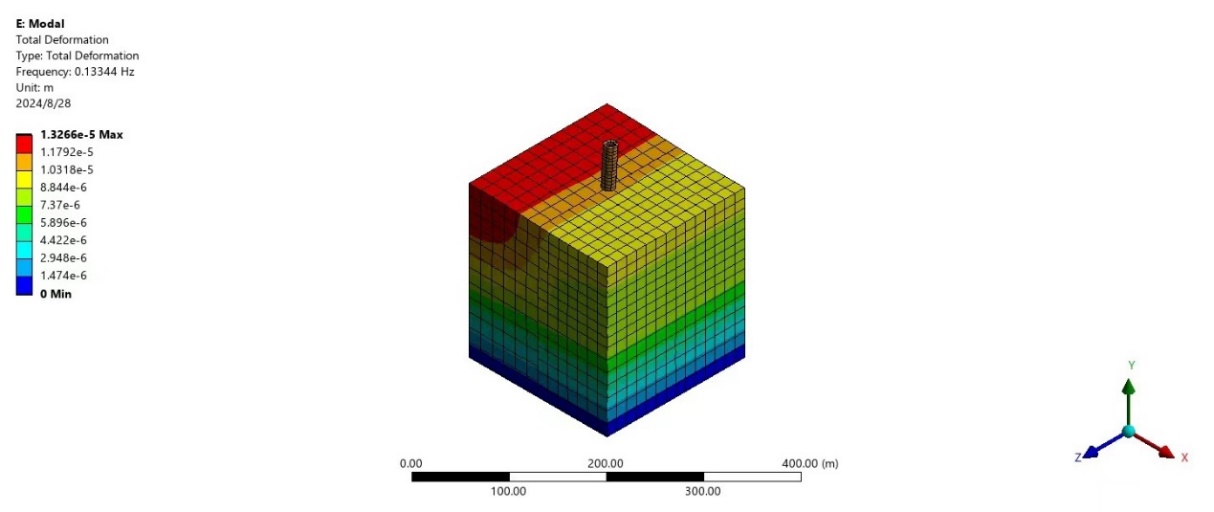
Figure 15. Young’s modulus was 1.5E+07.

Figure 16. Young’s modulus was 2E+07.
Table 5. The results of the second experiment.
Value soft soil layers' Young's Modulus | Deformation | Vibration frequency of the whole model |
1×10⁷ Pa | 1.322×10⁻⁵ m | 0.10911 Hz |
1.5×10⁷ Pa | 1.3266×10⁻⁵ m | 0.13344 Hz |
2×10⁷ Pa | 1.3287×10⁻⁵ m | 0.15388 Hz |
According to this experiment, the team summarized the output data and made two diagrams: the change in vibration frequency of the soil block with respect to the increase of the soft soil blocks’ Young’s modulus, which has been shown in Fig.17, and the change in deformation of the soil with respect to the increase of the tower’s and the change in soft soil blocks’ Young’s modulus, which has been shown in Fig.18.
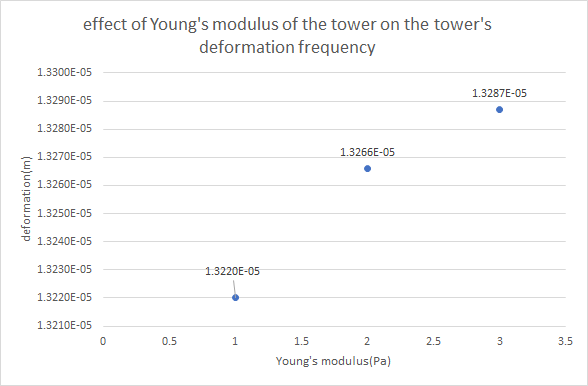
Figure 17. Deformation of the tower during the increase in soft soil layers’ Young’ s modulus.
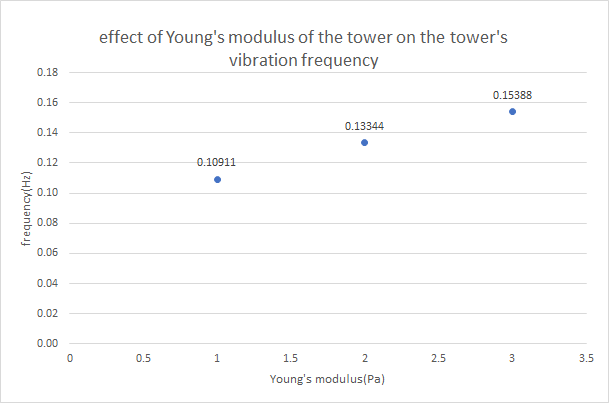
Figure 18. Vibration frequency during the increase in soft soil layers’ Young’s Modulus.
In these two diagrams, it is obvious that both the deformation of the tower and the natural vibration frequency of the block increase with the increase of the Young’s Modulus of the soft soil blocks. Also, both dependent variables’ slopes decrease(slope>0) with the increase of the height, which shows that when the soft soil blocks become harder, its impact on deformation and vibration frequency become smaller. Interestingly, the curve of the vibration frequency of the whole model is approximately liner, which means that the impact of the soft soil blocks’ Young’s Modulus on tower’s deformation is approximately constant.
4. Discussion
To reduce the inclination of the leaning tower around the world, many engineers repair or reinforce their foundation to fix it. By studying the effect of Young ’s modulus of soil on the deformation and vibration frequency, engineers can be able to formulate a better approach to preserve historical buildings such as the leaning tower of Pisa. In particular, the data can help engineers to predict how the tower will further tilt and deform under its weight and predict the stress the tower bears so that engineers can formulate approaches such as stabilizing the foundation and strengthening the tower’s material [9].
In addition, engineers can make use of the result of the research to develop a monitoring system to track the change of Young’ s modulus of soil under the leaning tower. When under torrential rain, the soil stiffness may change drastically and may cause the leaning tower to collapse. By developing and implicating the monitoring system, the system can deliver signals to engineers on time when the soil stiffness is under a risky point and enable engineers to make prompt measures to protect the leaning tower [10].
Indeed, the study has limitations. The study only models a single tube structure. However, there are many leaning towers with various structures. Therefore, the study’s conclusion is not comprehensive enough. In the future, it is suggested to model more specifically to draw conclusion on the leaning tower with different structure
5. Conclusion
This study uses a simplified model based on the Leaning Tower of Pisa. It investigates the impact of the tower’s height and the Young ‘s modulus of soft soil on its deformation and vibration frequency. Based on the results and discussions presented above, the conclusions are obtained as below:
(1) By the first experiments, which were conducted by using Ansys to model the leaning tower, the results reveal that both deformation and vibration frequency of the whole model decreases as the height increase.
(2) The second study also shows that with the increase of soft soil layers’ Young’ s modulus, both deformation of the tower and vibration frequency of whole model increase. By the study, it is confident that the understanding of the effect of height and Young’ s modulus to the deformation and vibration frequency.
(3) From the discussion, the research result can provide relevant data for engineers to optimize the approach of preserving the leaning tower. The result also has limitations that it only models a single structure, and the result is not able to implicate in leaning tower with other structures.
Acknowledgement
Shang Deye, Qin Puxun, Huang Chenghao contributed equally to this work and should be considered co-first authors.
References
[1]. Burland, J. B., & Jamiolkowski, M. (2003). “The stabilization of the Leaning Tower of Pisa.” Proceedings of the Institution of Civil Engineers - Geotechnical Engineering, 156(1), 3-23.
[2]. Antonaci, E., Saitta, F., Vona, M., & Masi, A. (2020). Seismic vulnerability assessment of the Leaning Tower of Pisa: The role of nonlinear soil–structure interaction. Soil Dynamics and Earthquake Engineering, 132, 106045.
[3]. Şimon-Marinică, A.B., Vlasin, N.-I., Manea, F. and Florea, G.-D. 2021. Finite element method to solve engineering problems using ansys. MATEC Web of Conferences. 342, pp.1015.
[4]. Brownjohn, J. M., De Stefano, A., Xu, Y. L., Wenzel, H., & Aktan, A. E. (2011). Vibration-based monitoring of civil infrastructure: challenges and successes.
[5]. Castellanza, R., & Nova, R. (2004). Oedometric tests on artificial weak rocks. Journal of Geotechnical and Geoenvironmental Engineering, 130(7), 726-739.
[6]. Mitchell, J. K., & Soga, K. (2005). Fundamentals of Soil Behavior. John Wiley & Sons.
[7]. P. Y. Ghodke, et al. 2017. Modal Analysis Of Cracked Continuous Beam Using ANSYS. International Research Journal of Engineering and Technology. 4(2):86-93.
[8]. Hu, G., Zhu, S., Gao, R., & Xiao, L. (2021, November). Modeling and analysis of Shanghai Tower based on Ansys Workbench. In 2021 4th International Symposium on Traffic Transportation and Civil Architecture (ISTTCA) (pp. 312-319). IEEE.
[9]. Giretti, A., Carbonari, A., & Naticchia, B. (2013). Towards a real-time architecture for automatic monitoring of construction operations. Automation in Construction, 29, 128-136.
[10]. Saitta, F., Vona, M., & Masi, A. (2020). Seismic vulnerability assessment of the Leaning Tower of Pisa: The role of nonlinear soil–structure interaction. Soil Dynamics and Earthquake Engineering, 132, 106045.
Cite this article
Shang,D.;Qin,P.;Huang,C. (2024). Modelling and Analysis of the Pisa Tower Based on ANSYS. Theoretical and Natural Science,53,216-225.
Data availability
The datasets used and/or analyzed during the current study will be available from the authors upon reasonable request.
Disclaimer/Publisher's Note
The statements, opinions and data contained in all publications are solely those of the individual author(s) and contributor(s) and not of EWA Publishing and/or the editor(s). EWA Publishing and/or the editor(s) disclaim responsibility for any injury to people or property resulting from any ideas, methods, instructions or products referred to in the content.
About volume
Volume title: Proceedings of the 2nd International Conference on Applied Physics and Mathematical Modeling
© 2024 by the author(s). Licensee EWA Publishing, Oxford, UK. This article is an open access article distributed under the terms and
conditions of the Creative Commons Attribution (CC BY) license. Authors who
publish this series agree to the following terms:
1. Authors retain copyright and grant the series right of first publication with the work simultaneously licensed under a Creative Commons
Attribution License that allows others to share the work with an acknowledgment of the work's authorship and initial publication in this
series.
2. Authors are able to enter into separate, additional contractual arrangements for the non-exclusive distribution of the series's published
version of the work (e.g., post it to an institutional repository or publish it in a book), with an acknowledgment of its initial
publication in this series.
3. Authors are permitted and encouraged to post their work online (e.g., in institutional repositories or on their website) prior to and
during the submission process, as it can lead to productive exchanges, as well as earlier and greater citation of published work (See
Open access policy for details).
References
[1]. Burland, J. B., & Jamiolkowski, M. (2003). “The stabilization of the Leaning Tower of Pisa.” Proceedings of the Institution of Civil Engineers - Geotechnical Engineering, 156(1), 3-23.
[2]. Antonaci, E., Saitta, F., Vona, M., & Masi, A. (2020). Seismic vulnerability assessment of the Leaning Tower of Pisa: The role of nonlinear soil–structure interaction. Soil Dynamics and Earthquake Engineering, 132, 106045.
[3]. Şimon-Marinică, A.B., Vlasin, N.-I., Manea, F. and Florea, G.-D. 2021. Finite element method to solve engineering problems using ansys. MATEC Web of Conferences. 342, pp.1015.
[4]. Brownjohn, J. M., De Stefano, A., Xu, Y. L., Wenzel, H., & Aktan, A. E. (2011). Vibration-based monitoring of civil infrastructure: challenges and successes.
[5]. Castellanza, R., & Nova, R. (2004). Oedometric tests on artificial weak rocks. Journal of Geotechnical and Geoenvironmental Engineering, 130(7), 726-739.
[6]. Mitchell, J. K., & Soga, K. (2005). Fundamentals of Soil Behavior. John Wiley & Sons.
[7]. P. Y. Ghodke, et al. 2017. Modal Analysis Of Cracked Continuous Beam Using ANSYS. International Research Journal of Engineering and Technology. 4(2):86-93.
[8]. Hu, G., Zhu, S., Gao, R., & Xiao, L. (2021, November). Modeling and analysis of Shanghai Tower based on Ansys Workbench. In 2021 4th International Symposium on Traffic Transportation and Civil Architecture (ISTTCA) (pp. 312-319). IEEE.
[9]. Giretti, A., Carbonari, A., & Naticchia, B. (2013). Towards a real-time architecture for automatic monitoring of construction operations. Automation in Construction, 29, 128-136.
[10]. Saitta, F., Vona, M., & Masi, A. (2020). Seismic vulnerability assessment of the Leaning Tower of Pisa: The role of nonlinear soil–structure interaction. Soil Dynamics and Earthquake Engineering, 132, 106045.