


1. Introduction
X-ray images are helpful in determining many pulmonary diseases, among which pneumonia is very important. The method that relies on radiologists' experiences is traditional for the diagnosis of pneumonia. However, this method brings lots of drawbacks such as high subjectivity and relatively high misdiagnosis rates. With the advent of machine learning technologies, particularly of late, new opportunities for medical image analysis that could greatly enhance the accuracy and efficiency in the diagnosis of pneumonia were opened[1].
In this study, uncertainty quantification and sensitivity analysis were performed to improve the segmentation accuracy and reliability of the model by performing the segmentation process on lung X-ray images. Uncertainty quantification was used to assess model prediction reliability, providing physicians with confidence estimates about the accuracy of model predictions[2]. This approach helps physicians understand and assess the uncertainty of model predictions and improves the stability and reliability of medical decisions.
Sensitivity analysis determines the effect of model input variables on output by controlling for them[3]. We used sensitivity analysis to identify key factors that affect the accuracy of lung X-ray image segmentation, including image quality, image processing techniques, model parameters, and training parameters. This helps to improve the accuracy of model segmentation and provides a reference for data collection, processing, and model selection in related studies, thus optimizing the entire diagnostic process.
Through these two analysis methods, this study aims to:
1. Analyze the key issues affecting the performance of the model through the methods of uncertainty quantification and sensitivity analysis and improve the stability of the model in the clinical environment.
2. Present the diagnostic decision process of the model clearly through uncertainty quantification analysis to improve reliability.
3. Improve the accuracy of lung X-ray segmentation results through model selection and model parameter adjustment.
2. Related work
In the task of X-ray image classification, convolutional neural networks (CNNs) are the most commonly used model architecture[4-6]. Common network architectures include AlexNet[7], VGG[8], Inception[9], ResNet[10], and Xception[11]. These models identify and classify lung diseases by extracting image features. For example, Inception V3, Xception, and ResNeXt have been used to compare their performance in lung X-ray classification tasks, showing that Xception performs best in accuracy. AlexNet, as one of the earlier deep learning models, extracts and classifies image features through multiple convolutional layers and fully connected layers. VGG uses smaller convolution kernels (e.g., 3x3) and more convolutional layers to achieve detailed image feature extraction. The Inception series models introduce parallel convolution operations to extract multi-scale features in the same layer, while ResNet introduces residual blocks to solve the gradient vanishing problem common in deep networks, allowing deeper feature extraction.
In addition, the successful classification of X-ray images largely depends on high-quality datasets. Common datasets used in lung X-ray analysis include ChestX-ray14 and the COVID-19 X-ray dataset. ChestX-ray14[12], provided by the National Institutes of Health (NIH), contains 112,120 frontal view X-rays and 14 common chest pathology labels. This dataset provides rich data support for multi-label classification tasks and is commonly used to train and evaluate classification models. The COVID-19 X-ray dataset[13], released by multiple institutions during the pandemic, contains X-rays of COVID-19 patients and is used to study and classify the differences between COVID-19 and other lung diseases.
When discussing the detailed task of X-ray classification, model training and evaluation are crucial. Standard methods include data augmentation and transfer learning[14]. By flipping, rotating, scaling, and other operations on training data, data diversity can be increased, and model generalization ability can be enhanced. Transfer learning uses pre-trained model weights on large-scale datasets (such as ImageNet) and fine-tunes them on lung X-ray datasets, accelerating the training process and improving classification performance. Standard evaluation metrics include accuracy, recall, and F1-score, which comprehensively evaluate model performance in classification tasks.
Despite significant progress in lung X-ray analysis, challenges remain, including the diversity of datasets, label inaccuracies, model decision interpretability, and integration with clinical applications. Future research should continue to focus on these issues, especially improving model transparency and interpretability so that doctors can better understand and trust automated system predictions. By continuously improving model architecture, optimizing training methods, and enriching datasets, we aim to achieve more efficient and accurate automated lung disease diagnosis systems in the future.
3. Methodology
3.1. Data Pre-processing
First of all, we define two types of tags: Bacteria and Virus and are represented by numbers 1 and 0 respectively. We loaded image data sets from the specified path folder, which are different categories. The name file name of each class is divided into training sets, verification sets and test sets according to a certain proportion.
Image data is prepared after loading, including random rotation and horizontal flip, contrast and brightness adjustment, image size adjustment, random cutting, normalization processing, etc., which increases the diversity of data, and also makes the model even more robust. In addition to this, In addition, we tried to add Gaussian noise of different intensity to each picture. By analyzing the impact of noise on the results of the image, the robustness of the image was increased by finding the right noise.
3.2. Model Construction
We adopt a ResNet[10] (residual network) architecture. This is a network structure designed to solve the problem of gradient disappearance in deep neural networks. The deep neural network for image classification is constructed in a custom method. RESNET is introduced by the introduction of the structure called "residual block", allowing input to directly skip some levels to be deeper to deeper, thereby achieving deeper network training. This design not only helps the network to learn identity functions, but also enables the network to improve accuracy by increasing additional layers without bringing additional training burden. Effect. The network structure we use is shown in the figure below:
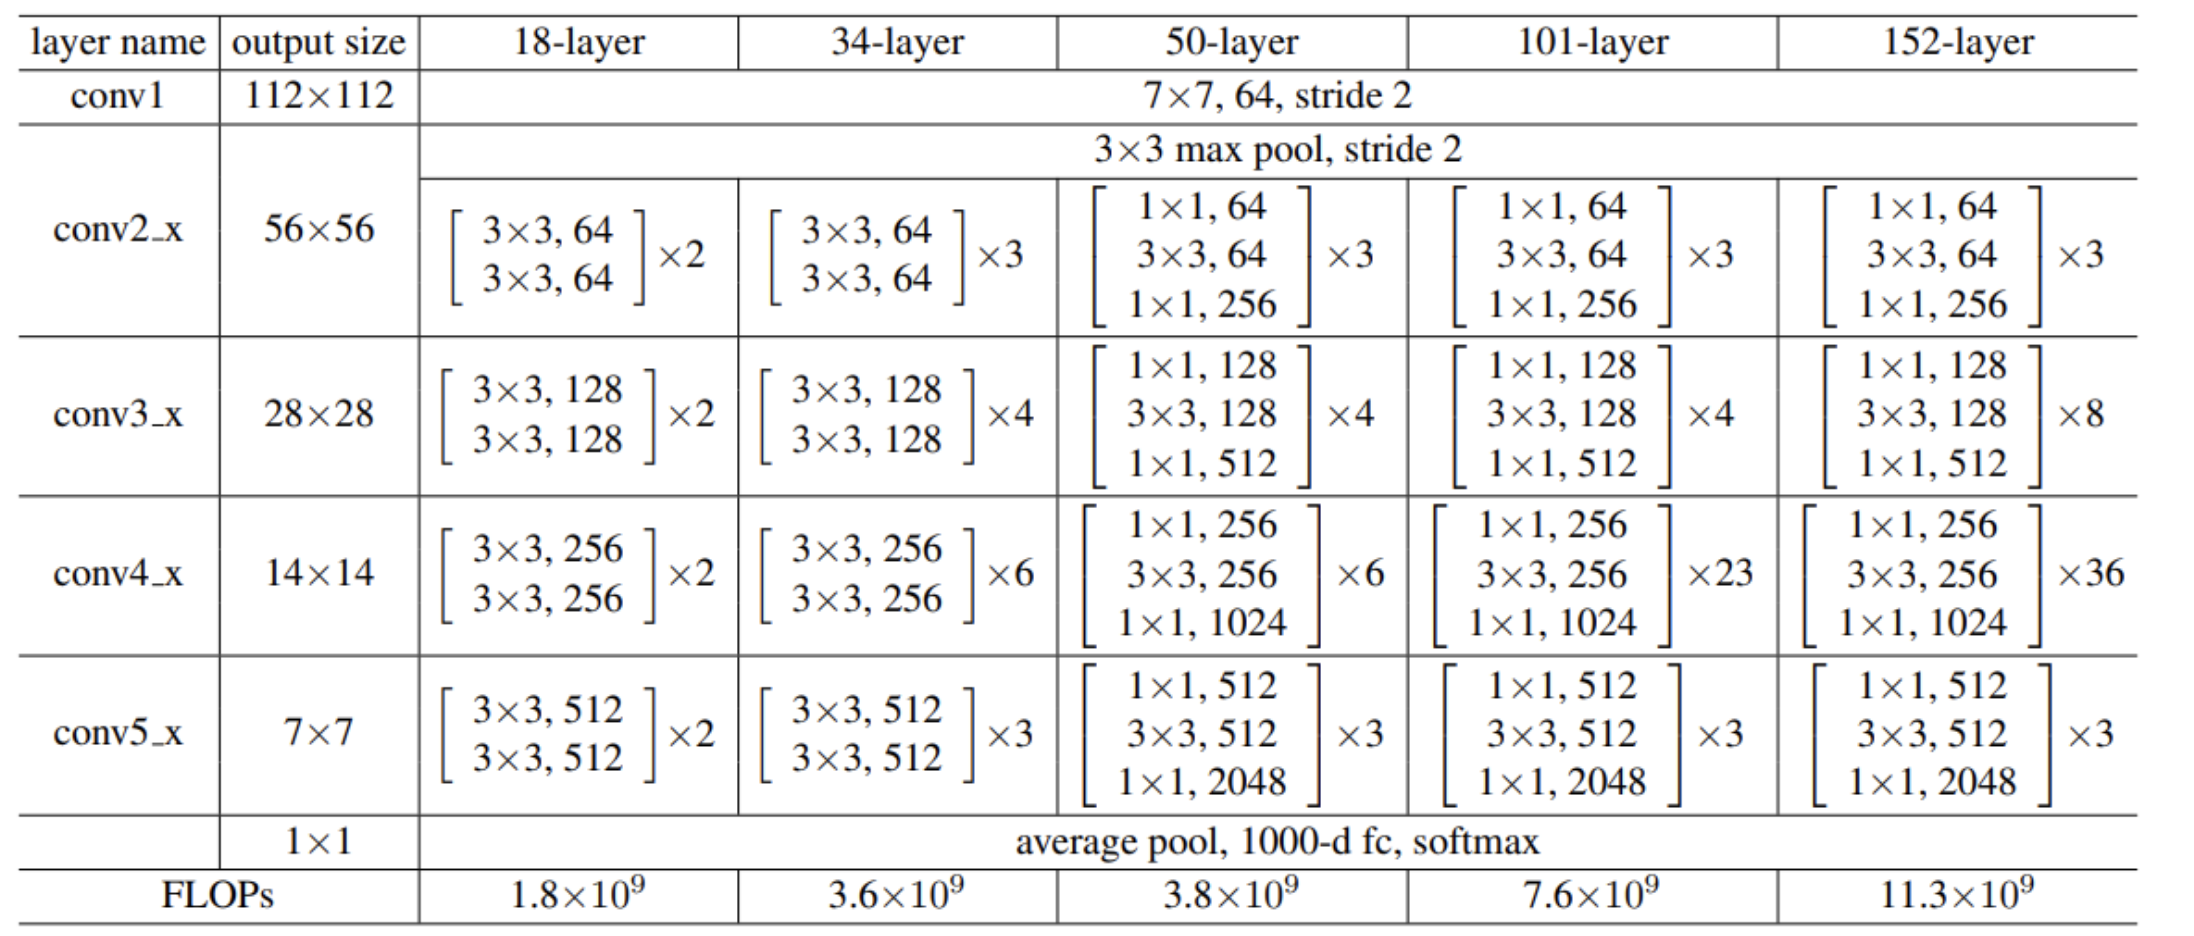
Figure 1. Model Architecture Diagram
Generally, more complex networks should learn more and have higher accuracy[15]. However, experiments have shown that overly complex networks lead to reduced accuracy due to overfitting. Therefore, we used dropout techniques to mitigate overfitting caused by overly complex network models. Dropout is a regularization technique that randomly drops a portion of neurons during training to prevent overfitting[16]. It forces the model to learn features without relying on specific neurons, improving its generalization ability. To achieve better results, we explored the impact of different dropout rates on model accuracy and identified the optimal dropout rate to enhance accuracy.
3.3. Training Setup
We used a Momentum optimizer with polynomial decay learning rate and momentum, adjusting various parameters to improve model stability and convergence speed during training. We explored the impact of different learning rates and regularization terms on the model. During training, we periodically evaluated the model and saved the best-performing model on the validation set. Dropout was used to prevent overfitting, enhancing generalization ability. Additionally, the correct loss function was necessary. In this project, we used cross-entropy loss, which performs well in classification tasks, especially multi-class problems. Correctly setting and optimizing the loss function not only improves training effectiveness but also prevents overfitting. By constantly adjusting and optimizing loss function parameters, we aimed to further enhance model accuracy and robustness.
3.4. Model Evaluation and Result Analysis
Finally, we evaluated the best-saved model on the test set, generating confusion matrices and classification reports to evaluate the model's performance across different categories. We also plotted ROC curves to further assess the model's classification effectiveness and discriminative ability.
4. Experimental Results
To make the experiment clearer and more accurate for subsequent sensitivity and uncertainty analysis, we fixed some experimental parameters. The specific settings were as follows: using Paddle's Momentum optimizer with a learning rate (lr), momentum of 0.9, weight decay coefficient of 1e-4, applied to model parameters; batch size of 30, training period of 30 epochs; polynomial decay learning rate strategy with base_lr, decay power of 0.9, decay steps of decay_steps, and final learning rate of 0.0. Additionally, validation was performed every 5 epochs, the model was saved every 5 epochs, and training information was printed every 30 steps.
4.1. Sensitivity Analysis
For the effect of data augmentation parameters, specifically the impact of rotation operations on model performance, accuracy was used as the performance indicator. The model achieved the highest accuracy (0.805) when the rotation angle was 10 degrees and the rotation probability was 0.1. This indicates that a smaller rotation angle and lower application probability allow the model to learn better while maintaining generalization ability. For any given rotation angle, model accuracy generally decreased with increasing rotation probability, likely due to excessive image deformation interfering with model learning. When the rotation probability was 0.1, accuracy initially decreased with increasing rotation angle but rebounded at 20 degrees, suggesting that excessive rotation may harm learning effectiveness, though moderate increases in rotation range can help capture more image variations.
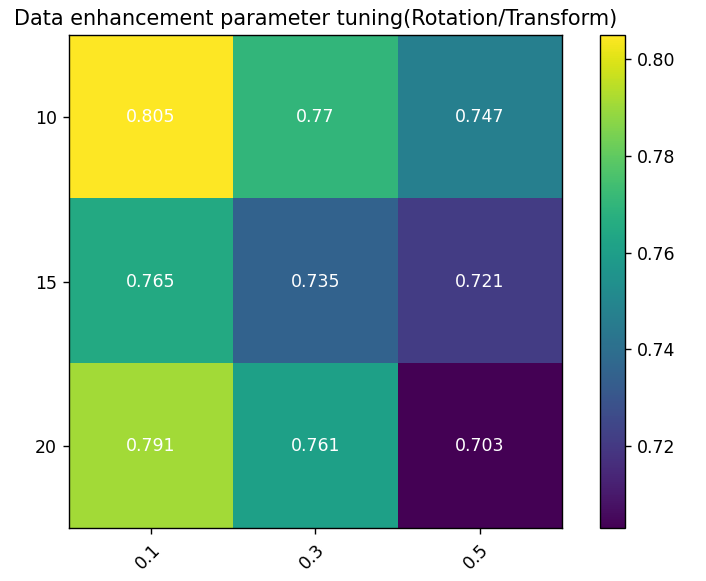
Figure 2. Data Augmentation Sensitivity Heatmap: Color coding reflects model performance under different parameter combinations; Y-axis represents maximum rotation angle; X-axis represents rotation probability, i.e., the probability of random rotation during data augmentation.
Table 1. Data Augmentation Sensitivity Experimental Results.
RandomRotation | ContrastTransform | BrightnessTransform | Accuracy |
10 | 0.1 | 0.1 | 80.52% |
15 | 0.1 | 0.1 | 76.53% |
20 | 0.1 | 0.1 | 79.11% |
10 | 0.3 | 0.3 | 77.00% |
15 | 0.3 | 0.3 | 73.47% |
20 | 0.3 | 0.3 | 76.06% |
10 | 0.5 | 0.5 | 74.65% |
15 | 0.5 | 0.5 | 72.15% |
20 | 0.5 | 0.5 | 70.33% |
Additionally, we considered the potential impact of adding noise to the model. To study this, we added Gaussian noise to the images. To ensure experiment reliability, we kept other variables constant, changing only the Gaussian noise radius (2, 3, 5, and 10). This method allowed us to observe and analyze different noise intensities' effects on model performance, assessing robustness and stability. The final results are shown below:
Table 2. Noise Intensity Sensitivity Experimental Results
Radius | Accuracy | Radius | Accuracy |
2 | 0.7745 | 5 | 0.9023 |
3 | 0.8863 | 10 | 0.7565 |
Sensitivity analysis of model structure parameters, covering different network layers and the number of filters per layer, affecting model performance (accuracy indicator).
The model achieved the highest accuracy (0.807) with 50 layers and 64 filters, indicating that fewer layers with smaller filter numbers capture essential features without overfitting. For 50 and 101 layers, increasing filters from 64 to 128 slightly reduced performance, with further decreases at 256 and 512. This suggests excessive filters unnecessarily increased complexity without performance gains. With 64 filters, performance decreased with more layers (50 to 152), not exceeding initial highest values, implying more layers don't always benefit, especially when sufficient layers capture features. The lowest performance (0.692) was with 50 layers and 512 filters, indicating over-parameterization harms performance.
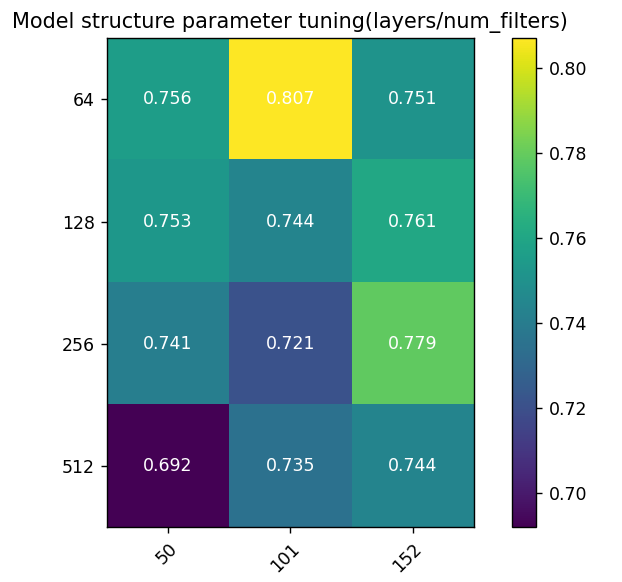
Figure 3. Model Structure Sensitivity Heatmap: Color coding reflects performance under different parameter combinations; Y-axis represents filters per layer; X-axis represents ResNet layers.
Table 3. Model Structure Sensitivity Experimental Results
Layers | Num_filters | Stride | Accuracy |
50 | 64 | 2 | 75.59% |
101 | 64 | 2 | 80.56% |
152 | 64 | 2 | 75.12% |
50 | 128 | 2 | 75.30% |
101 | 128 | 2 | 74.41% |
152 | 128 | 2 | 76.06% |
50 | 256 | 2 | 74.10% |
101 | 256 | 2 | 72.07% |
152 | 256 | 2 | 77.93% |
50 | 512 | 2 | 69.20% |
101 | 512 | 2 | 73.47% |
152 | 512 | 2 | 74.41% |
Sensitivity analysis of training parameters shows the impact of training epochs and batch size on model performance (accuracy indicator).
The highest accuracy (0.805) was achieved with 30 epochs and batch size of 30, indicating optimal performance with fewer epochs and smaller batch size, possibly due to rapid adaptation without overfitting. Increasing batch size from 30 to 50 and 100 slightly decreased performance, suggesting smaller batch sizes aid faster convergence and generalization. Increasing epochs from 30 to 60 decreased performance for all batch sizes. At batch size 100, 60 epochs had better performance (0.781) than 30 epochs, suggesting more epochs aid larger batch sizes, with overfitting risk. The lowest performance (0.704) was with 60 epochs and batch size 30, indicating potential overfitting or learning inefficiency.
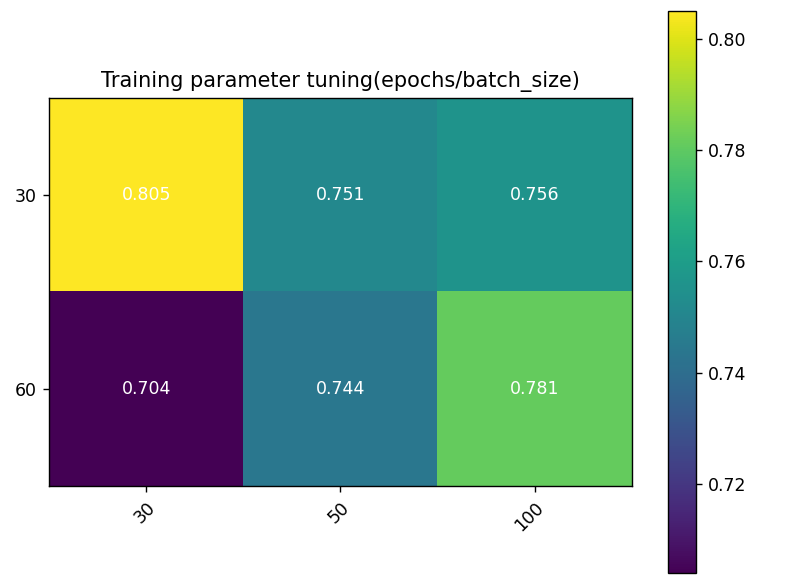
Figure 4. Training Parameter Sensitivity Heatmap: Color coding reflects performance under different parameter combinations; Y-axis represents training epochs, X-axis represents batch size.
Table 4. Training Parameter Sensitivity Experimental Results
BATCH_SIZE | EPOCHS | Momentum | Accuracy |
30 | 30 | 0.9 | 80.56% |
30 | 50 | 0.9 | 75.12% |
30 | 100 | 0.9 | 75.59% |
60 | 30 | 0.9 | 70.42% |
60 | 50 | 0.9 | 74.41% |
60 | 100 | 0.9 | 78.17% |
Additionally, we explored the impact of learning rate and regularization on model accuracy. We designed experiments adjusting these parameters, observing their effects on performance. Specifically, we set three learning rates (0.001, 0.01, 0.1) and three regularization parameters (0.001, 0.01, 0.1), recording accuracy for each combination. Results are shown in the figure below.
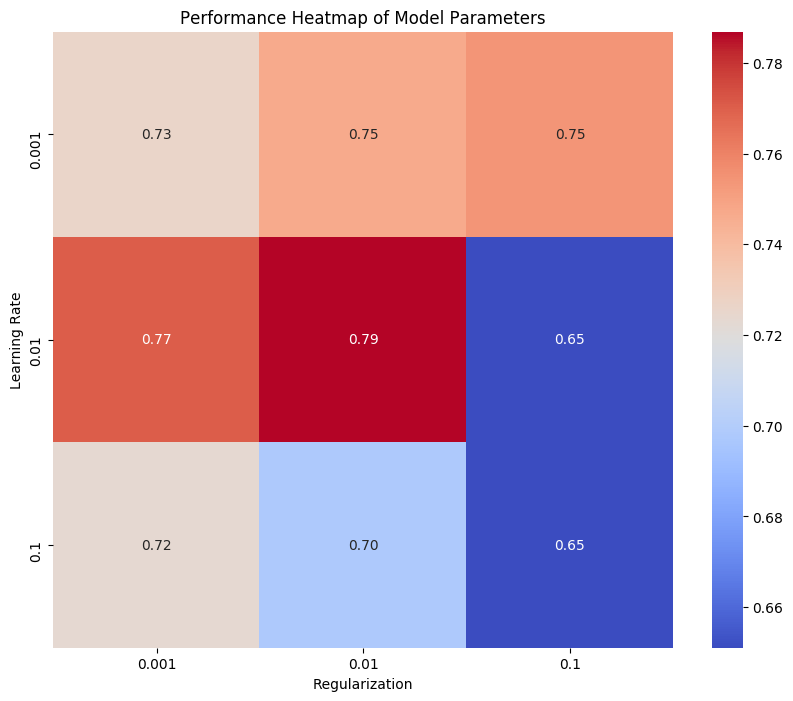
Figure 5. Model Parameter Performance Sensitivity Heatmap: Color coding reflects performance under different parameter combinations; Y-axis represents regularization parameter, X-axis represents learning rate.
This heatmap shows model performance, with the horizontal axis for regularization parameter values and the vertical axis for learning rates. Heatmap color intensity indicates accuracy, darker colors representing higher values. The highest accuracy (0.79) occurred with a learning rate of 0.01 and regularization parameter of 0.01, suggesting optimal performance with moderate values. High learning rates (0.1) reduced performance, and large regularization parameters (0.1) significantly lowered accuracy.
From this analysis, we conclude moderate learning rates and regularization parameters balance overfitting and underfitting, enhancing accuracy and robustness. High values degrade performance, resulting in lower accuracy.
4.2. Uncertainty Quantification
We experimented with four dropout rates: 0.1, 0.3, 0.5, and 0.7. Each rate trained and validated the model on the same dataset, recording changes in training loss, validation loss, and validation accuracy. The model trained for 30 epochs.
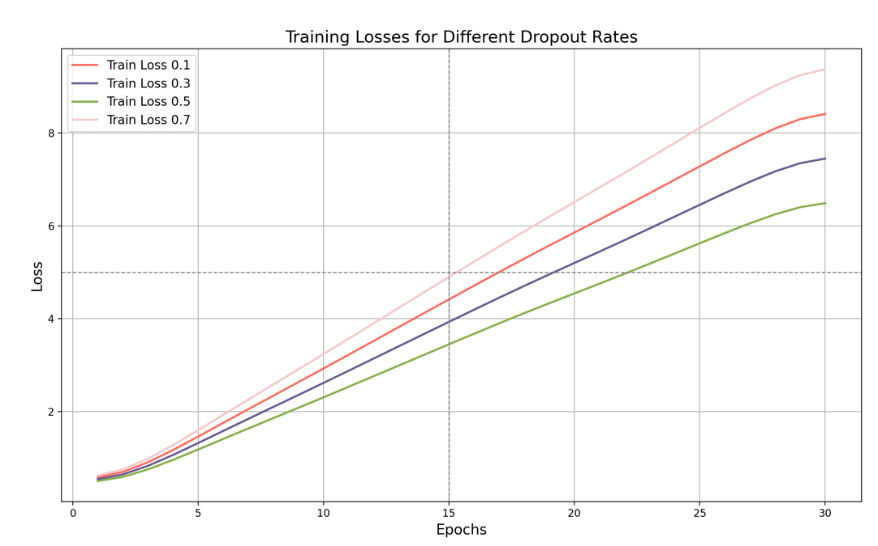
Figure 6. Training Loss with Dropout Rates
In the training loss graph, as the training iterations progress, we can clearly see the difference in performance for different dropout rates. When the dropout rate is 0.1, the training loss is high, eventually reaching about 8.5. This indicates that the lower dropout rate fails to effectively prevent overfitting, resulting in higher training loss. A low dropout rate means fewer neurons are ignored during training, causing the model to be overly confident on the training data and failing to generalize effectively to new data. When the dropout rate is 0.3, the training loss is reduced, reaching about 7.5, showing some improvement compared to a 0.1 dropout rate. Moderately increasing the dropout rate helps prevent overfitting, making the model perform more stably on the training set. The current dropout rate is not yielding the best results, and the training loss remains relatively high. As shown in the figure, when we set the dropout rate to 0.5, the training loss will drop significantly, eventually reaching about 6.5, indicating that a dropout rate of 0.5 is relatively effective in preventing overfitting. A moderate dropout rate can reduce the model's dependence on training data, thereby improving generalization capabilities without significantly reducing the model's expressiveness. On the contrary, when we increase the dropout rate to 0.7, as shown in the figure, the training loss will rise to about 9.5, indicating that although a higher dropout rate can more effectively prevent overfitting, it will also have a negative impact on the model's expressiveness. Moreover, a too high dropout rate will cause too many neurons to be ignored during training, limiting the model's learning ability.
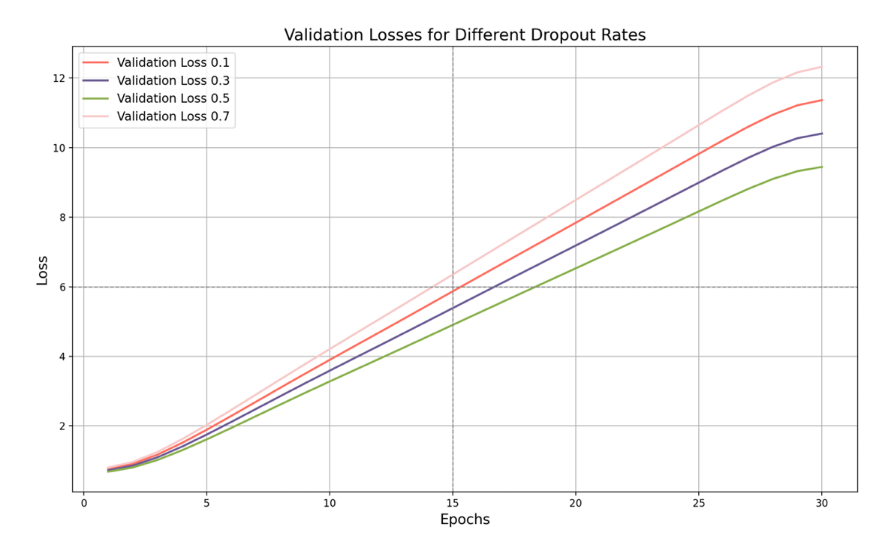
Figure 7. Validation Loss with Dropout Rates
As can be seen in Figure 7, the validation loss is highest when the dropout rate is 0.1, and eventually reaches around 11. This shows that a lower dropout rate causes the model to perform poorly on the validation set due to insufficient generalization. While the model performs well on the training data, it struggles when processing new data, resulting in a high validation loss. The key point is that when the dropout rate is 0.5, the validation loss reaches its lowest point, around 9.7. This shows that the model performs best on the validation set with the strongest generalization ability at this rate. The model effectively prevents overfitting during training and shows low losses on the validation data, demonstrating robust generalization ability.
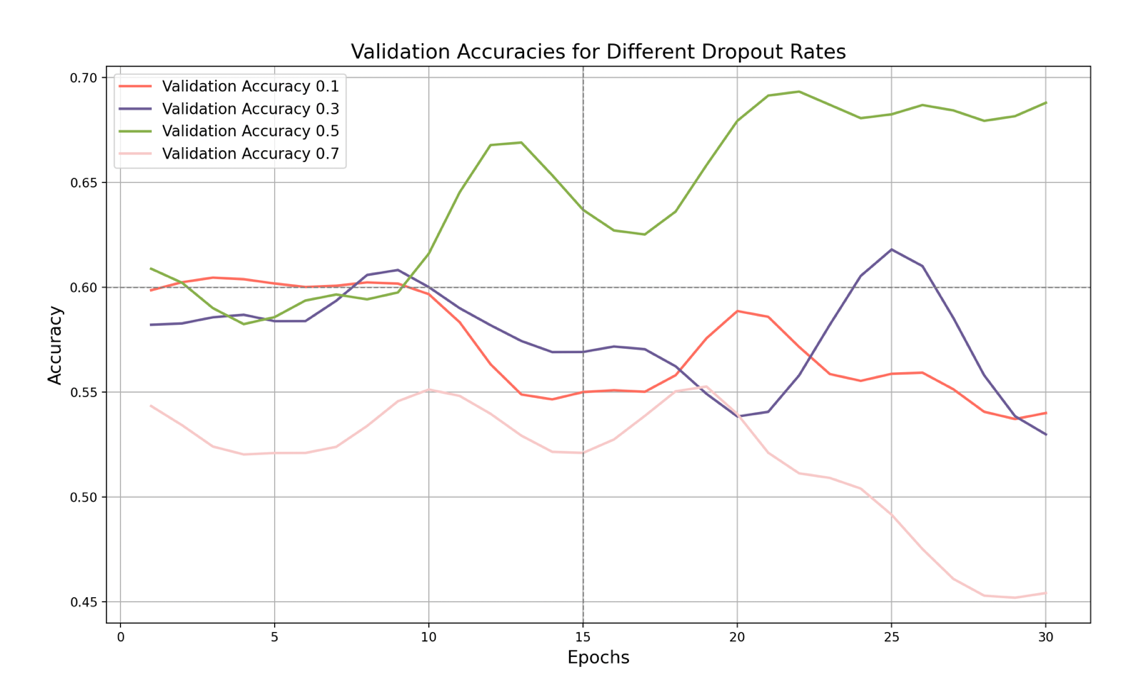
Figure 8. Validation Accuracy with Dropout Rates
Finally, let's look at the validation set accuracy graph. It shows the effect of different dropout rates on the validation set accuracy. As shown in the figure, when the dropout rate is 0.1, the validation set accuracy is the lowest, and finally stabilizes at around 54%, with little fluctuation. This shows that such a low dropout rate fails to improve the generalization ability of the model, resulting in unstable performance on the validation set.
When the dropout rate increases to 0.3, the validation set accuracy increases slightly to about 53%, indicating a slight improvement in generalization ability. Although the model performs better on the validation set, it still does not reach the optimal level, and the accuracy is still relatively low.
The key point is that when the dropout rate is 0.5, the validation set accuracy reaches the highest point. Although it fluctuates greatly, the accuracy shows that the model performs best on the validation set under this dropout rate, effectively capturing data diversity and improving generalization ability. When the dropout rate is 0.7, the validation accuracy is lower, with large fluctuations, eventually stabilizing at about 46%. Although a higher dropout rate can improve generalization ability, an excessively high dropout rate may cause unstable model performance. The model's performance on the validation set is poor, with large accuracy fluctuations and a low overall level.
Overall, from the perspective of training loss, a higher dropout rate (such as 0.7) can better prevent overfitting, but a dropout rate of 0.5 already effectively reduces training loss without excessively reducing the model's expressive power. From the perspective of validation accuracy, the model performs best when the dropout rate is 0.5, with the highest validation accuracy and large fluctuations, indicating that it can better capture data diversity.
4.3. Findings and Conclusions
Through experimental analysis of rotation enhancement and noise enhancement, we found that the moderate rotation angle (10 degrees) and low rotation probability (0.1) can be used to avoid the interference of model learning while increasing data diversity, thereby increasing the model of the model Accuracy. This moderate rotation enhancement can help models better capture changes and characteristics in images and improve their generalization capabilities. In addition, adding an appropriate amount of Gaussian noise can enhance the robustness of the model in the noise environment, so that it can still maintain stability when facing uncertainty. The experimental results of the enhancement of noise show that moderate noise enhancement can still show good stability and accuracy under noise interference of different intensities.
In the sensitivity analysis of the model structure and training parameters, we found that the network configured with 50 layers and 64 filters reached the best performance (0.807), which indicates that this structure can effectively capture the key features in the data without excessive complexity change. The smaller number of layers and a moderate filter quantity enable the model while ensuring sufficient expression capabilities and avoiding excessive fitting and computing resources. At the same time, smaller batch sizes (30) and fewer training rounds (30) will help the model to quickly adapt to training data, prevent overfitting, and ensure the generalisation ability and stability of the model. For training parameters, smaller batch sizes and fewer training rounds make the model converge faster and maintain better performance during the training process. In addition, a moderate learning rate (0.01) and regularization parameters (0.01) have achieved balance between preventing overfitting and arrearting, significantly improved the accuracy and robustness of the model. Reasonable learning rates and regularization parameters can effectively learn the model during training, while avoiding the performance of performance caused by excessive or too small parameter values.
Through experimental research on different Dropout rates, we found that when the Dropout rate is 0.5, the Resnet model is the best performance in training loss, verification loss and verification accuracy. When the Dropout rate is 0.5, it can effectively prevent overfitting. It has strong generalization capabilities. At the same time, it can better capture the diversity of data and improve the performance of the model on the verification set.
Judging from the training loss, although the higher Dropout rate (such as 0.7) can better prevent overfitting, it will cause the learning ability of the model to be limited and increase the training loss. In contrast, the 0.5 Dropout rate, while reducing training loss, can effectively maintain the expression of the model. In terms of verification loss, when the DROPOUT rate is 0.5, the model has the best performance in the verification set and the strongest generalization capabilities. The lower Dropout rate (such as 0.1) causes the model to perform poorly on the verification set, while the higher Dropout rate (such as 0.7) can prevent overfitting, but it may also damage the performance of the model.
By combining rotation enhancement, noise enhancement, model structure optimization, training parameter adjustment, and Dropout technology, we can comprehensively improve the performance of the model. Moderate rotation and noise enhancement can increase data diversity and improve the robustness of the model; the reasonable configuration network structure and training parameters ensure that the model can effectively capture the features and avoid overfitting; moderate Dropout further enhances the model of the model Generalization. The comprehensive application of these methods has enabled our model to reach a new height in terms of accuracy and stability, providing a solid foundation for subsequent applications.
Based on the above analysis, we chose the optimal parameter for model training. The specific settings are as follows:
Data enhancement parameters:
Randomrotation: 10 degrees
Contrasttransform: 0.1
Brightnesstransform: 0.1
Model architecture parameters:
Network layer number (layers): 101 layer
Number of convolutional filters (NUM_FILTERS): 64
Stride: 2
Training parameters:
Batch_size: 30
Training cycle (EPOCHS): 30
Momentum: 0.9
Dropout rate: 0.5
Learning Rate: 0.01
Regularizing parameter: 0.01
Gaussian Noise Radius: 5
In the end, the final accuracy rate we get is: 0.9092, of which his Confusion Matrix and ROC CURVE are shown in the figure below:
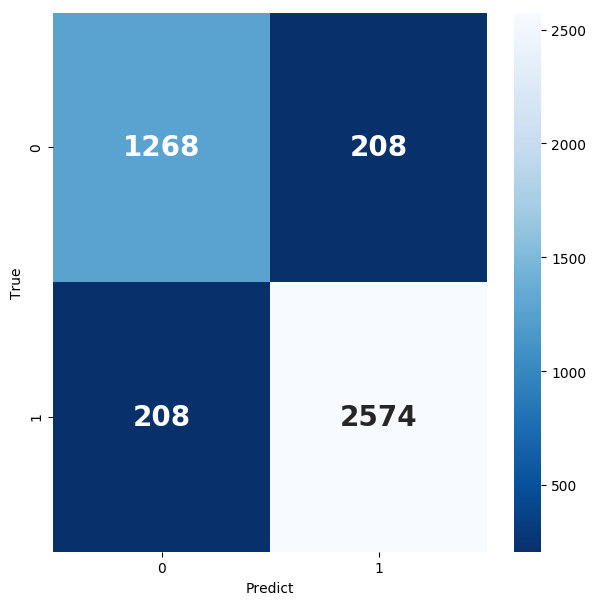
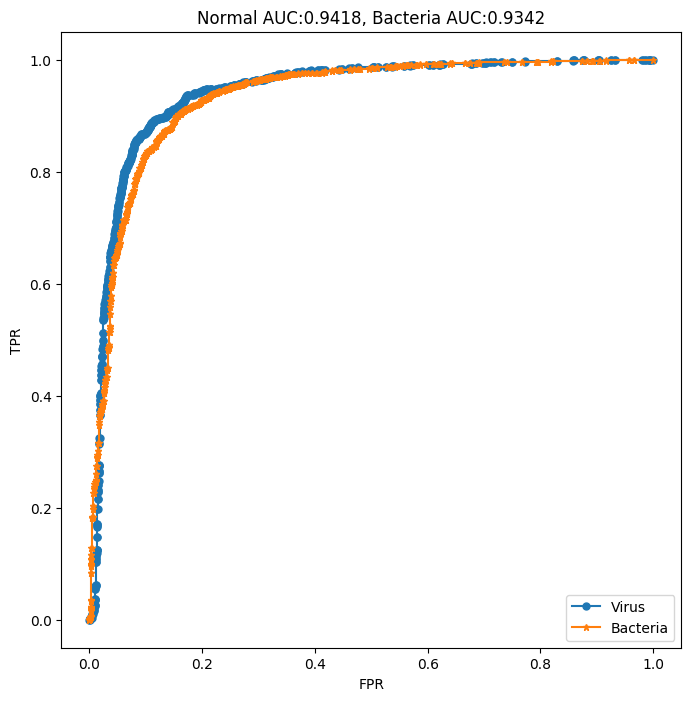
Figure 9. Confusion Matrix and ROC curve
5. Conclusion
In this research, we explored the effectiveness of a Residual Network (ResNet) in diagnosing lung diseases through the analysis of X-ray images. Our study focused on optimizing the ResNet model by performing sensitivity analysis, uncertainty quantification, and fine-tuning key model parameters.
Through sensitivity analysis, we identified the optimal rotation and noise augmentation settings, revealing that moderate enhancements significantly improve the model's generalization ability and robustness. Specifically, a rotation angle of 10 degrees and a low rotation probability (0.1) were found to be the most effective, while adding Gaussian noise also enhanced the model's performance in noisy environments.
For model structure and training parameters, we found that a ResNet model with 50 layers and 64 filters provided the best accuracy (0.807), indicating a balance between capturing essential features and avoiding overfitting. Smaller batch sizes (30) and fewer training epochs (30) also contributed to the model's stability and generalization ability.
Uncertainty quantification experiments revealed that a dropout rate of 0.5 resulted in the best performance across training loss, validation loss, and validation accuracy. This dropout rate effectively reduced overfitting while maintaining the model's expressive power, leading to a robust generalization on unseen data.
Overall, our findings suggest that a ResNet model with carefully tuned parameters, including a dropout rate of 0.5, provides a powerful tool for lung disease diagnosis. The model's accuracy and stability were significantly enhanced through a combination of data augmentation, noise addition, and optimal parameter settings. Future research should focus on expanding the dataset, improving model interpretability, and integrating additional medical data sources to further enhance diagnostic capabilities.
6. Discuss and work in the future
In this study, we conducted an uncertain quantitative and sensitive analysis of lung X -ray images to improve the accuracy and diagnosis of lung disease division. Through uncertain quantitative analysis, we effectively evaluate the confidence of model prediction. This provides doctors with confidence estimates about model prediction accuracy, helping doctors to better understand and evaluate the uncertainty of model prediction when making diagnostic decisions. We identify key factors affecting the output of model output through sensitivity analysis, including data enhancement parameters, model architecture parameters, and training parameters. It is found that moderate parameter settings can significantly improve the accuracy and robustness of the model. In the final experiment, we chose the optimal parameter settings and trained the Resnet model to reach the accuracy of 0.9092. This shows that our parameter settings and methods are effective in improving the accuracy and stability of the classification of lung X -ray image.
Although this study has achieved some results, there are still many aspects that need to be further explored and improved. The current data set used is still limited. In the future, you can consider introducing more X -ray images from different sources and different types of lung diseases to improve the generalization capacity of the model. Although we improve the performance of the model through uncertain quantitative and sensitive analysis, the interpretability of the model is still an important issue. Future research can explore more advanced explanatory models so that doctors can better understand the decision -making process of the model. In the future, you can explore X -ray images with other types of medical images (such as CT, MRI) or clinical data (such as patient history) to build a more comprehensive diagnostic model.
Acknowledgement
Yiwei Shen and Weiyu Sun contributed equally to this work and should be considered co-first authors.
References
[1]. Çallı, E., Sogancioglu, E., van Ginneken, B., van Leeuwen, K. G., & Murphy, K. (2021). Deep learning for chest X-ray analysis: A survey. Medical Image Analysis, 72, 102125.
[2]. Gomes J, Kong J, Kurc T, et al. Building robust pathology image analyses with uncertainty quantification[J]. Computer Methods and Programs in Biomedicine, 2021, 208: 106291.
[3]. Thirimanne H M, Jayawardena K, Parnell A J, et al. High sensitivity organic inorganic hybrid X-ray detectors with direct transduction and broadband response[J]. Nature Communications, 2018, 9(1): 2926.
[4]. Rahman T, Khandakar A, Kadir M A, et al. Reliable tuberculosis detection using chest X-ray with deep learning, segmentation and visualization[J]. Ieee Access, 2020, 8: 191586-191601.
[5]. Abdel-Basset M, Chang V, Mohamed R. HSMA_WOA: A hybrid novel Slime mould algorithm with whale optimization algorithm for tackling the image segmentation problem of chest X-ray images[J]. Applied soft computing, 2020, 95: 106642.
[6]. Oh Y, Park S, Ye J C. Deep learning COVID-19 features on CXR using limited training data sets[J]. IEEE transactions on medical imaging, 2020, 39(8): 2688-2700.
[7]. Krizhevsky A, Sutskever I, Hinton G E. Imagenet classification with deep convolutional neural networks[J]. Advances in neural information processing systems, 2012, 25.
[8]. Simonyan K, Zisserman A. Very deep convolutional networks for large-scale image recognition[J]. arXiv preprint arXiv:1409.1556, 2014.
[9]. Szegedy C, Liu W, Jia Y, et al. Going deeper with convolutions[C]//Proceedings of the IEEE conference on computer vision and pattern recognition. 2015: 1-9.
[10]. He K, Zhang X, Ren S, et al. Deep residual learning for image recognition[C]//Proceedings of the IEEE conference on computer vision and pattern recognition. 2016: 770-778.
[11]. Chollet F. Xception: Deep learning with depthwise separable convolutions[C]//Proceedings of the IEEE conference on computer vision and pattern recognition. 2017: 1251-1258.
[12]. Wang X, Peng Y, Lu L, et al. Chestx-ray8: Hospital-scale chest x-ray database and benchmarks on weakly-supervised classification and localization of common thorax diseases[C]//Proceedings of the IEEE conference on computer vision and pattern recognition. 2017: 2097-2106.
[13]. Loey M, Smarandache F, M. Khalifa N E. Within the lack of chest COVID-19 X-ray dataset: a novel detection model based on GAN and deep transfer learning[J]. Symmetry, 2020, 12(4): 651.
[14]. Pereira R M, Bertolini D, Teixeira L O, et al. COVID-19 identification in chest X-ray images on flat and hierarchical classification scenarios[J]. Computer methods and programs in biomedicine, 2020, 194: 105532.
[15]. Shrestha A, Mahmood A. Review of deep learning algorithms and architectures[J]. IEEE access, 2019, 7: 53040-53065.
[16]. Srivastava N, Hinton G, Krizhevsky A, et al. Dropout: a simple way to prevent neural networks from overfitting[J]. The journal of machine learning research, 2014, 15(1): 1929-1958.
Cite this article
Shen,Y.;Sun,W. (2024). Leveraging ResNet for Disease Detection: Uncertainty Quantification and Sensitivity Analysis in Lung X-ray Image Segmentation. Theoretical and Natural Science,67,215-227.
Data availability
The datasets used and/or analyzed during the current study will be available from the authors upon reasonable request.
Disclaimer/Publisher's Note
The statements, opinions and data contained in all publications are solely those of the individual author(s) and contributor(s) and not of EWA Publishing and/or the editor(s). EWA Publishing and/or the editor(s) disclaim responsibility for any injury to people or property resulting from any ideas, methods, instructions or products referred to in the content.
About volume
Volume title: Proceedings of the 4th International Conference on Biological Engineering and Medical Science
© 2024 by the author(s). Licensee EWA Publishing, Oxford, UK. This article is an open access article distributed under the terms and
conditions of the Creative Commons Attribution (CC BY) license. Authors who
publish this series agree to the following terms:
1. Authors retain copyright and grant the series right of first publication with the work simultaneously licensed under a Creative Commons
Attribution License that allows others to share the work with an acknowledgment of the work's authorship and initial publication in this
series.
2. Authors are able to enter into separate, additional contractual arrangements for the non-exclusive distribution of the series's published
version of the work (e.g., post it to an institutional repository or publish it in a book), with an acknowledgment of its initial
publication in this series.
3. Authors are permitted and encouraged to post their work online (e.g., in institutional repositories or on their website) prior to and
during the submission process, as it can lead to productive exchanges, as well as earlier and greater citation of published work (See
Open access policy for details).
References
[1]. Çallı, E., Sogancioglu, E., van Ginneken, B., van Leeuwen, K. G., & Murphy, K. (2021). Deep learning for chest X-ray analysis: A survey. Medical Image Analysis, 72, 102125.
[2]. Gomes J, Kong J, Kurc T, et al. Building robust pathology image analyses with uncertainty quantification[J]. Computer Methods and Programs in Biomedicine, 2021, 208: 106291.
[3]. Thirimanne H M, Jayawardena K, Parnell A J, et al. High sensitivity organic inorganic hybrid X-ray detectors with direct transduction and broadband response[J]. Nature Communications, 2018, 9(1): 2926.
[4]. Rahman T, Khandakar A, Kadir M A, et al. Reliable tuberculosis detection using chest X-ray with deep learning, segmentation and visualization[J]. Ieee Access, 2020, 8: 191586-191601.
[5]. Abdel-Basset M, Chang V, Mohamed R. HSMA_WOA: A hybrid novel Slime mould algorithm with whale optimization algorithm for tackling the image segmentation problem of chest X-ray images[J]. Applied soft computing, 2020, 95: 106642.
[6]. Oh Y, Park S, Ye J C. Deep learning COVID-19 features on CXR using limited training data sets[J]. IEEE transactions on medical imaging, 2020, 39(8): 2688-2700.
[7]. Krizhevsky A, Sutskever I, Hinton G E. Imagenet classification with deep convolutional neural networks[J]. Advances in neural information processing systems, 2012, 25.
[8]. Simonyan K, Zisserman A. Very deep convolutional networks for large-scale image recognition[J]. arXiv preprint arXiv:1409.1556, 2014.
[9]. Szegedy C, Liu W, Jia Y, et al. Going deeper with convolutions[C]//Proceedings of the IEEE conference on computer vision and pattern recognition. 2015: 1-9.
[10]. He K, Zhang X, Ren S, et al. Deep residual learning for image recognition[C]//Proceedings of the IEEE conference on computer vision and pattern recognition. 2016: 770-778.
[11]. Chollet F. Xception: Deep learning with depthwise separable convolutions[C]//Proceedings of the IEEE conference on computer vision and pattern recognition. 2017: 1251-1258.
[12]. Wang X, Peng Y, Lu L, et al. Chestx-ray8: Hospital-scale chest x-ray database and benchmarks on weakly-supervised classification and localization of common thorax diseases[C]//Proceedings of the IEEE conference on computer vision and pattern recognition. 2017: 2097-2106.
[13]. Loey M, Smarandache F, M. Khalifa N E. Within the lack of chest COVID-19 X-ray dataset: a novel detection model based on GAN and deep transfer learning[J]. Symmetry, 2020, 12(4): 651.
[14]. Pereira R M, Bertolini D, Teixeira L O, et al. COVID-19 identification in chest X-ray images on flat and hierarchical classification scenarios[J]. Computer methods and programs in biomedicine, 2020, 194: 105532.
[15]. Shrestha A, Mahmood A. Review of deep learning algorithms and architectures[J]. IEEE access, 2019, 7: 53040-53065.
[16]. Srivastava N, Hinton G, Krizhevsky A, et al. Dropout: a simple way to prevent neural networks from overfitting[J]. The journal of machine learning research, 2014, 15(1): 1929-1958.