


1. Introduction
The spinal cord, a crucial part of the central nervous system, serves a fundamental role in sensory processing and motor control (Sathyamurthy et al. 2018). It is primarily tasked with facilitating communication between the brain and the rest of the body. One of its key responsibilities is motor function, allowing us to move, maintain balance, and coordinate complex sequences of muscle contractions . In addition to motor control, the spinal cord is also essential for the processing of sensory information, such as touch, pain, and itch. It acts as a relay station, transmitting sensory information from the body to the brain, as well as carrying motor instructions from the brain to the body (Koch, Acton, and Goulding 2018; Courtney I. Dobrott et al. 2019). The damage to spinal cord will lead to a number of serious diseases. (Silva et al. 2014). Through these critical functions, the spinal cord enables us to interact with our environment effectively and respond to physical stimuli.
1.1. Anatomical structures of the spinal cord
The spinal cord, a critical component of the human central nervous system, possesses a complex anatomical structure designed to facilitate sophisticated information processing (Osseward and Pfaff 2019). The architecture of the spinal cord can be divided into three distinct regions: the dorsal, intermediate, and ventral portions. Each of these regions performs specific functions that contribute to our ability to interact with and respond to our environment. The dorsal region of the spinal cord primarily handles exteroceptive sensory processing. It serves as the main conduit for information about touch, temperature, and pain from the body's external environment, conveying these signals to the brain for interpretation and response. The ventral horn, on the other hand, is primarily responsible for motor execution. It contains motor neurons that relay commands from the brain to the muscles, thereby controlling voluntary movement and muscle coordination. This region is crucial for activities ranging from simple actions like walking to complex tasks that require precise motor control, such as playing a musical instrument. The intermediate region plays a vital role in integrating sensory input and motor output. It hosts a complex network of interneurons that process and integrate information from both the sensory and motor neurons. This integration allows for the coordination of complex responses and reflexes, providing a seamless connection between sensory perception and motor action. Together, these specialized regions of the spinal cord work in concert to facilitate our interactions with the world, enabling us to sense, respond to, and navigate our environment effectively.
Cell types in the spinal cord is heterogeneous. The spinal cord is made up of a variety of cell types that support its dysfunctional functions. It includes several classes of neurons, such as motor neurons, interneurons, and sensory neurons, as well as non-neuronal cells.(Rowitch and Kriegstein 2010)
1.2. Single cell RNA sequencing and its application in the mouse spinal cord
The single cell RNAseq would be the first time to allow to perform high-throughput sequencing of biological samples with single cell resolution. Single-cell sequencing technology has become a powerful tool to elucidate the heterogeneity of tissue cells, including the spinal cord. These technologies provide the ability to recognize and classify different cell types based on their unique gene expression patterns (Tang et al., 2009).
In a previous study, single nuclei RNA sequencing has been adopted to investigate the cell types in the spinal cord. They specifically sampled from the adult lumbar region of the mouse spinal cord and identified 43 neuronal populations. Meanwhile, they applied the sensory stimulation as well as other behavior stimulation to correlate the behavioral observation with the identified cell types in the mouse spinal cord (Anupama Sathyamurthy et al. 2018).
In this study, we analyzed the scRNA-seq data set of mouse spinal cord and identified several cell clusters, as well as their spatial localization. This work would provide a foundation for future investigation of the spinal cord function in a cell-type specific manner.
2. Results
2.1. Single cell sequencing done in mouse spinal cord
In this project, we used the data from this study (https://www.ncbi.nlm.nih.gov/geo/query/acc.cgi?acc=GSE103892), The dataset contains 18000 single cell RNA transcriptomic data from mouse spinal cord (Figure 1A). First, we visualized the top 20 highest expression genes in this dataset (Figure 1B). It shows the number of genes and the total counts. The genes that appear on this table indicate that these genes are widely distributed in cells, making it difficult to distinguish between different cell types as maker genes. Then we plot the number of genes per cell and total number of RNAs per cell, as well as the percentage of mitochondria related genes (Figure 1C). Then we further plot the relationship between total RNA counts versus the percentage of mitochondria related genes (Figure 1D), as well as the total RNA counts versus the genes number per cell (Figure 1E). Based on the total RNA counts versus the genes number per cell, we can see that the sequencing has been saturated.
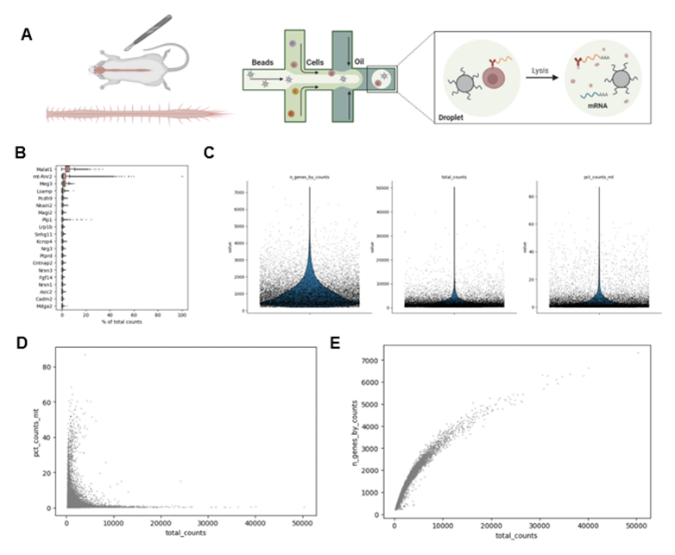
Figure 1. Quality control of the snRNAseq data from mouse spinal cord.
(A) Schematic drawing shows the dissection of mouse spinal cord.
(B) illustration shows the single cell RNA partitioning for single cell RNA sequencing.
(C) the number of genes per cell and total number of RNAs per cell, and the percentage of mitochondria related genes.
(D) raster plot shows the relationship between total RNA counts versus the percentage of mitochondria related genes.
(E) raster plot shows the relationship between total RNA counts versus the total genes counts for each cell.
2.2. Dimensional reduction and cell type clustering
Then we normalize the data set and also logarithmize the data. Then we identified the highly variable gene. Based on the highly variable gene, we further carried out principle component analysis (Figure 2A). Meanwhile, we obtained the pca variance ratio of all type of cells (Figure 2B). This gives us information about how many PCs we should consider in order to compute the neighborhood relations of cells. To visualize the high dimensional data, we adopted the UMAP plot (Figure 2C-E).
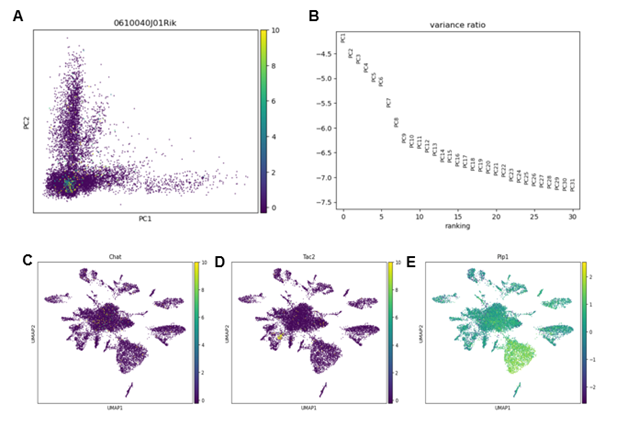
Figure 2. Dimensional reduction and clustering
(A) the pca graph of all type of cells
(B) the pca variance ratio of all type of cells
(C) the umap of all type of cells with the gene “chat” in color
(D) the umap of all type of cells with the gene “Tac2” in color
(E) the umap of all type of cells with the gene “Plp1” in color
2.3. Identification of marker genes for all cell types
We further perform leiden clustering and obtained 23 clusters of cells (Figure 3A). Based on the identified cluster, we used t-test to identify the marker genes for all the cell clusters in this whole dataset (Figure 3B). We found that for neuronal populations, it has high level expression of Snap25, Syp, Rbfox3, Snhg11. For Oligo populations, it has high level expression of Mbp, Mobp, Mog, Plp1. For Astrocyte populations, it has high level expression of Aqp4, Atp1a2, Gja1, Slc1a2. For Menin populations, it has high level expression of Dcn, Col3a1. For Microg populations, it has high level expression of Ctss, Itgam, Ptprc. For OPC populations, it has high level expression of Cspg4, Gpr17, Pdgfra. For Schw populations, it has high expression of Mbp, Mpz, Prx. For Vascular populations, it has high level expression of Flt1, pecam1, Tek.
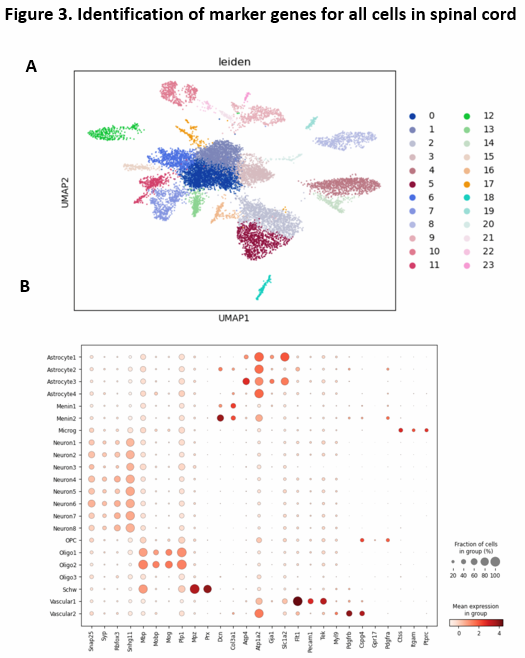
Figure 3. Identification of maker genes for all cell types.
(A) the UMAP plot with leiden identity of all type of cells. It shows that there exist 23 different cluters for all type of cells.
(B) the dot graph shows the differential expression of identified markers genes for all types of cells.
2.4. Investigation of the spatial distribution of identified marker genes
The spatial information of specific genes could offer insight to interpret the contribution of specific cells in the spinal cord circuit processing. Now we have obtained the genetic marker genes for each cell type in the mouse spinal cord. Using the Allen Spinal Cord ISH database, we further investigate the spatial distribution of the all the identified marker genes (Figure 4A-B). Based on the observations, we found that there are multiple genes shows spatial specificity, for example, Rora is denser in the dorsal spinal cord, while the Mbp is ventral specific. The spatial divergent properties of these genes might indicate their functional differences as well.
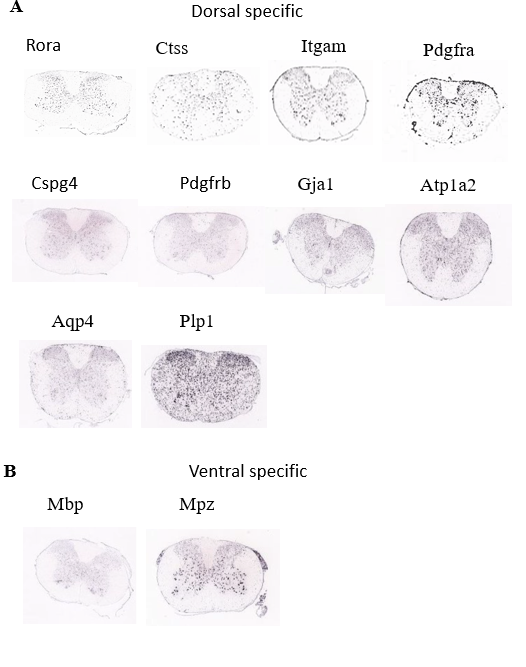
Figure 4. Spatial distribution pattern of identified marker genes of all cells population.
(A) Spatial distribution of the dorsal specific genes
(B) Spatial distribution of the ventral specific genes
2.5. Identification of marker genes for neuronal
For neuronal population, we use leiden and npy clusting. This diagram by leiden shows that there are seventeen clusters in neuronal cells, which is a lot. (Figure 5A-B) For neuronal population, there are a lot of genes that have a higher proportion. But some of these genes are widespread in cells and cannot be considered as specific genes. So, the maker genes are Grn28928, Plp1, Rnf220, Slc24a2, Fam19a1, Cped1, Cfap46, Tsh2, Trpm3, Gabrg3, Sorcs1, Hs3st5, Arpp21, Pd2d2. (Figure 5C)
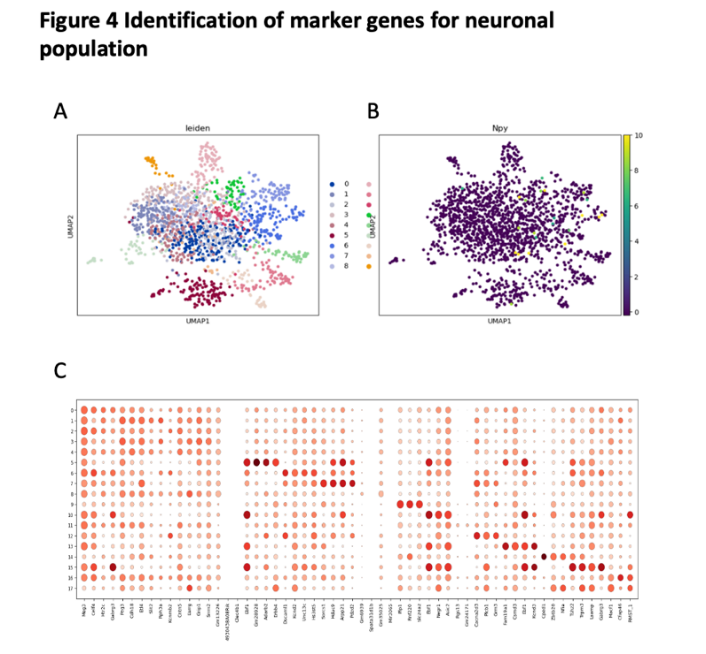
Figure 5. identification of maker genes for neuronal population
(A) the UMAP plot with leiden identity of neuronal population. It shows that there exist 8 different cluters for neuronal population.
(B) the UMAP plot with Npy identity of neuronal population. It shows that there exist 8 different cluters for neuronal population.
(C) the dot graph shows the differential expression of identified markers genes for neuronal population.
2.6. Investigation of the spatial distribution of identified marker genes
By looking at the spatial distribution for neuronal population, we get some dorsal specific genes like Gabrag3 and Arpp21. (Figure 6A) Also we found some ventral specific genes like Slc24a2. (Figure 6B)
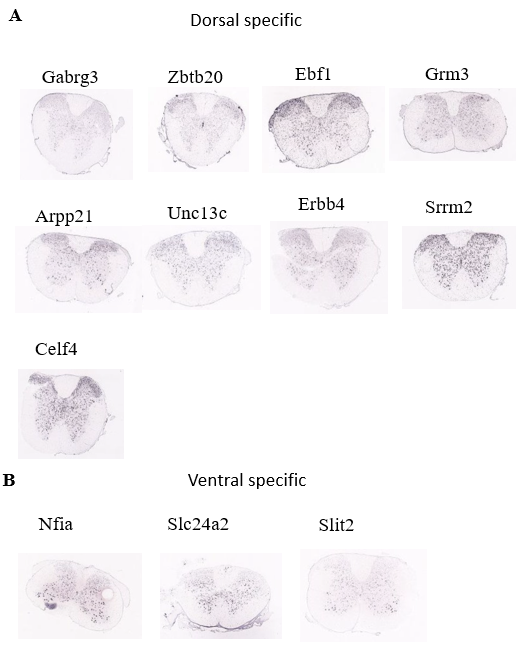
Figure 6. Spatial distribution pattern of identified marker genes of neuronal population.
(A) Spatial distribution of the dorsal specific genes of neuronal population
(B) Spatial distribution of the ventral specific genes of neuronal population
2.7. Identification of marker genes for Oligo
The Umap graph with leiden color shows we have 14 different clusters. (Figure 7A) We use t-test to identify the marker genes for Oligo population. We found there have fourteen different clusters in the Oligo population. The marker genes for Oligo population including Mpz, Ankfn1, Utrn, Slc1a2, Gpc5, Gm42495. (Figure 7B) If considers that maker genes are best represented, rather than widely distributed, then maker genes are Gm42495, Gpc5, Utm, Ankfn1, Mpz.
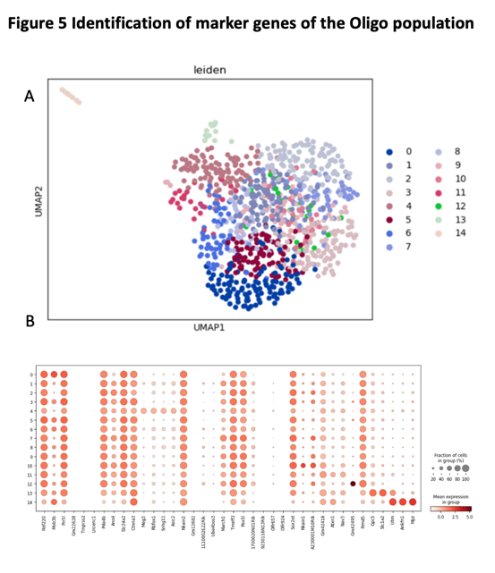
Figure 7. Identification of maker genes of the oligo population
(A) the UMAP plot with leiden identity of Oligo population. It shows that there exist 8 different cluters for Oligo population.
(B) the dot graph shows the differential expression of identified markers genes for Oligo population.
2.8. Investigation of the spatial distribution of identified marker genes
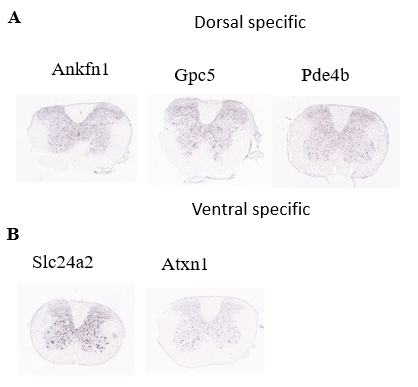
Figure 8. Investigation of spatial distribution pattern of identified marker genes of Oligo population.
(A) Spatial distribution of the dorsal specific genes of Oligo population
(B) Spatial distribution of the ventral specific genes of Oligo population
2.9. Identification of marker genes for Schw
we use t-test to identify the marker genes for Schw population. We found there have eleven different clusters in the Schw population. The marker genes for Schw population including Cfap100, Rnf220, Fam1786, Sptbn5, Gm36356.
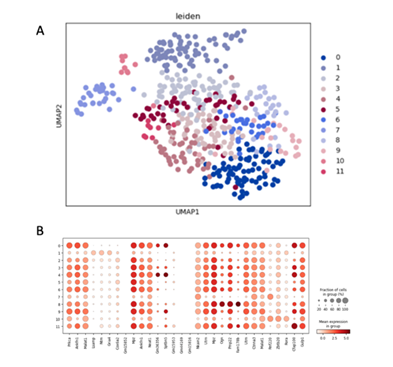
Figure 9. Identification of marker genes of the Schw population
(A) the UMAP plot with leiden identity of Schw population. It shows that there exist 8 different cluters for Schw population.
(B) the dot graph shows the differential expression of identified markers genes for Schw population.
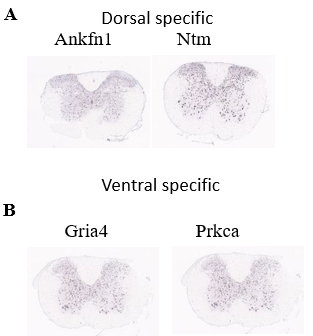
Figure 9. Investigation of spatial distribution pattern of identified marker genes of Schw population.
(A) Spatial distribution of the dorsal specific genes of Schw population
(B) Spatial distribution of the ventral specific genes of Schw population
2.10. Identification of marker genes for Menin
We use t-test to identify the marker genes for Menin population. We found there have five different clusters in the Menin population. The marker genes for Menin population including Cemip, Cfh, Scara5, Mid1, Slit2, Slc47a1, Slc4a10.
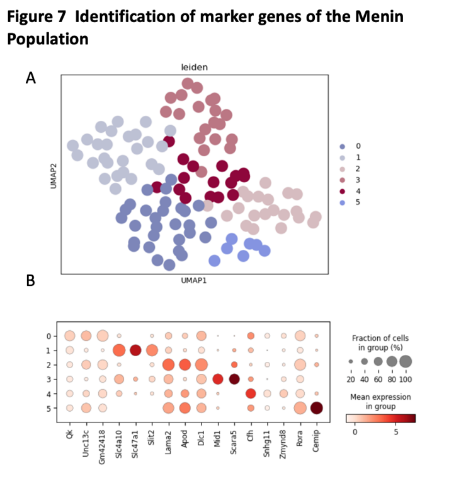
Figure 10. Identification of marker genes of the Menin population
(A) the UMAP plot with leiden identity of Menin population. It shows that there exist 8 different cluters for Menin population.
(B) the dot graph shows the differential expression of identified markers genes for Menin population.
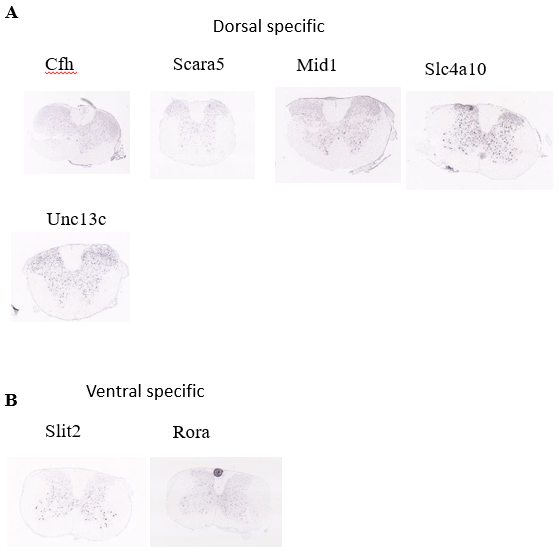
Figure 11. Investigation of spatial distribution pattern of identified marker genes of Menin population.
(A) Spatial distribution of the dorsal specific genes of Menin population
(B) Spatial distribution of the ventral specific genes of Menin population
2.11. Identification of marker genes for Astrocyte
We use t-test to identify the marker genes for Astrocyte population. We found there have eleven different clusters in the Astrocyte population. The marker genes for Astrocyte population including Gm6260, Fbx17, Nr3c2, Pmp22, Pdzrn3, Cped1, Rgs5
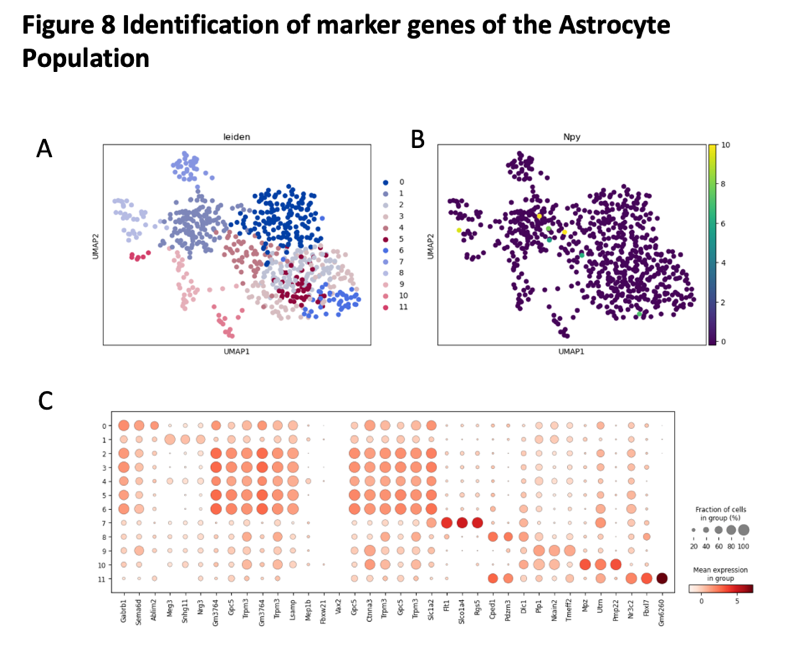
Figure 12. Identification of marker genes of the Astrocyte population
(A) the UMAP plot with leiden identity of Astrocyte population. It shows that there exist 8 different cluters for Astrocyte population.
(B) the UMAP plot with Npy identity of Astrocyte population. It shows that there exist 8 different cluters for Astrocyte population.
(C) the dot graph shows the differential expression of identified markers genes for Astrocyte population.
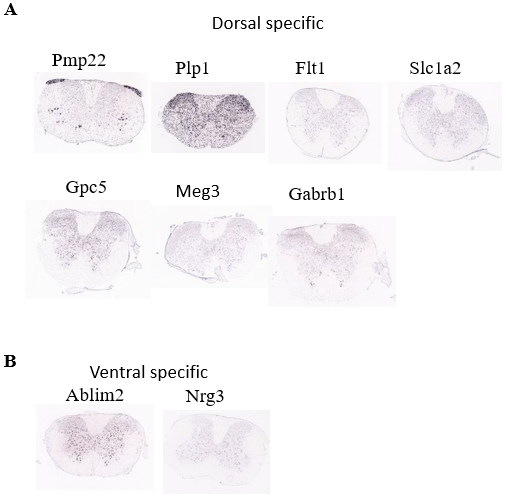
Figure 13. Investigation of spatial distribution pattern of identified marker genes of Astrocyte population.
(A) Spatial distribution of the dorsal specific genes of Astrocyte population
(B) Spatial distribution of the ventral specific genes of Astrocyte population
2.12. Identification of marker genes for Vascular
we use t-test to identify the marker genes for Vascular population. We found there have nine different clusters in the Vascular population. The marker genes for Vascular population including Utrn, Pecam1.
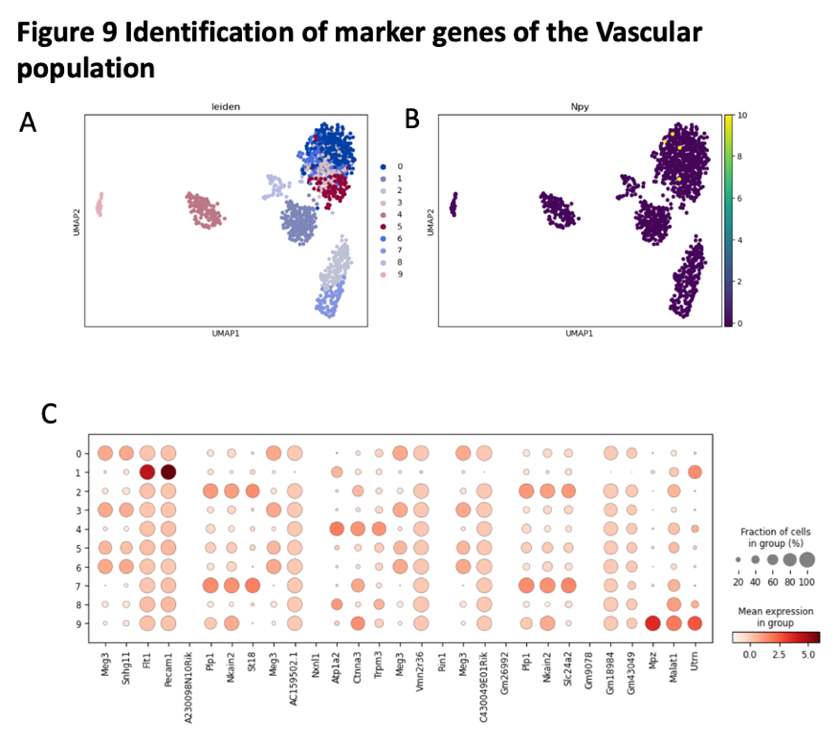
Figure 14. Identification of maker genes of the Vascular population
(A) the UMAP plot with leiden identity of Vascular population. It shows that there exist 8 different cluters for Vascular population.
(B) the UMAP plot with Npy identity of Vascular population. It shows that there exist 8 different cluters for Vascular population.
(C) the dot graph shows the differential expression of identified markers genes for Vascular population.
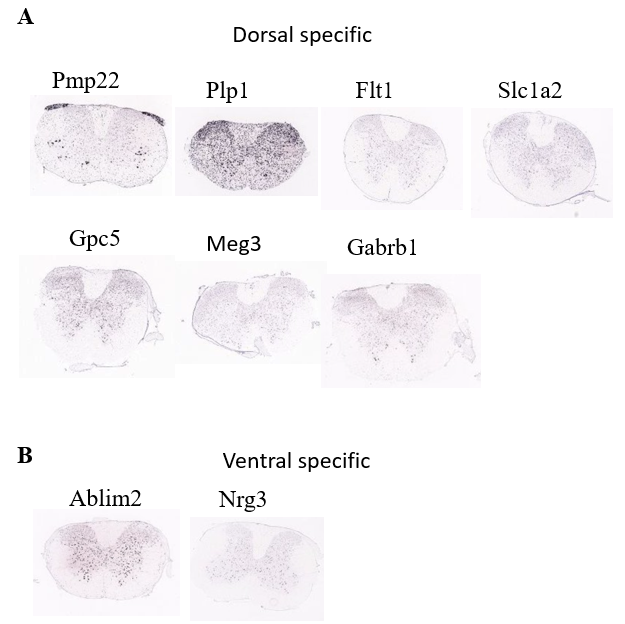
Figure 15. Investigation of spatial distribution pattern of identified marker genes of Astrocyte population.
(A) Spatial distribution of the dorsal specific genes of Vascular population
(B) Spatial distribution of the ventral specific genes of Vascular population
2.13. Identification of marker genes for Microg
0-8 represent different subclusters further clustered within the microglia population. The x axis represents the list of identified marker genes. Hue represents the mean expression level and size of the dot represents the fraction of cells in the total population.
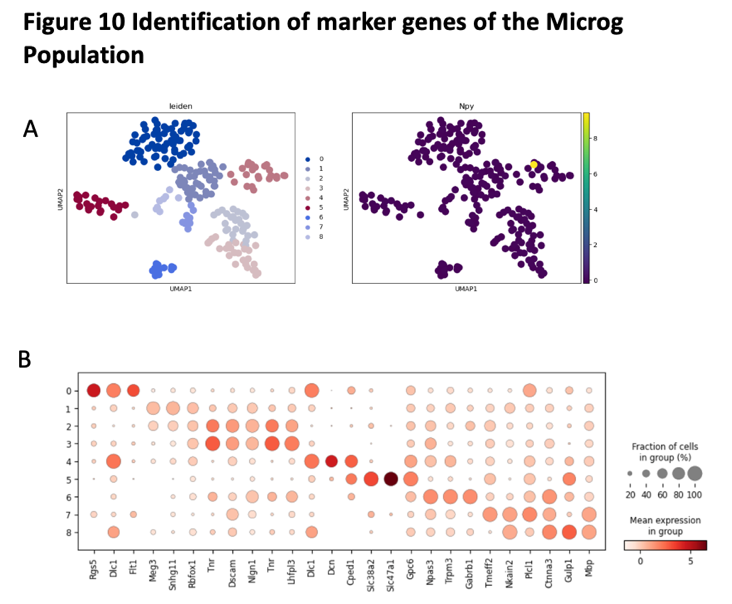
Figure 16. Identification of maker genes of the Microg population
(A) the UMAP plot with leiden identity of Microg population. It shows that there exist 8 different cluters for Microg population.
(B) the UMAP plot with Npy identity of Microg population. It shows that there exist 8 different cluters for Microg population.
(C) the dot graph shows the differential expression of identified markers genes for Microg population.
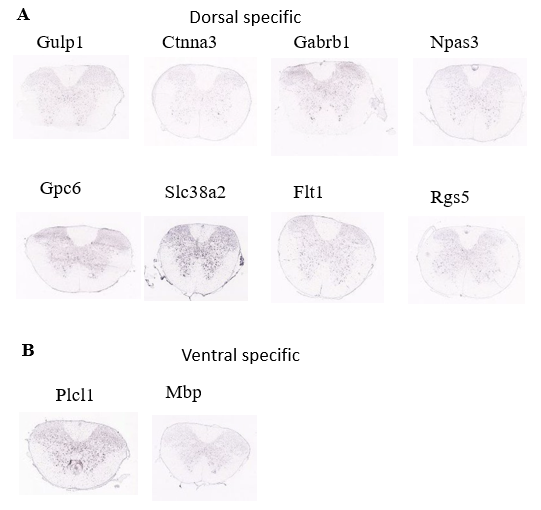
Figure 17. the UMAP plot with leiden identity of Microg population.
(A) Spatial distribution of the dorsal specific genes of Opc population
(B) Spatial distribution of the ventral specific genes of Opc population
We use t-test to identify the marker genes for Micreg population. We found there have eight different clusters in the Micreg population. The marker genes for Micreg population including Gulp1, Gpc6, Slc38a2, Slc47a1, Drn, Tur, Rgs5.
3. Discussion
3.1. Identified marker genes of spinal cord clusters
In this study, we have identified specific marker genes of spinal cord cells (detailed marker gene list could be found in supplementary table 1). In the meantime, we investigated their spatial distribution pattern and revealed that some specific clusters exhibit preference towards either dorsal or ventral part of the spinal cord. We believe the identified marker genes as well as the spatial distribution pattern could help us understand better on the cellular diversity underlying complex functions mediated by spinal cord circuits.
3.2. Known Cell types in the spinal cord.
Canonical approaches to investigate the cell types in the spinal is through either morphology, location, physiology, connectivity, molecular markers, developmental lineage or behavior (Osseward and Pfaff 2019)
In the dorsal region of the spinal cord, several molecularly defined cell types has been reported. For example, nuclear orphan receptor transcription factor (RORa) expressing cells in the spinal cord are excitatory neurons that located in the laminae I-III. They can receive direct innervation from the a low-threshold mechanoreceptor (LTMRs), they exhibit specific function in both dynamic and static touch, supported by the evidence that genetic ablation of RORa interneurons would cause deficit in both touch sensation(Steeve Bourane et al. 2015). Meanwhile, RORa neurons directly innervate premotor and motor neurons and its ablation would result in foot movement degradation in mice (Bourane et al. 2015).
References
[1]. Anupama Sathyamurthy, Anupama Sathyamurthy, Kory R. Johnson, Kaya J.E. Matson, Courtney I. Dobrott, Li Li, Li Li, et al. 2018. “Massively Parallel Single Nucleus Transcriptional Profiling Defines Spinal Cord Neurons and Their Activity during Behavior.” Cell Reports. https://doi.org/10.1016/j.celrep.2018.02.003.
[2]. Barry, Devin M., Xueting Liu, Xue-Ting Liu, Xue Ting Liu, Ben-Long Liu, Xian-Yu Liu, Xian-Yu Liu, et al. 2020. “Exploration of Sensory and Spinal Neurons Expressing Gastrin-Releasing Peptide in Itch and Pain Related Behaviors.” Nature Communications 11 (1): 1397. https://doi.org/10.1038/s41467-020-15230-y.
[3]. Bourane, Steeve, Katja S. Grossmann, Olivier Britz, Antoine Dalet, Marta Garcia Del Barrio, Floor J. Stam, Lidia Garcia-Campmany, Stephanie C. Koch, Stephanie C. Koch, and Martyn Goulding. 2015. “Identification of a Spinal Circuit for Light Touch and Fine Motor Control.” Cell 160 (3): 503–15. https://doi.org/10.1016/j.cell.2015.01.011.
[4]. Courtney I. Dobrott, Anupama Sathyamurthy, Anupama Sathyamurthy, Ariel J. Levine, and Ariel J. Levine. 2019. “Decoding Cell Type Diversity within the Spinal Cord.” Current Opinion in Physiology. https://doi.org/10.1016/j.cophys.2018.11.006.
[5]. Koch, Stephanie C., David Acton, and Martyn Goulding. 2018. “Spinal Circuits for Touch, Pain, and Itch.” Annual Review of Physiology 80 (1): 189–217. https://doi.org/10.1146/annurev-physiol-022516-034303.
[6]. Martin Häring, Amit Zeisel, Hannah Hochgerner, Puneet Rinwa, Puneet Rinwa, Jon E. T. Jakobsson, Peter Lönnerberg, et al. 2018. “Neuronal Atlas of the Dorsal Horn Defines Its Architecture and Links Sensory Input to Transcriptional Cell Types.” Nature Neuroscience. https://doi.org/10.1038/s41593-018-0141-1.
[7]. Osseward, Peter J, and Samuel L Pfaff. 2019. “Cell Type and Circuit Modules in the Spinal Cord.” Current Opinion in Neurobiology 56 (June): 175–84. https://doi.org/10.1016/j.conb.2019.03.003.
[8]. Rowitch, David H., and Arnold R. Kriegstein. 2010. “Developmental Genetics of Vertebrate Glial-Cell Specification.” Nature 468 (7321): 214–22. https://doi.org/10.1038/nature09611.
[9]. Sathyamurthy, Anupama, Anupama Sathyamurthy, Kory R. Johnson, Kaya J.E. Matson, Courtney I. Dobrott, Li Li, Li Li, et al. 2018. “Massively Parallel Single Nucleus Transcriptional Profiling Defines Spinal Cord Neurons and Their Activity during Behavior.” Cell Reports 22 (8): 2216–25. https://doi.org/10.1016/j.celrep.2018.02.003.
[10]. Silva, Nuno A., Nuno Sousa, Rui L. Reis, and António J. Salgado. 2014. “From Basics to Clinical: A Comprehensive Review on Spinal Cord Injury.” Progress in Neurobiology 114 (March): 25–57. https://doi.org/10.1016/j.pneurobio.2013.11.002.
[11]. Steeve Bourane, Katja S. Grossmann, Olivier Britz, Antoine Dalet, Marta Garcia Del Barrio, Floor J. Stam, Lidia Garcia-Campmany, Stephanie C. Koch, Stephanie C. Koch, and Martyn Goulding. 2015. “Identification of a Spinal Circuit for Light Touch and Fine Motor Control.” Cell. https://doi.org/10.1016/j.cell.2015.01.011.
Cite this article
Feng,X. (2025). Identification of cell types in the mouse spinal cord based on single cell RNA sequencing. Theoretical and Natural Science,73,159-171.
Data availability
The datasets used and/or analyzed during the current study will be available from the authors upon reasonable request.
Disclaimer/Publisher's Note
The statements, opinions and data contained in all publications are solely those of the individual author(s) and contributor(s) and not of EWA Publishing and/or the editor(s). EWA Publishing and/or the editor(s) disclaim responsibility for any injury to people or property resulting from any ideas, methods, instructions or products referred to in the content.
About volume
Volume title: Proceedings of the 4th International Conference on Biological Engineering and Medical Science
© 2024 by the author(s). Licensee EWA Publishing, Oxford, UK. This article is an open access article distributed under the terms and
conditions of the Creative Commons Attribution (CC BY) license. Authors who
publish this series agree to the following terms:
1. Authors retain copyright and grant the series right of first publication with the work simultaneously licensed under a Creative Commons
Attribution License that allows others to share the work with an acknowledgment of the work's authorship and initial publication in this
series.
2. Authors are able to enter into separate, additional contractual arrangements for the non-exclusive distribution of the series's published
version of the work (e.g., post it to an institutional repository or publish it in a book), with an acknowledgment of its initial
publication in this series.
3. Authors are permitted and encouraged to post their work online (e.g., in institutional repositories or on their website) prior to and
during the submission process, as it can lead to productive exchanges, as well as earlier and greater citation of published work (See
Open access policy for details).
References
[1]. Anupama Sathyamurthy, Anupama Sathyamurthy, Kory R. Johnson, Kaya J.E. Matson, Courtney I. Dobrott, Li Li, Li Li, et al. 2018. “Massively Parallel Single Nucleus Transcriptional Profiling Defines Spinal Cord Neurons and Their Activity during Behavior.” Cell Reports. https://doi.org/10.1016/j.celrep.2018.02.003.
[2]. Barry, Devin M., Xueting Liu, Xue-Ting Liu, Xue Ting Liu, Ben-Long Liu, Xian-Yu Liu, Xian-Yu Liu, et al. 2020. “Exploration of Sensory and Spinal Neurons Expressing Gastrin-Releasing Peptide in Itch and Pain Related Behaviors.” Nature Communications 11 (1): 1397. https://doi.org/10.1038/s41467-020-15230-y.
[3]. Bourane, Steeve, Katja S. Grossmann, Olivier Britz, Antoine Dalet, Marta Garcia Del Barrio, Floor J. Stam, Lidia Garcia-Campmany, Stephanie C. Koch, Stephanie C. Koch, and Martyn Goulding. 2015. “Identification of a Spinal Circuit for Light Touch and Fine Motor Control.” Cell 160 (3): 503–15. https://doi.org/10.1016/j.cell.2015.01.011.
[4]. Courtney I. Dobrott, Anupama Sathyamurthy, Anupama Sathyamurthy, Ariel J. Levine, and Ariel J. Levine. 2019. “Decoding Cell Type Diversity within the Spinal Cord.” Current Opinion in Physiology. https://doi.org/10.1016/j.cophys.2018.11.006.
[5]. Koch, Stephanie C., David Acton, and Martyn Goulding. 2018. “Spinal Circuits for Touch, Pain, and Itch.” Annual Review of Physiology 80 (1): 189–217. https://doi.org/10.1146/annurev-physiol-022516-034303.
[6]. Martin Häring, Amit Zeisel, Hannah Hochgerner, Puneet Rinwa, Puneet Rinwa, Jon E. T. Jakobsson, Peter Lönnerberg, et al. 2018. “Neuronal Atlas of the Dorsal Horn Defines Its Architecture and Links Sensory Input to Transcriptional Cell Types.” Nature Neuroscience. https://doi.org/10.1038/s41593-018-0141-1.
[7]. Osseward, Peter J, and Samuel L Pfaff. 2019. “Cell Type and Circuit Modules in the Spinal Cord.” Current Opinion in Neurobiology 56 (June): 175–84. https://doi.org/10.1016/j.conb.2019.03.003.
[8]. Rowitch, David H., and Arnold R. Kriegstein. 2010. “Developmental Genetics of Vertebrate Glial-Cell Specification.” Nature 468 (7321): 214–22. https://doi.org/10.1038/nature09611.
[9]. Sathyamurthy, Anupama, Anupama Sathyamurthy, Kory R. Johnson, Kaya J.E. Matson, Courtney I. Dobrott, Li Li, Li Li, et al. 2018. “Massively Parallel Single Nucleus Transcriptional Profiling Defines Spinal Cord Neurons and Their Activity during Behavior.” Cell Reports 22 (8): 2216–25. https://doi.org/10.1016/j.celrep.2018.02.003.
[10]. Silva, Nuno A., Nuno Sousa, Rui L. Reis, and António J. Salgado. 2014. “From Basics to Clinical: A Comprehensive Review on Spinal Cord Injury.” Progress in Neurobiology 114 (March): 25–57. https://doi.org/10.1016/j.pneurobio.2013.11.002.
[11]. Steeve Bourane, Katja S. Grossmann, Olivier Britz, Antoine Dalet, Marta Garcia Del Barrio, Floor J. Stam, Lidia Garcia-Campmany, Stephanie C. Koch, Stephanie C. Koch, and Martyn Goulding. 2015. “Identification of a Spinal Circuit for Light Touch and Fine Motor Control.” Cell. https://doi.org/10.1016/j.cell.2015.01.011.