


1. Introduction
In the field of mining exploitation, tailings ponds are crucial facilities for storing waste materials from ore screening, preventing environmental pollution, and saving ground space [1-2]. However, tailings ponds pose significant potential hazards, such as geological disasters caused by landslides or dam failures [1]. Traditional ground subsidence monitoring methods like precise leveling and GPS have limitations in coverage and practical application [3]. InSAR technology, especially D-InSAR, offers advantages like all-weather operation and high spatial resolution [4-6]. Yet, it suffers from issues like spatio-temporal decorrelation and atmospheric effects [7]. Time-series InSAR, such as SBAS-InSAR, has been developed to overcome these defects, improving data acquisition, coverage, accuracy, and efficiency [8]. This paper focuses on the tailings pond of the Baizhangzi Gold Mine and the adjacent collapsed area, using SBAS-InSAR technology to study mining region subsidence and deformation, analyzing the ground subsidence rate and time-series deformation results, and exploring influencing factors.
2. Methodology
Using SBAS-InSAR methodology with Sentinel-1 time-series images for large-scale deformation monitoring in tailings ponds and mining areas. This technique, based on distributed scatterer characteristics, enhances traditional InSAR by implementing small baseline subsets to mitigate atmospheric and topographic effects. The process involves spatiotemporal baseline threshold, coherent point selection, and singular value decomposition for accurate deformation time-series analysis. SBAS-InSAR's matrix-based solution approach, combined with phase velocity calculations and atmospheric delay compensation, enables precise surface displacement measurements in challenging terrain conditions.
3. Study area and Sar data processing
Baizhangzi Au mine, situated at the Hebei-Liaoning border, represents a magmatic-hydrothermal system hosted within granitic intrusions. The mine exhibits NE-NNE trending quartz-vein and altered-rock mineralization across 14 production levels, with current development reaching -150m depth. The study focuses on two critical zones: the three-sided mountainous tailings impoundment with SE dam and the adjacent subsidence zone resulting from underground shaft mining operations. The analysis utilized 31 Sentinel-1 IW SLC datasets (Orbit 171) from ASF, split into two temporal sequences: Jan- Jul 2022 (n=15) and Nov 2022- May 2023 (n=16), due to the acquisition gap.
4. Results and analysis
4.1. Analysis of subsidence in the surrounding area of the mining zone
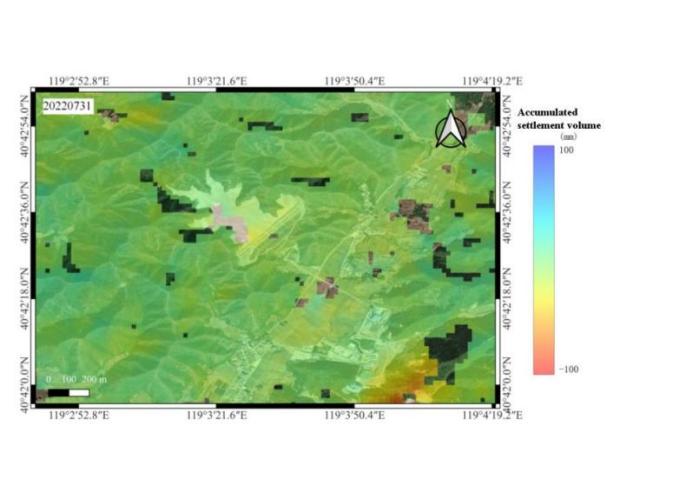
Figure 1: Data of tailings pond dry beach (group 1, 2022.1.8~2022.7.31)
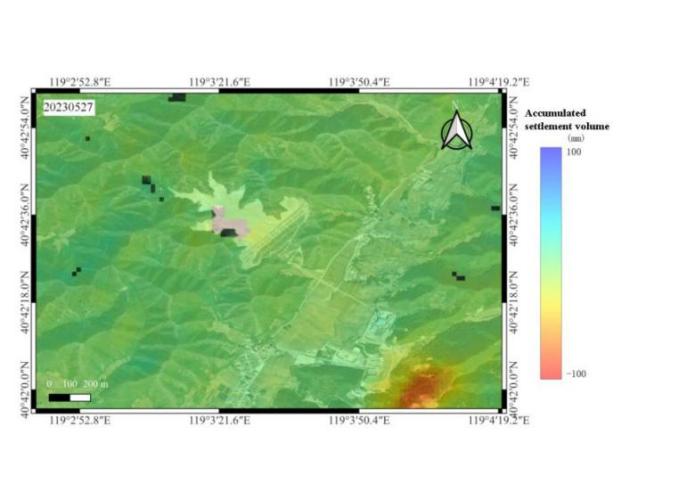
Figure 2: Data of tailings pond dry beach (group 2, 2022.11.4~2023.5.27)
Analysis of InSAR data (Figure1&2) reveals minor subsidence (-10mm) around the tailings pond dry beach, except for significant displacement in the SE region. The central subsidence zone shows progressive deformation from minimal to severe, with maximum vertical displacements of -100mm and -75mm in the respective monitoring periods. Both displacement patterns exhibit NE-trending deformation, with peripheral areas showing negligible subsidence (-10mm), indicating stable conditions.
4.2. Analysis of tailings pond and surrounding areas
4.2.1. Analysis of slope and aspect
DEM data shows the non-negligible impact on the Analysis of slope and aspect. Due to temporal discrepancies, legacy DEM produced significant topographical errors. Current slope and aspect analyses utilize point-cloud data from UAV surveys conducted in June 2023.
Slope analysis reveals steep terrain surrounding the dry beach area. Aspect distribution shows diverse orientations, all except southeast, indicating mountainous topography. Southeast exhibits alternating linear patterns characteristic of dam structures. The dry beach, composed of ore tailings and water, demonstrates a low gradient and uniform aspect (-1), confirming its fluid nature and planar surface. These topographical analyses validate the tailings pond's morphological characteristics.
4.2.2. Analysis of cumulative subsidence and subsidence rate
To conduct a more detailed study on the subsidence in the area surrounding the tailings pond, points were selected on the satellite images of the tailings pond. Two parallel profiles (AA', BB') were established on the dam, and in Figure 4, the equidistant sampling points on them were marked by squares and rhombuses, respectively. Concentric circles C and D were drawn around the dry-beach area, with points 5-9 (triangular markers) and 11-14 (circular markers) sampled at equal angular intervals. Point 10 was excluded due to agricultural interference. Cumulative subsidence was calculated for both measurement groups.
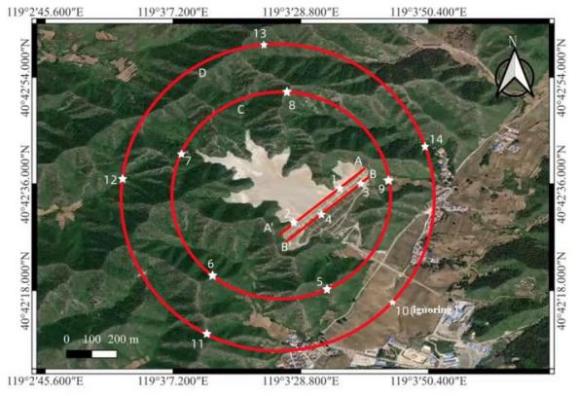
Figure 3: Feature point selection of the tailings pond and its surrounding areas
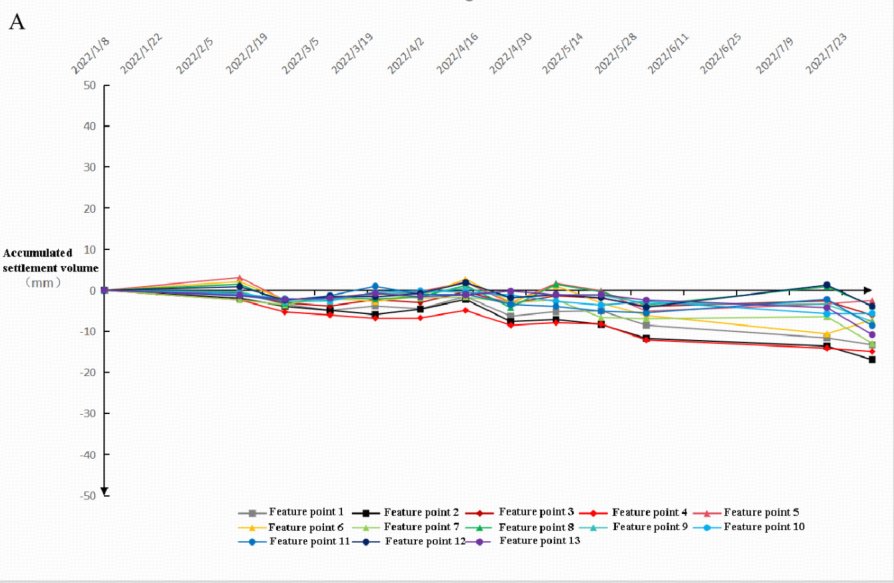
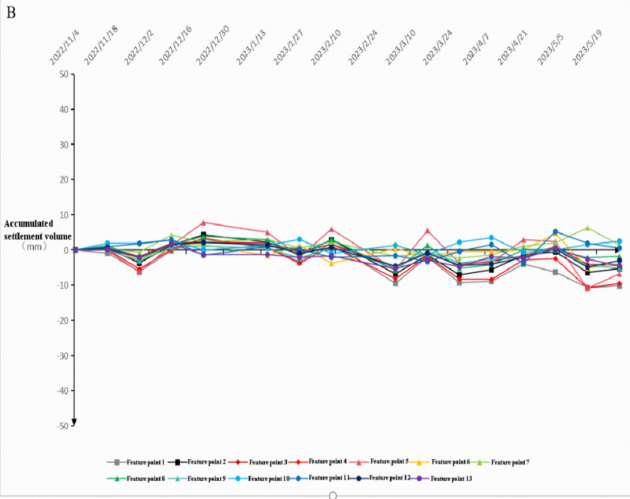
Figure 4: Subsidence analysis of the tailings pond and its surrounding areas. Fig. A shows the first set of data, and Fig. B shows the second set of data
Based on subsidence data, both periods show minimal settlement: Group 1 ranges from +5 to -20mm, Group 2 from +10 to -15mm. Some points exhibit uplift rather than settlement, likely due to measurement noise. Overall, tailings pond subsidence is minimal. Points 1, 2, and 4 on the dam exhibit accelerated settlement rates, suggesting minor dam deformation. Points 7 and 11 showed increased subsidence during the Nov 2022- May 2023 monitoring period (Figure 4).
4.3. Analysis of the collapse region and surrounding areas
4.3.1. Analysis of slope and aspect
Analysis of slope patterns reveals critical instability, with gradient intensification from moderate to severe, culminating in near-vertical escarpments. The alternating directional patterns, predominantly NE-NNE oriented, coupled with debris accumulation characteristics, strongly indicate subsurface mining-induced collapse phenomena.
4.3.2. Analysis of cumulative subsidence and subsidence rate
Three parallel transects (Figure 5) were established across the collapse zone using satellite imagery and SAR data. Nine monitoring points were selected equidistantly along these transects to measure subsidence. Points 1-3 are marked with circles, 4-6 with rhombuses, and 7-9 with squares. The cumulative subsidence data from the first two monitoring periods follows.
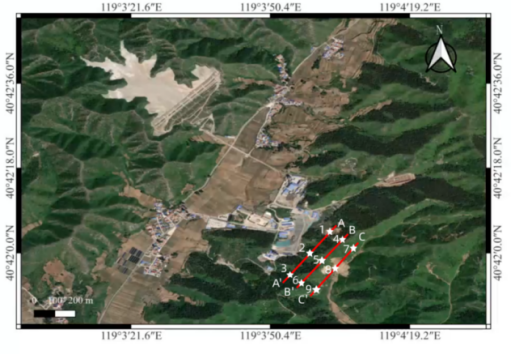
Figure 5: Feature point selection of the collapse region and surrounding areas
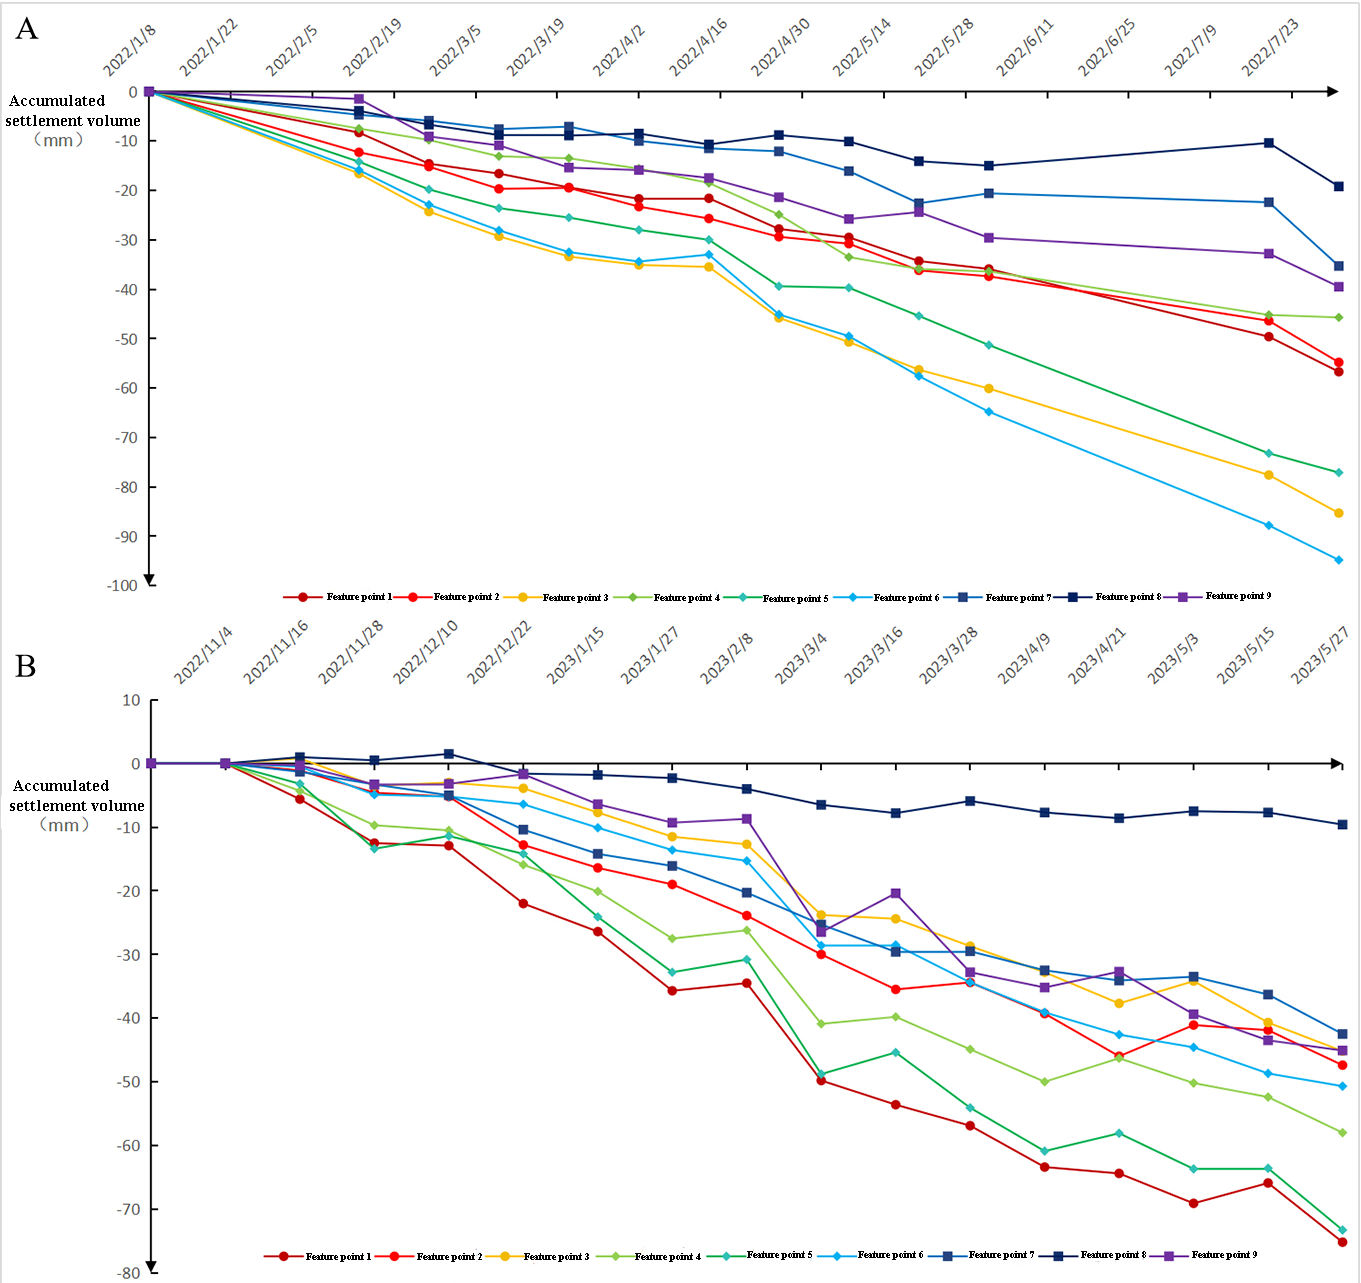
Figure 6: Subsidence analysis of the collapse region and surrounding areas; Fig. A shows the first set of data, and Fig. B shows the second set of data
Statistical analysis (Figure 6) reveals continuous subsidence across all 9 monitoring points, with cumulative displacement of -20 to -100mm and -10 to -80mm over two periods. Maximum subsidence occurred along profiles AA' and BB', while Point 8 showed minimal displacement. Topographic gradient analysis from AA' to CC' indicates occasional upward displacement at lower elevations, attributable to either debris accumulation or measurement noise.
The rates of the characteristic points within the two groups of periods will be statistically analyzed below.
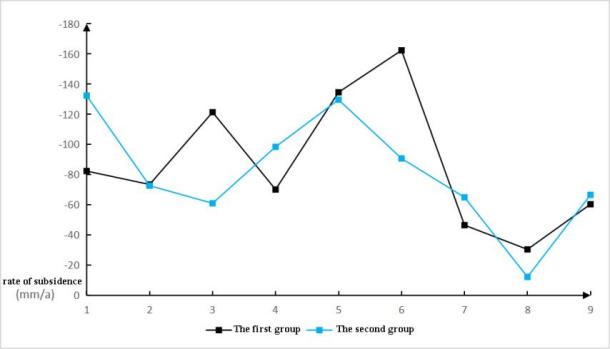
Figure 7: Subsidence rate statistics of two groups of feature points in the subsidence area
Surface subsidence rates vary across the collapse zone, with Point 6 exhibiting maximum velocity at -162 mm/a (Jan- Jul 2022), while Point 8 shows minimal displacement (Figure 7).
4.4. Analysis of influencing factors
The Baizhangzi Gold Mine site, situated in southwest Liaohe Plain (<50m elevation), experiences temperate continental monsoon conditions. NASA data indicates significant precipitation variability during the monitoring period. Both natural factors and anthropogenic activities contribute to the observed land subsidence patterns (Figure 8).
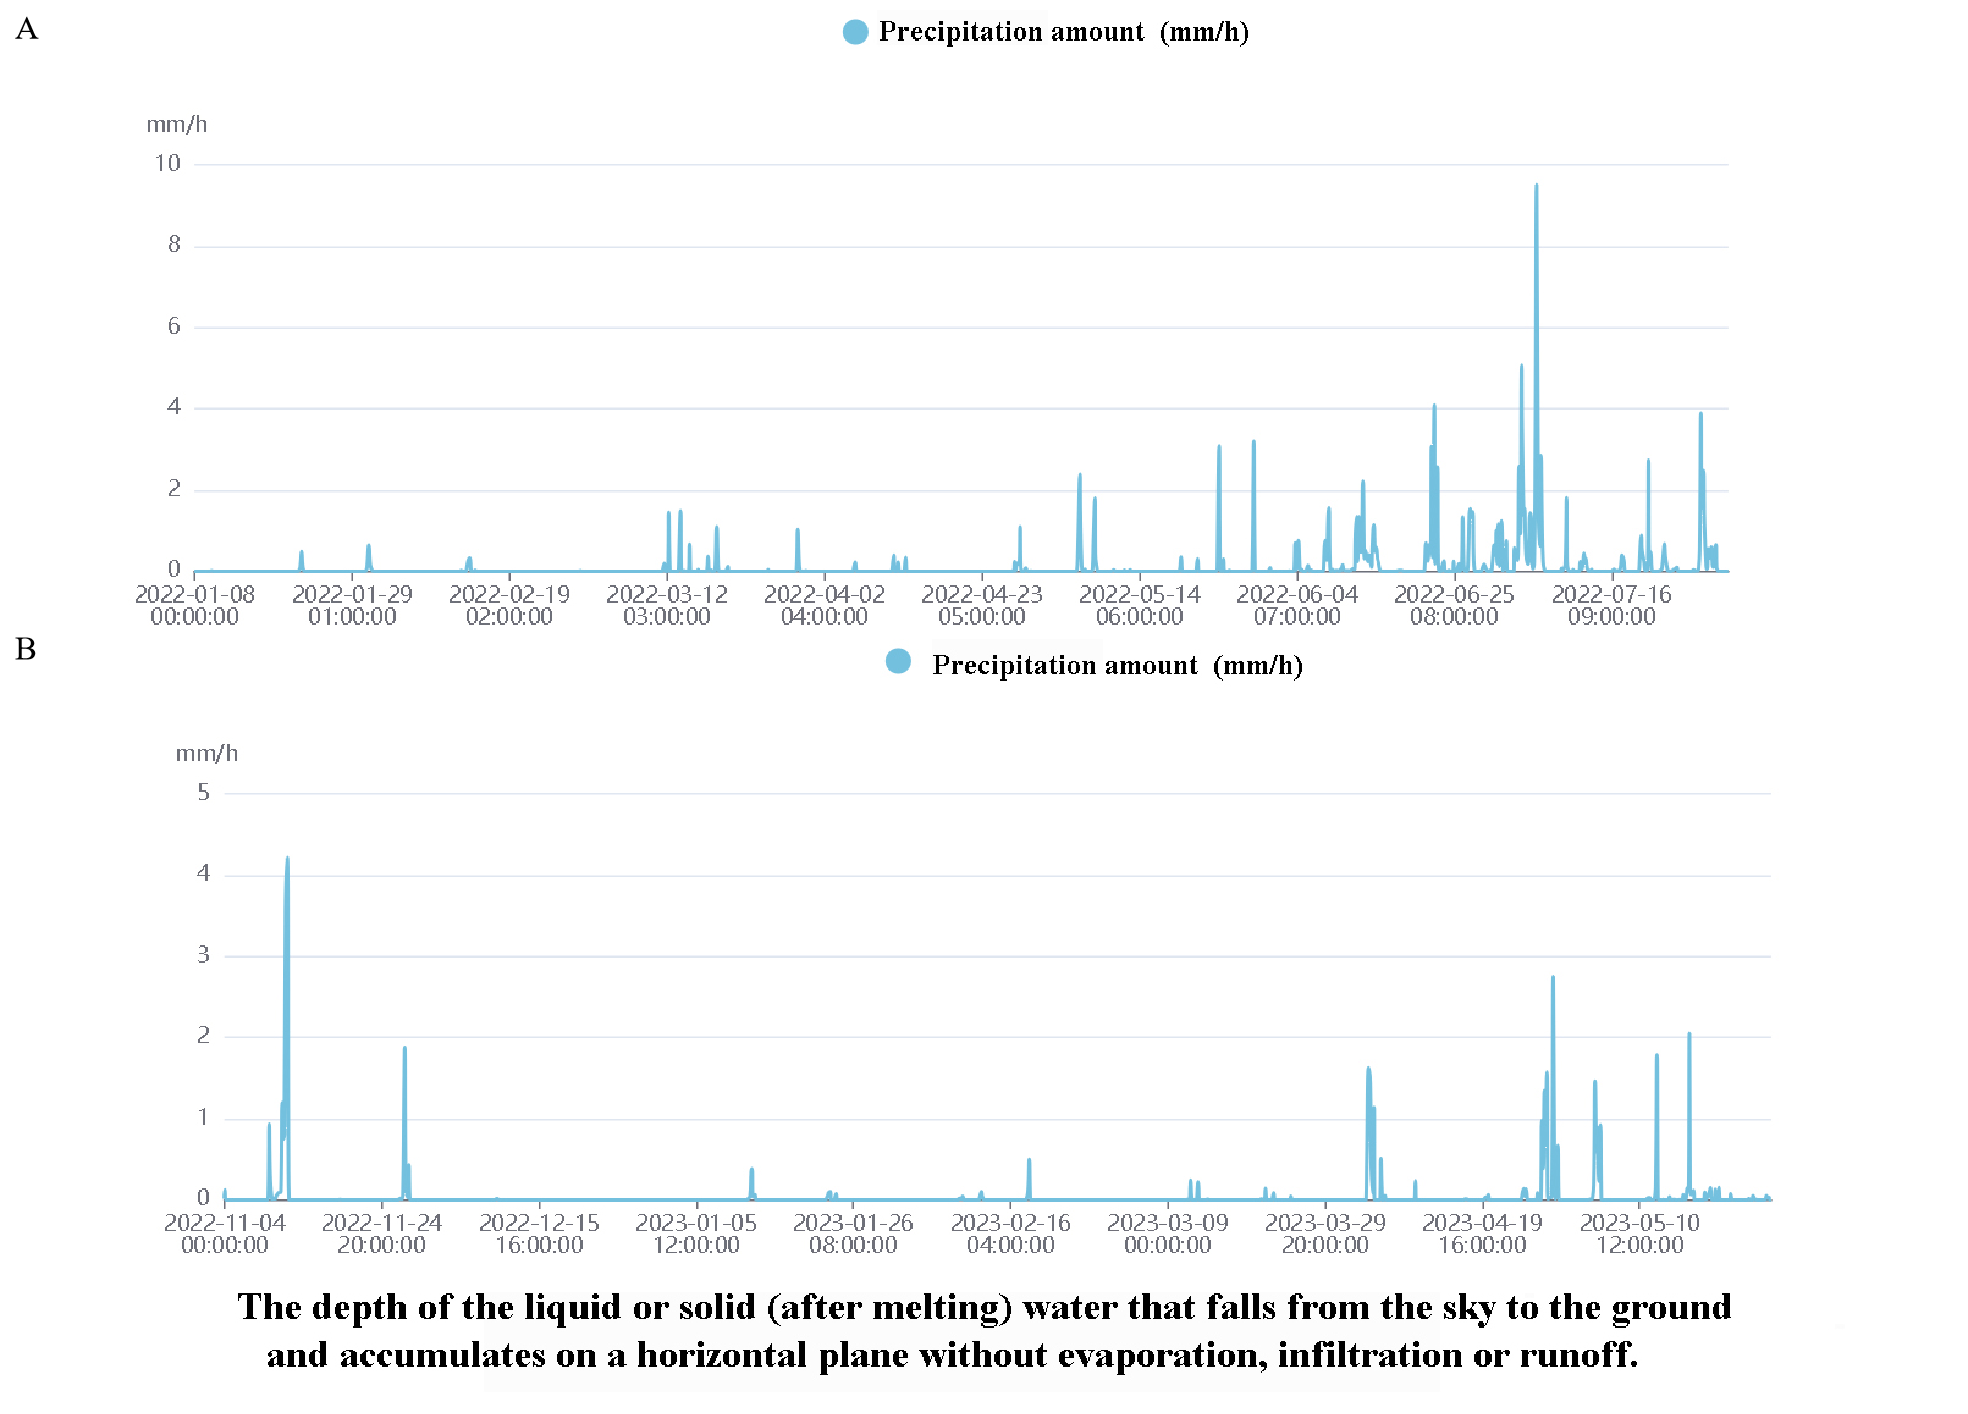
Figure 8: Precipitation of the mining region; Fig. A shows the data from January 8, 2022, to July 31, 2022, and Fig. B shows the data from November 4, 2022, to May 27, 2023
Evaluate the geological influence on land subsidence, focusing on geological elements. The Baizhangzi Gold Mine area primarily consists of altered rocks, including auriferous veined quartzite and gneissic granite. The slow weathering and erosion processes preclude significant changes within the two-year monitoring period. Our team's field investigations reveal that the vegetation around the tailings pond is robust, with minimal soil erosion observed. Consequently, natural factors like precipitation and wind are unlikely to contribute to land subsidence in this region. As an underground mining site, vertical shafts are excavated to access gold, necessitating extensive roadway construction at various depths. The extraction process involves lifting personnel, ores, and equipment through these shafts. Notably, the collapse trend aligns with the ore body's NE-NNE distribution, indicating that artificial underground mining is the primary cause of subsidence in this area.
5. Conclusion
In the subsidence monitoring of the mining region, there are often many uncertain factors. Due to the failure to conduct on-site subsidence investigations, the experimental results may have some deviations. Therefore, in order to minimize the deviations, the following conclusions are drawn in combination with the specific experimental results. The main factor causing the subsidence in this mining region is artificial underground mining, and the influence of the natural environment is not significant. Subsidence in the tailings pond and surrounding area during the two monitoring periods ranged from 5 to -20 mm and 10 to -15 mm, respectively. Overall, subsidence is minimal, and the slope of the tailings pond remains stable. Several characteristic points with relatively fast subsidence rates are all located on the dam, indicating that there is slight subsidence of the dam. The subsidence situations of the collapse area during the two monitoring periods are approximately -20 to -100 mm and - 10 to - 80 mm, respectively. The subsidence rates of the characteristic points on the profile lines AA’ and BB’ are relatively fast, indicating that it is possible that the selected characteristic points are located in the center of the underground mining region. Significant subsidence occurs following extensive ore extraction, leading to the formation of voids. When counting the cumulative subsidence and subsidence rate of the two areas in the mining region, a small number of characteristic points show an upward trend instead of a downward trend. Since the natural conditions have little influence on this mining region, this situation is likely caused by noise.
References
[1]. Shi Jingye, Zhu Longwen, Fan Nannan, Zhang Wei & Song Qifan. (2021). Construction and Functions of the Space-Air-Ground Integrated Tailings Pond Supervision Platform. Satellite Application, (06), 37-41.
[2]. Han Yong, Liu Guangchun, Liu Jie, Yang Jun, Xie Xiangcheng,..., & Zhang Wenzhi. (2023). Ground Subsidence Monitoring and Analysis in Jiaozuo City (China) Based on SBAS-InSAR Technology. Sustainability, 15(15), 11737.
[3]. Lv Zhou, Guo Jiming, Jiyuan Hu, Li Jiangwei, Yongfeng Xu,..., &Shi Miao. (2017). Wuhan Surface Subsidence Analysis in 2015-2016 Based on Sentinel-1A Data by SBAS-InSAR. REMOTE SENSING, 9(10),982.
[4]. Hui Liu, Zhou Bochen, Zechao Bai, Zhao Wenfei, Mengyuan Zhu, &Geshuang Li. (2023). Applicability Assessment of Multi-Source DEM-Assisted InSAR Deformation Monitoring Considering Two Topographical Features. LAND, 12(7),1284.
[5]. Tao Changxu, Zhang Yongshuang & Ren Sanshao. (2025). Research Progress on the Application of InSAR Technology in Landslide Identification and Monitoring. Geology in China, 1-16.
[6]. Kalavrezou Ioanna Efstathia, Castro Melgar Ignacio, Nika Dimitra, Gatsios Theodoros, Spyros Lalechos, &Parcharidis Issaak. (2024). Application of Time Series INSAR (SBAS) Method Using Sentinel-1 for Monitoring Ground Deformation of the Aegina Island (Western Edge of Hellenic Volcanic Arc). LAND, 13(4),485.
[7]. P. Tizzani, Berardino P., F. Casu, P. Euillades, Manzo M., &Lanari R. (2007). Surface deformation of Long Valley caldera and Mono Basin, California, investigated with the SBAS-InSAR approach. REMOTE SENSING OF ENVIRONMENT, 108(3),277-289.
[8]. Baohang Wang, Zhao Chaoying, Qin Zhang, Zhong Lu, Li Zhenhong, &Liu Yuanyuan. (2020). Sequential Estimation of Dynamic Deformation Parameters for SBAS-InSAR. IEEE GEOSCIENCE&REMOTE SENSING LETTERS, 17(6),1017-1021.
Cite this article
Yu,D. (2025). Monitoring of Ground Deformation in Mining Region Based on Time-series InSAR. Theoretical and Natural Science,112,159-164.
Data availability
The datasets used and/or analyzed during the current study will be available from the authors upon reasonable request.
Disclaimer/Publisher's Note
The statements, opinions and data contained in all publications are solely those of the individual author(s) and contributor(s) and not of EWA Publishing and/or the editor(s). EWA Publishing and/or the editor(s) disclaim responsibility for any injury to people or property resulting from any ideas, methods, instructions or products referred to in the content.
About volume
Volume title: Proceedings of ICEGEE 2025 Symposium: Sensor Technology and Multimodal Data Analysis
© 2024 by the author(s). Licensee EWA Publishing, Oxford, UK. This article is an open access article distributed under the terms and
conditions of the Creative Commons Attribution (CC BY) license. Authors who
publish this series agree to the following terms:
1. Authors retain copyright and grant the series right of first publication with the work simultaneously licensed under a Creative Commons
Attribution License that allows others to share the work with an acknowledgment of the work's authorship and initial publication in this
series.
2. Authors are able to enter into separate, additional contractual arrangements for the non-exclusive distribution of the series's published
version of the work (e.g., post it to an institutional repository or publish it in a book), with an acknowledgment of its initial
publication in this series.
3. Authors are permitted and encouraged to post their work online (e.g., in institutional repositories or on their website) prior to and
during the submission process, as it can lead to productive exchanges, as well as earlier and greater citation of published work (See
Open access policy for details).
References
[1]. Shi Jingye, Zhu Longwen, Fan Nannan, Zhang Wei & Song Qifan. (2021). Construction and Functions of the Space-Air-Ground Integrated Tailings Pond Supervision Platform. Satellite Application, (06), 37-41.
[2]. Han Yong, Liu Guangchun, Liu Jie, Yang Jun, Xie Xiangcheng,..., & Zhang Wenzhi. (2023). Ground Subsidence Monitoring and Analysis in Jiaozuo City (China) Based on SBAS-InSAR Technology. Sustainability, 15(15), 11737.
[3]. Lv Zhou, Guo Jiming, Jiyuan Hu, Li Jiangwei, Yongfeng Xu,..., &Shi Miao. (2017). Wuhan Surface Subsidence Analysis in 2015-2016 Based on Sentinel-1A Data by SBAS-InSAR. REMOTE SENSING, 9(10),982.
[4]. Hui Liu, Zhou Bochen, Zechao Bai, Zhao Wenfei, Mengyuan Zhu, &Geshuang Li. (2023). Applicability Assessment of Multi-Source DEM-Assisted InSAR Deformation Monitoring Considering Two Topographical Features. LAND, 12(7),1284.
[5]. Tao Changxu, Zhang Yongshuang & Ren Sanshao. (2025). Research Progress on the Application of InSAR Technology in Landslide Identification and Monitoring. Geology in China, 1-16.
[6]. Kalavrezou Ioanna Efstathia, Castro Melgar Ignacio, Nika Dimitra, Gatsios Theodoros, Spyros Lalechos, &Parcharidis Issaak. (2024). Application of Time Series INSAR (SBAS) Method Using Sentinel-1 for Monitoring Ground Deformation of the Aegina Island (Western Edge of Hellenic Volcanic Arc). LAND, 13(4),485.
[7]. P. Tizzani, Berardino P., F. Casu, P. Euillades, Manzo M., &Lanari R. (2007). Surface deformation of Long Valley caldera and Mono Basin, California, investigated with the SBAS-InSAR approach. REMOTE SENSING OF ENVIRONMENT, 108(3),277-289.
[8]. Baohang Wang, Zhao Chaoying, Qin Zhang, Zhong Lu, Li Zhenhong, &Liu Yuanyuan. (2020). Sequential Estimation of Dynamic Deformation Parameters for SBAS-InSAR. IEEE GEOSCIENCE&REMOTE SENSING LETTERS, 17(6),1017-1021.