


1. Introduction
1.1. Problem background
The Olympics serve as a global sporting pinnacle, reflecting national capabilities in economic development, strategic resource allocation, and athlete development. Modern medal rankings encapsulate socio-economic factors beyond medal counts, necessitating systematic medal distribution analysis to identify high-impact resource deployment strategies. Contemporary sports governance increasingly employs data-driven frameworks to optimize high-yield disciplines and athlete pathways, enabling nations to maximize medal yields. This evolution underscores the need for scientific methodologies to convert athletic potential into measurable global competitive advantages.
1.2. Restatement of the problem
This study employs a random forest model (91\% cross-validation accuracy) to predict 2028 Olympic medals using historical data on medal trends, host nations, events, and athlete performance [1,2]. The model outperforms logistic regression (65\%), excelling in capturing nonlinear resource allocation dynamics. Key predictors include targeted discipline development and athlete training quality, with five countries (Papua New Guinea, Madagascar, Gambia, Maldives, Guinea) identified as persistently medal-less. Core factors—host advantage, elite coaching, and national infrastructure—are analyzed alongside supplementary variables (athlete physiology, funding, audience engagement) [3,4]. Results demonstrate that strategic investments in high-impact disciplines and shared training facilities drive medal surges, offering policymakers pathways to optimize resource allocation for under-resourced nations through talent development programs and performance-based incentives.
2. Data overview
2.1. Data analysis
This study analyzes historical athlete data (nation events medals)from "summerOly_athletes.csv", identifying 83 medal-less countries (e.g., PNG, Madagascar, Gambia). A random forest classifier predicts the likelihood of these nations securing their first medal at the 2028 Olympics. The methodology defines "valid sports" as events common to both the 2028 Los Angeles program ("sports 2028") and the preceding five Games ("recent years"), excluding non-overlapping disciplines to ensure predictive relevance. This approach focuses strategic analysis on sustained Olympic events to enhance forecast reliability [5,6].
2.2. Data pre-processing
|
Former |
Description |
Glossary |
|
Total event |
Number of Olympic events participated in |
TE |
|
People |
Number of participating athletes |
POP |
|
AD rate |
Proportion of dominant events |
ADR |
|
Total Medals per people |
Total medals per athlete |
TMP |
3. Model establishment
Random Forest is an ensemble learning system that utilizes decision trees. It integrates decision trees, constructed from individual characteristics derived from the table, to forecast various feature combinations, so creating a robust learner that enhances overall model performance and stability. This approach is appropriate for predicting the country that will secure the first medal. Prior to constructing a random forest model, we must adequately preprocess the data:
• Extract the information about the country and medals, filter the data from the past five Olympic Games, count the number of medals won by each country, and mark whether they have won medals or not. And the average number of medals won in the past five Olympic Games is more than 30\% as an advantage in the competition, which is put into the model as a feature to predict the probability of winning medals for countries that have not won medals.
• Features such as the number of times a country has participated, the number of people who have participated, and the diversity of the events entered are extracted. At the same time, the number of medals each country has won in each event is calculated as a percentage of the total number of medals in that event, as well as the number of weighted dominant events.
• The feature data is standardized so that each feature has the same scale, using the following formula:
The scaled data is divided into a training set and a test set, with the test set accounting for 20%.
The final category of a sample is then determined using a "majority vote" strategy by combining the predictions of multiple decision trees. The following is the core formula for building a random forest model:
After training using the training set, the output model weights each feature during training. The feature weight indicates the importance of the feature in the model decision. The feature weight is calculated as follows:
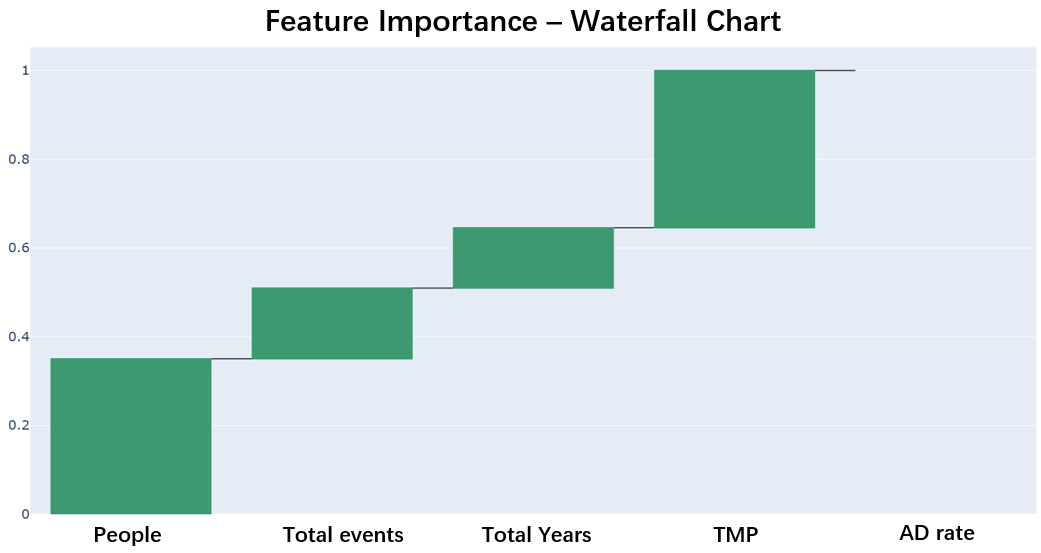
In Figure 1, using labels from Table 1, a waterfall chart illustrates the significance of various features to the model, which is beneficial in data analysis and machine learning for discerning which features exert a bigger influence on the outcomes. The x-axis, progressing from left to right, comprises five features: People (POP), Total Events (aggregate number of events), Total Years (cumulative number of years), TMP (mean medal percentage), and AD Rate (weighted advantage event rate). The y-axis denotes the numerical value of feature importance, spanning from 0 to 1, where a greater value indicates a feature's increased significance. Each feature is represented by a green rectangular bar, with the height of the bar directly indicating the feature's relevance score.
The figure 1 specifies the following weights: People (POP) at 0.3503, Total Events at 0.1595, Total Years at 0.1358, TMP at 0.3544, and AD Rate at 0. Among these, TMP (0.3544) is the most influential feature, followed by POP (0.3503), Total Events (0.1595), and Total Years (0.1358), with their importance ratings diminishing in succession. The AD Rate is unequivocally zero for the analyzed countries, as they have never secured a medal; consequently, this feature is not utilized in predictions for these nations but is reserved for calculating the medal likelihood of countries that have achieved medal success.
The random forest classifier is ultimately evaluated using the test set, and the model's accuracy and classification report are computed. The accuracy is determined using the accompanying formula:
|
Class |
Precision |
Recall |
F1-score |
Accuracy |
|
Random Forest |
0.93 |
0.91 |
0.92 |
0.91 |
|
Logistic Regression |
0.81 |
0.72 |
0.65 |
0.65 |
Table 2 shows that the random forest model outperforms the logistic regression model in predicting the country's first medal. This is because logistic regression has limitations when dealing with multi-feature high-dimensional data: too many features can lead to overfitting, while too few features can lead to insufficient accuracy, and it is difficult to automatically screen for valuable features. In contrast, random forests can reduce the risk of overfitting by randomly selecting feature subsets and can automatically assess feature importance, thereby more accurately predicting the probability of winning medals in each event.
4. Results analysis
The model uses cross-validation to evaluate the confidence of the model. The accuracy of the model on different subsets is calculated, and then the average is taken as the confidence of the model. The formula is as follows:
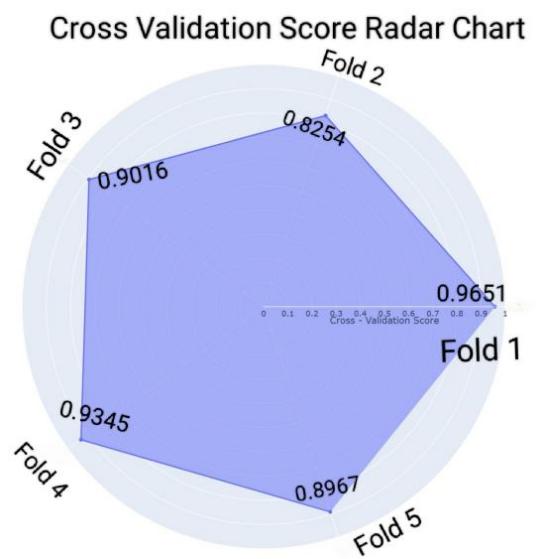
The Figure 2 shows a circle with a scale from 0 to 1, representing the cross-validation score. The higher the score, the better the model performance. The circle is divided into five sectors, corresponding to the fold scores of Fold 1 to Fold 5. The distance from the apex of each sector to the center indicates the score of the corresponding fold. Fold 1 has a score of 0.9651, which is closest to 1, indicating that the model performs best under this fold. Fold 2 has the lowest score of 0.8254, indicating that the model performs stably under different data set divisions and has good overall performance.
Based on the trained model, the statistics of countries that have not yet won a medal are calculated and the probability of winning a medal in 2028 is predicted. The output predicts the countries that will win their first medal and their probability, as well as a list of countries that will still not have won their first medal in 2028. The following are the five countries with the highest predicted probability of winning their first gold medal and their probabilities:
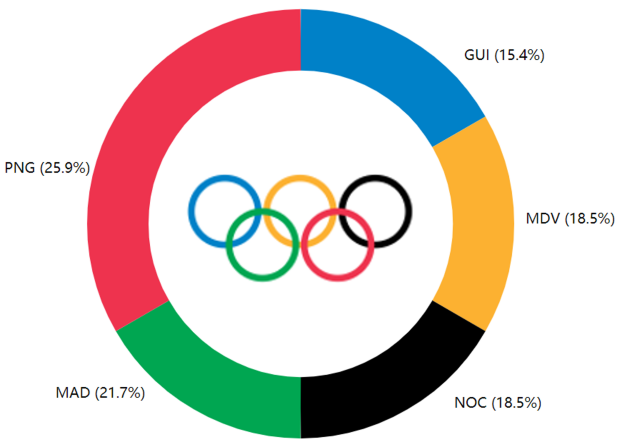
Figure 3 shows that PNG (Papua New Guinea) has the highest probability of 0.49, MAD (Madagascar) has a probability of 0.41, and GAM (Gambia) and MDV (Maldives) have the same probability of 0.35. GUI (Guinea) has the lowest probability of 0.29. These probabilities may be based on a comprehensive assessment of various factors such as the level of sports development in each country or region and the competitiveness of the participating events and are predictions.
For example, PNG (Papua New Guinea) is calculated to have participated in the most Athletics competitions. In order to specifically improve the results of this event in the Olympics, the following suggestions can be implemented:
• Papua New Guinea has a complex terrain and its residents have good endurance, so it has potential in endurance events such as middle and long-distance running. At present, its international competitiveness is relatively weak, but there is still much room for improvement. A national selection mechanism needs to be established to tap talent in remote areas and provide professional training and development opportunities.
• The country lacks professional training venues and facilities, and there are not enough high-level local coaches to provide international training methods. Greater financial investment is needed to build professional venues (such as standard running tracks), bring in high-level foreign coaches, and strengthen international training for local coaches.
• The government should actively organize athletes to participate in international competitions and training camps to gain experience and understand the international advanced level.
5. Conclusion
This study demonstrates the effectiveness of machine learning in predicting Olympic medal outcomes, with a focus on the superior performance of the random forest model (91% cross-validation accuracy) over logistic regression (65%). Key determinants identified through feature analysis include targeted discipline development and athlete training quality, while highlighting five historically non-medal-winning countries: Papua New Guinea, Madagascar, Gambia, Maldives, and Guinea. The model reveals that strategic resource allocation to high-impact disciplines yields disproportionate medal returns, emphasizing the importance of optimized training infrastructure.
These insights provide actionable strategies for policymakers, such as prioritizing talent development in underserved regions, implementing performance-based athlete incentives, and sharing sports facilities across disciplines. By leveraging the nonlinear modeling capabilities of random forests, the framework offers resource-constrained nations a data-driven pathway to competitive success, overcoming the limitations of traditional linear methods in capturing complex interactions. The findings underscore the transformative potential of predictive analytics in guiding equitable sports governance and maximizing Olympic performance outcomes.
References
[1]. Christoph S , L. S S , Dominik S , et al.Forecasting the Olympic medal distribution – A socioeconomic machine learning model [J].Technological Forecasting & Social Change, 2022, 175
[2]. Wunderlich F , Biermann H , Yang W , et al.Assessing machine learning and data imputation approaches to handle the issue of data sparsity in sports forecasting [J].Machine Learning, 2025, 114(2): 48-48.
[3]. Scelles N , Andreff W , Bonnal L , et al.Forecasting National Medal Totals at the Summer Olympic Games Reconsidered [J].Social Science Quarterly, 2020, 101(2): 697-711.
[4]. Jiao L , Yao J .Infrared thermal image detection and facial expression recognition based on genetic algorithm in sports prediction simulation: Sports thermal modeling [J].Thermal Science and Engineering Progress, 2025, 58103218-103218.
[5]. Marchal A , Benazieb O , Weldegebriel Y , et al.Statistical flaws of the fitness-fatigue sports performance prediction model [J].Scientific Reports, 2025, 15(1): 3706-3706.
[6]. S. M H , Kyra H .Testing theory predictions and intervention mechanisms of action in sport and exercise psychology using meta-analysis. [J].Sport, Exercise, and Performance Psychology, 2025, 14(1): 96-119.
Cite this article
Zou,X.;Qiu,X. (2025). Random Forest-Based Prediction of First Olympic Medals for Non-Medaling Nations. Theoretical and Natural Science,104,7-12.
Data availability
The datasets used and/or analyzed during the current study will be available from the authors upon reasonable request.
Disclaimer/Publisher's Note
The statements, opinions and data contained in all publications are solely those of the individual author(s) and contributor(s) and not of EWA Publishing and/or the editor(s). EWA Publishing and/or the editor(s) disclaim responsibility for any injury to people or property resulting from any ideas, methods, instructions or products referred to in the content.
About volume
Volume title: Proceedings of CONF-MPCS 2025 Symposium: Mastering Optimization: Strategies for Maximum Efficiency
© 2024 by the author(s). Licensee EWA Publishing, Oxford, UK. This article is an open access article distributed under the terms and
conditions of the Creative Commons Attribution (CC BY) license. Authors who
publish this series agree to the following terms:
1. Authors retain copyright and grant the series right of first publication with the work simultaneously licensed under a Creative Commons
Attribution License that allows others to share the work with an acknowledgment of the work's authorship and initial publication in this
series.
2. Authors are able to enter into separate, additional contractual arrangements for the non-exclusive distribution of the series's published
version of the work (e.g., post it to an institutional repository or publish it in a book), with an acknowledgment of its initial
publication in this series.
3. Authors are permitted and encouraged to post their work online (e.g., in institutional repositories or on their website) prior to and
during the submission process, as it can lead to productive exchanges, as well as earlier and greater citation of published work (See
Open access policy for details).
References
[1]. Christoph S , L. S S , Dominik S , et al.Forecasting the Olympic medal distribution – A socioeconomic machine learning model [J].Technological Forecasting & Social Change, 2022, 175
[2]. Wunderlich F , Biermann H , Yang W , et al.Assessing machine learning and data imputation approaches to handle the issue of data sparsity in sports forecasting [J].Machine Learning, 2025, 114(2): 48-48.
[3]. Scelles N , Andreff W , Bonnal L , et al.Forecasting National Medal Totals at the Summer Olympic Games Reconsidered [J].Social Science Quarterly, 2020, 101(2): 697-711.
[4]. Jiao L , Yao J .Infrared thermal image detection and facial expression recognition based on genetic algorithm in sports prediction simulation: Sports thermal modeling [J].Thermal Science and Engineering Progress, 2025, 58103218-103218.
[5]. Marchal A , Benazieb O , Weldegebriel Y , et al.Statistical flaws of the fitness-fatigue sports performance prediction model [J].Scientific Reports, 2025, 15(1): 3706-3706.
[6]. S. M H , Kyra H .Testing theory predictions and intervention mechanisms of action in sport and exercise psychology using meta-analysis. [J].Sport, Exercise, and Performance Psychology, 2025, 14(1): 96-119.