


1. Introduction
Polycyclic aromatic hydrocarbons (PAHs) are a class of organic pollutants widely distributed in aquatic environments and are well-known for their potential carcinogenicity, teratogenicity, and mutagenicity [1]. Due to their high toxicity and prevalence, the United States Environmental Protection Agency (US EPA) has listed 16 PAHs as priority pollutants for monitoring [2], while the International Agency for Research on Cancer (IARC) has classified seven of these individual PAH compounds as potentially carcinogenic to humans [3]. As typical persistent organic pollutants (POPs), PAHs originate from both natural and anthropogenic sources, with the latter being the dominant contributor. These include incomplete combustion, transportation, industrial activities, and various human actions [4,5]. PAHs generated by anthropogenic activities enter aquatic environments mainly through wastewater discharge, atmospheric dry and wet deposition, surface runoff, riverine transport, and accidental spills [6,7]. In aquatic environments, low-molecular-weight PAHs tend to dissolve in water, whereas high-molecular-weight PAHs, due to their low water solubility and lipophilicity, are prone to adsorption onto colloidal materials or suspended particulate matter, leading to their accumulation in sediments. When the aquatic environment is disturbed, PAHs in the sediments can be remobilized and released back into the water column through desorption, thereby increasing the pollution load and triggering regional contamination and ecological risks [8–10].
In recent years, both domestic and international scholars have conducted extensive research on the sources, distribution characteristics, and risk status of PAHs in surface water bodies such as lakes, rivers, reservoirs, and coastal zones worldwide. Notable examples include studies on the Indus River [11], the Damodar River Basin [12], Lake Chaohu [13], Luoma Lake and its inflow rivers [14], the Huai River (Anhui section) [15], the Yangtze River Basin [3,16], the Danjiangkou Reservoir [17], and Jiaozhou Bay in Shandong [18]. These research efforts have laid a solid foundation for understanding the pollution levels and risk profiles of PAHs in surface waters across various regional scales. However, it is also evident that research on PAHs in China's surface waters has largely focused on the economically developed eastern coastal areas and the Yangtze River Delta with its dense river networks. In contrast, investigations and studies in the southwestern low-latitude plateau regions of China, where economic development levels vary significantly, remain limited. This lack of data hinders a comprehensive understanding of PAH pollution and risks in these regions, making it difficult to conduct accurate assessments of contamination characteristics and associated ecological risks [19]. Therefore, analyzing the occurrence characteristics and sources of PAHs in plateau surface waters is crucial for comprehensively evaluating the ecological risk effects in aquatic environments.
As a typical low-latitude plateau fault-depression shallow lake in southwestern China, Lake Qilu serves vital functions in supporting local agricultural and industrial water use, flood regulation, and storage, playing an essential role in sustaining regional economic development. However, with the rapid development of lakeside economies and high energy consumption in recent years, water pollution in Lake Qilu has become increasingly severe [20]. Many scholars have conducted investigations on the pollution issues of Lake Qilu. For instance, Tang Zhong’ao et al. [21] analyzed the vertical distribution, correlation, and ecological risk of nitrogen and phosphorus in the sediments of wetlands at river mouths entering Lake Qilu, concluding that these nutrients pose considerable ecological risks and that agricultural non-point source pollution is the main contributor to water pollution. Wang Yongqiang et al. [22] studied the distribution characteristics and health risks of microcystin in the surface waters of Lake Qilu during autumn and winter and found that the isomer content of microcystins varies spatially and temporally due to nutrient levels, though the overall risk level remained low or very low. Additionally, Yin Pengfei et al. [23] examined the spatial distribution, correlation, and influencing factors of nutrients in Lake Qilu’s surface waters, reporting that the levels of organic matter, total nitrogen, and total phosphorus in surface sediments were generally high, with nitrogen and phosphorus pollution being more severe than that of organic matter. While these studies primarily focused on conventional inorganic indicators, nutrients, and biological toxins in Lake Qilu’s aquatic environment, there has been a notable absence of research on the more hazardous persistent organic pollutants—PAHs. This gap limits the effective implementation of PAH pollution control strategies. Hence, understanding the current state of PAH contamination and its potential ecological risks in Lake Qilu is of great practical importance for governmental decision-making on water pollution prevention and control strategies for plateau lakes.
In this study, Lake Qilu was selected as the research area. Based on one year of monthly monitoring data of 16 PAH compounds, we analyzed the residual characteristics of PAHs in the lake for the first time and revealed their spatiotemporal distribution patterns. Furthermore, we employed the positive matrix factorization (PMF) model to identify the sources of PAHs and quantify their relative contributions. Ecological risk was assessed using the risk quotient (RQ) method. The findings of this study are expected to enhance the understanding of PAH contamination and its sources in Lake Qilu, provide theoretical support for the control and risk management of trace organic pollutants in aquatic environments, and offer foundational data for improving water quality and managing compound pollution in Lake Qilu.
2. Materials and methods
2.1. Overview of the study area
Lake Qilu is located in the economically developed lake basin region of central Yunnan. Its geographical coordinates range from 102°33′48″ to 102°52′36″ E and 24°4′36″ to 24°14′2″ N. It is one of the nine key plateau lakes in Yunnan Province and belongs to the Nanchuan River system, a tributary of the Xijiang River within the Pearl River Basin. Lake Qilu is a fault-depression shallow lake on the plateau [21], oriented from east to west with no significant surface outflow. The lake is primarily recharged by precipitation and runoff. Its maximum water level reaches 1796.62 meters, corresponding to a water surface area of 37.26 km². The maximum depth is 6.8 meters, with an average depth of 4.0 meters and a total storage capacity of 1.8285×10⁸ m³. The lake becomes progressively deeper from west to east [22]. Situated at a low latitude, Lake Qilu has a mid-subtropical semi-humid plateau monsoon climate, characterized by distinct wet and dry seasons, as well as synchronized rainfall and heat. The annual precipitation is relatively low, with a long-term average of 887 mm, while evaporation is high, with an annual average of 1150 mm. The mean annual temperature is 15.6°C, the average annual sunshine percentage is 52%, and the long-term mean relative humidity is 73.4%. The prevailing wind throughout the year is from the southwest, with an average wind speed of 2.7 m/s [20]. According to the official website of the Yunnan Provincial Department of Ecology and Environment (https://sthjt.yn.gov.cn/), the water quality standard for Lake Qilu follows Class III of the Environmental Quality Standards for Surface Water (GB 3838–2002). However, in 2024, the lake was classified as “worse than Class V,” with the main pollutants exceeding the standard being permanganate index, chemical oxygen demand (COD), and total phosphorus. The lake is currently at a moderate level of eutrophication.
2.2. Data sources and sample collection
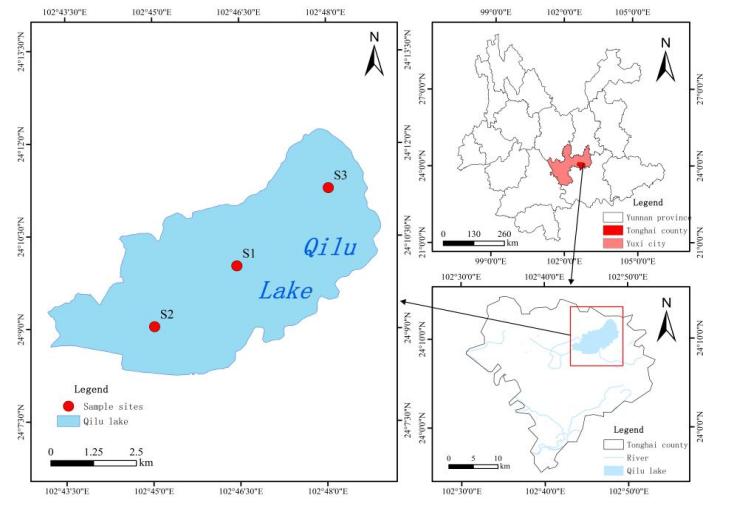
The data used in this study were obtained from the local ecological and environmental monitoring authorities, specifically the monthly water quality monitoring data for the 16 priority PAHs identified by the US EPA (see Table 1), spanning from January to December 2024. Three monitoring sections were established in the study area, each corresponding to either a national or provincial control monitoring point (see Fig. 1). The lake center section S1 (N24.166925, E102.7741583) is a national-level control monitoring point, located at the center of the lake. The Huguan Station section S2 (N24.1506, E102.7504) and Majiawan section S3 (N24.18790833, E102.8005944) are both provincial-level monitoring points, located on the western and eastern sides of the lake, respectively. Water sampling at each section was conducted in strict accordance with the Technical Specification Requirements for Surface Water Environmental Quality Monitoring (HJ 91.2–2022) during the first ten days of each month. Water samples were collected at a fixed depth of 0.5 meters below the lake surface. Over the course of one year, a total of 36 water samples were collected, yielding 576 individual data points for the 16 PAH compounds.
During sample collection, personnel wore nitrile gloves and used stainless steel water samplers to collect water vertically from a depth of 0.5 meters. The samples were immediately transferred into 1000 mL clean brown glass bottles, filled to capacity without air bubbles, tightly sealed, and stored in portable insulated boxes with ice packs for cooling. Once all samples were collected, they were transported by vehicle to the laboratory, stored at low temperature (4°C) in a refrigerator, and pretreated within 24 hours.
2.3. Sample analysis
The pretreatment and analysis procedures for water samples were based on previously published literature [24], with minor optimizations. Liquid-liquid extraction and quantitative concentration methods were used for sample pretreatment, while detection was carried out using gas chromatography–mass spectrometry (GC/MS). The specific steps are as follows:
2.3.1. Sample pretreatment
One liter of each water sample was measured using a graduated cylinder and filtered through a 0.45 μm glass fiber membrane using a vacuum pump to remove suspended algae. The filtered 1 L water sample was transferred into a 2 L pear-shaped separatory funnel, into which 60 mL of dichloromethane and 20.0 g of sodium chloride were added to demulsify. The funnel was vertically shaken for 10 minutes and then allowed to stand for 5 minutes for phase separation. The lower organic layer was collected. The extraction was repeated once, and the two portions of extract were combined. The combined extract was dehydrated using anhydrous sodium sulfate that had been pre-baked, then quantitatively concentrated to approximately 0.5 mL. Finally, the volume was adjusted to 1.0 mL by slow dropwise addition of dichloromethane for subsequent instrumental analysis.
2.3.2. Sample testing
① Standard Solution Preparation: A mixed standard solution of 16 target PAHs (see Table 1) and a mixed deuterated internal standard solution (including naphthalene-d8, acenaphthene-d10, phenanthrene-d10, chrysene-d12, and perylene-d12) were diluted with n-hexane to prepare intermediate stock solutions at concentrations of 1 μg·mL⁻¹ and 10 μg·mL⁻¹, respectively. Standard calibration solutions containing the 16 target PAHs were prepared at concentrations of 5, 10, 20, 50, 100, 200, and 500 μg·L⁻¹ using n-hexane as the solvent. To each calibration standard and prepared sample, 10 μL of the internal standard stock solution was added and gently shaken to ensure uniform mixing before instrumental analysis.
② GC–MS Analytical Conditions: An Agilent HP-5 ms ultra-inert capillary column (30 m × 0.25 mm i.d., 0.25 μm film thickness) was used. The sample was injected in split mode (split ratio 5:1) with an injection volume of 1.0 μL. High-purity helium served as the carrier gas at a flow rate of 1.1 mL·min⁻¹. The oven temperature program was as follows: initial temperature of 80°C held for 1 min, ramped at 20°C·min⁻¹ to 250°C, then at 12°C·min⁻¹ to 292°C, and held for 7 min, with a total run time of 20.0 min. The mass spectrometer operated in selected ion monitoring (SIM) mode. The temperatures of the electron ionization (EI) source, injection port, quadrupole, and transfer line were set at 250°C, 270°C, 150°C, and 300°C, respectively. The ionization energy was 70 eV, and the solvent delay time was set to 4.0 min.
2.4. Quality control and assurance
This study employed a deuterated internal standard method for quantitative detection of target compounds. For each month’s water sample analysis, quality control measures were implemented, including full-procedure blanks, transportation blanks, laboratory blanks, laboratory duplicate samples, and spiked recovery tests. None of the blanks showed detectable levels of target compounds. The relative deviation of duplicate samples was below 15%, and the average relative standard deviation (RSD) of the relative response factors (RRFs) for the standard calibration curves was less than 12%. The method detection limits (MDLs) for the 16 PAH compounds ranged from 0.4 to 1.0 ng·L⁻¹, and the quantification limits ranged from 1.6 to 4.0 ng·L⁻¹. The average recovery rates for spiked samples ranged from 65.2% to 108.7%, meeting the requirements for trace analysis. Recovery rates were not used to correct the reported results.
Additionally, all glassware used in the experiments—including graduated cylinders, concentrator tubes, and separatory funnels—was soaked overnight in a potassium dichromate solution after each use, followed by sequential rinsing with tap water, deionized water, and final drying by baking. Anhydrous sodium sulfate was baked in a muffle furnace at 500°C for 5 hours, then stored in sealed brown glass bottles in the dark for future use.
2.5. PMF source apportionment model
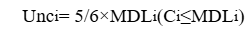
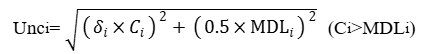
This study utilized the Positive Matrix Factorization (PMF) 5.0 receptor model recommended by the United States Environmental Protection Agency (US EPA; https://www.epa.gov/) to perform source apportionment analysis of PAHs. The principle of the model is to use mathematical optimization techniques (least squares method) to constrain and iterate measured pollutant concentrations and their uncertainties, thereby minimizing the objective function to resolve source contribution rates and source profiles. The advantages of this model include: it does not require the direct measurement of source profiles, it assigns weights based on data uncertainty, and it allows substitution for missing values or data below detection limits—thus reducing their impact on the results and improving reliability and rationality of the outcomes [25]. PMF is currently one of the most widely used methods for source apportionment. The input data for the model comprised measured concentrations of PAHs in Lake Qilu, while the uncertainties were calculated based on formulas provided in the EPA PMF 5.0 User Guide, as follows:
 (1)
(1)
 (2)
(2)
Where: Unci is the uncertainty of the i-th PAH compound; MDLi is the method detection limit for the i-th PAH; δi is the relative standard deviation of the i-th PAH compound, set at 10% in this study; Ci is the measured concentration of the i-th PAH compound, in ng·L⁻¹.
2.6. Ecological risk assessment method
Ecological risk assessment of PAHs in the study area was conducted using the Risk Quotient (RQ) method. The calculation was based on formulas adapted from literature [3], as follows:
 (3)
(3)
 (4)
(4)
Where:
For the total risk of all 16 PAH compounds (∑16 PAHs), the following formulas were used:
 (5)
(5)
 (6)
(6)
Where: RQ∑PAHs(NCs) and RQ∑PAHs(MPCs) are the cumulative minimum and maximum risk quotients for ∑16 PAHs, dimensionless.
|
Order number |
Number of rings |
PAHs abbreviation |
CQV(NCs) /(ng·L-1) |
CQV(MPCs) /(ng·L-1) |
Order number |
Number of rings |
PAHs abbreviation |
CQV(NCs) /(ng·L-1) |
CQV(MPCs) /(ng·L-1) |
|
1 |
2-ring |
Nap |
12.0 |
1200 |
9 |
4-ring |
BaA |
0.10 |
10 |
|
2 |
3-ring |
Acy |
0.70 |
70 |
10 |
Chr |
3.40 |
340 |
|
|
3 |
Ace |
0.70 |
70 |
11 |
5-ring |
BbF |
0.10 |
10 |
|
|
4 |
Flu |
0.70 |
70 |
12 |
BkF |
0.40 |
40 |
||
|
5 |
Phe |
3.0 |
300 |
13 |
BaP |
0.50 |
50 |
||
|
6 |
Ant |
0.70 |
70 |
14 |
IcdP |
0.40 |
40 |
||
|
7 |
4-ring |
Flt |
3.0 |
300 |
15 |
6-ring |
DahA |
0.50 |
50 |
|
8 |
Pyr |
0.70 |
70 |
16 |
BghiP |
0.30 |
30 |
The classification criteria for the ecological risk levels of the 16 individual PAH compounds and ∑PAHs in the studied water body were based on Reference [13], as detailed in Table 2.
|
16 PAH monomers |
Risk level |
∑16 PAHs |
Risk level |
||
|
RQNCs |
RQMPCs |
RQ∑PAHs(NCs) |
RQ∑PAHs(MPCs) |
||
|
<1 |
— |
Low risk |
— |
— |
No risk |
|
≥1 and <800 |
— |
Low risk |
|||
|
≥1 |
<1 |
Medium risk |
≥800 |
— |
Medium risk-1 |
|
<800 |
≥1 |
Medium risk-2 |
|||
|
— |
≥1 |
High risk |
≥800 |
≥1 |
High risk |
"-" means no corresponding value
2.7. Data analysis
ArcGIS 15.0 software was used to generate the spatial distribution map of sampling points in the study area. Microsoft Excel 2016 was used for organizing and formatting the raw PAHs dataset. Origin 2024 software was used for visualization and plotting of related figures. The EPA PMF 5.0 model was applied for source apportionment of PAHs in the water body.
3. Results and discussion
3.1. Overall characteristics of PAH concentrations
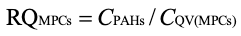
To understand the seasonal variation in PAH mass concentrations in the study area, monthly monitoring data of 16 PAHs in Qilu Lake in 2024 were statistically categorized into the rainy season (May–October) and the dry season (November–April of the following year) [27]. The statistical characteristics of PAH mass concentrations in Qilu Lake are presented in Table 3. As shown in the table, among the 16 PAHs analyzed, 13 compounds were detected in both the rainy and dry seasons, while IcdP, DahA, and BghiP were not detected in any samples. The detected compounds were consistent across both seasons. During the rainy season, the ∑16 PAHs concentration ranged from ND to 198.42 ng·L⁻¹, with an average of 49.11 ng·L⁻¹ and a median of 30.11 ng·L⁻¹, with detection frequencies ranging from 11.1% to 100%. In the dry season, the ∑16 PAHs concentration ranged from ND to 213.38 ng·L⁻¹, with an average of 63.79 ng·L⁻¹ and a median of 20.75 ng·L⁻¹, with detection frequencies between 22.2% and 100%. These findings suggest that PAHs are widely present in the lake. In terms of individual compounds, the highest average concentration in both the rainy and dry seasons was observed for Ace (11.02 ng·L⁻¹ and 11.85 ng·L⁻¹, respectively), with a 100% detection frequency. The highest single-compound concentrations were Phe (49.94 ng·L⁻¹) in the rainy season and Ace (43.63 ng·L⁻¹) in the dry season. The 13 detected PAHs exhibited high variability (coefficient of variation ranging from 0.38 to 1.73), indicating notable spatial heterogeneity in PAH distribution across the lake. Moreover, the mean values for most of the detected PAHs exceeded the medians, indicating a positively skewed distribution and the presence of high concentration outliers, likely due to the input of external PAH sources.
To further assess the level of PAH contamination in Qilu Lake, comparisons were made with typical surface water environments both domestically and internationally. The ∑PAHs concentrations in Qilu Lake were higher than those observed in the Wuhan section of the Yangtze River (2.51–102.5 ng·L⁻¹) [3], the Danube River in Hungary (67–96 ng·L⁻¹) [11], and Lake Chaohu (83.8–174.2 ng·L⁻¹) [13]. They were comparable to levels in the Halaha River (16.91–201.14 ng·L⁻¹) [19], the Jiangsu section of the Yangtze River (26.06–262 ng·L⁻¹) [3], Luoma Lake and its inflow rivers (5.45–264 ng·L⁻¹) [14], the Taor River (48.10–244.57 ng·L⁻¹), and the Taihu Lake Basin (19.6–244 ng·L⁻¹) [28]. However, concentrations were lower than those found in the Dongliao River (396.42–624.06 ng·L⁻¹) [4], the Amu Darya River in Uzbekistan (3.19–779 ng·L⁻¹) [8], Danjiangkou Reservoir (64.64–868.23 ng·L⁻¹) [17], the Sasa River in Nigeria (0–349 ng·L⁻¹) [29], the Sultanabad River in Iran (43.5–385 ng·L⁻¹) [30], and East Lake (13.05–989.09 ng·L⁻¹) and Tangxun Lake (12.92–442.53 ng·L⁻¹) in China [31]. Based on these comparisons, the level of PAH pollution in Qilu Lake can be considered moderate.
|
PAHs |
Rainy season (May to October) |
Dry season (November to April) |
||||||||||
|
PAHs mass concentrations/ (ng·L-1) |
CV |
Detection rate/% |
PAHs mass concentrations/(ng·L-1) |
CV |
Detection rate/% |
|||||||
|
Min. |
Max. |
Average |
Median |
Min. |
Max. |
Average |
Median |
|||||
|
Nap |
1.17 |
3.79 |
1.81 |
1.58 |
0.38 |
100 |
1.04 |
28.12 |
10.62 |
10.32 |
0.74 |
100 |
|
Acy |
0.68 |
13.01 |
4.23 |
2.83 |
0.83 |
100 |
1.11 |
17.80 |
6.94 |
5.04 |
0.84 |
100 |
|
Ace |
2.95 |
33.26 |
11.02 |
7.14 |
0.80 |
100 |
3.13 |
43.63 |
11.85 |
6.70 |
0.92 |
100 |
|
Flu |
1.13 |
11.73 |
4.0 |
3.35 |
0.70 |
100 |
1.35 |
28.35 |
9.27 |
4.69 |
0.95 |
100 |
|
Phe |
1.01 |
49.94 |
9.79 |
4.38 |
1.34 |
100 |
0.92 |
13.26 |
5.56 |
3.73 |
0.82 |
100 |
|
Ant |
1.21 |
7.18 |
3.94 |
3.79 |
0.42 |
100 |
1.06 |
17.94 |
5.56 |
1.48 |
1.16 |
100 |
|
Flt |
ND |
12.96 |
2.72 |
1.52 |
1.32 |
61.1 |
ND |
3.06 |
1.56 |
1.76 |
0.67 |
83.3 |
|
Pyr |
ND |
4.76 |
1.77 |
1.43 |
0.75 |
83.3 |
ND |
12.20 |
3.02 |
1.59 |
1.33 |
66.7 |
|
BaA |
ND |
2.40 |
1.0 |
1.23 |
0.86 |
61.1 |
ND |
1.48 |
ND |
ND |
ND |
22.2 |
|
Chr |
ND |
1.32 |
ND |
ND |
ND |
11.1 |
ND |
1.50 |
ND |
ND |
ND |
33.3 |
|
BbF |
ND |
2.77 |
0.59 |
0.30 |
1.30 |
22.2 |
ND |
1.99 |
0.58 |
ND |
1.18 |
38.9 |
|
BkF |
ND |
4.59 |
1.58 |
1.00 |
0.90 |
77.8 |
ND |
1.40 |
ND |
ND |
1.73 |
22.2 |
|
BaP |
ND |
1.80 |
1.06 |
1.11 |
0.47 |
77.8 |
ND |
1.50 |
0.74 |
0.78 |
0.55 |
83.3 |
|
IcdP |
ND |
ND |
ND |
ND |
0 |
0 |
ND |
ND |
ND |
ND |
0 |
0 |
|
DahA |
ND |
ND |
ND |
ND |
0 |
0 |
ND |
ND |
ND |
ND |
0 |
0 |
|
BghiP |
ND |
ND |
ND |
ND |
0 |
0 |
ND |
ND |
ND |
ND |
0 |
0 |
|
∑16 PAHs |
ND |
198.42 |
49.11 |
30.11 |
— |
— |
ND |
213.38 |
63.79 |
20.75 |
— |
— |
"ND" means not detected, "-" means no corresponding value, and "CV" means coefficient of variation.
3.2. Temporal and spatial distribution of pahs
The seasonal distribution of the 13 detected PAHs is illustrated in Figure 2. The average ∑PAHs concentration during the dry season (63.79 ng·L⁻¹) was higher than that in the rainy season (49.11 ng·L⁻¹), and the maximum ∑PAHs concentration in the dry season (213.38 ng·L⁻¹) also exceeded that of the rainy season (198.42 ng·L⁻¹) (see Table 3), indicating a higher overall PAH burden in the dry season. In terms of detection frequency and concentration, six PAH compounds—Ace (11.02 ng·L⁻¹), Phe (9.79 ng·L⁻¹), Acy (4.23 ng·L⁻¹), Flu (4.0 ng·L⁻¹), Ant (3.94 ng·L⁻¹), and Nap (1.81 ng·L⁻¹)—were detected in 100% of samples during the rainy season. For the remaining seven PAH monomers, the average concentrations ranged from not detected (ND) to 2.72 ng·L⁻¹, with detection frequencies between 11.1% and 83.3%. In the dry season, six PAH monomers—acenaphthene (Ace, 11.85 ng·L⁻¹), naphthalene (Nap, 10.62 ng·L⁻¹), fluorene (Flu, 9.27 ng·L⁻¹), acenaphthylene (Acy, 6.94 ng·L⁻¹), phenanthrene (Phe, 5.56 ng·L⁻¹), and anthracene (Ant, 3.94 ng·L⁻¹)—were detected at a 100% frequency. The remaining seven PAH monomers showed average concentrations ranging from ND to 3.02 ng·L⁻¹, with detection frequencies between 22.2% and 83.3%. Overall, the concentration levels of low-ring PAHs (2–3 rings) were higher than those of medium- and high-ring PAHs (4–6 rings).
In summary, the average ∑PAHs concentration was higher in the dry season than in the rainy season, while for some individual PAHs (e.g., Phe, Flt, BaA, BkF, BaP), average concentrations were higher in the rainy season. These patterns may be influenced by seasonal factors. The study area is characterized by a semi-humid plateau monsoon climate, with distinct wet and dry seasons. Variations in rainfall, atmospheric deposition, and runoff erosion [32], combined with changes in temperature and solar radiation, may influence the transport, dispersion, adsorption, and degradation of PAHs in the water body [29].
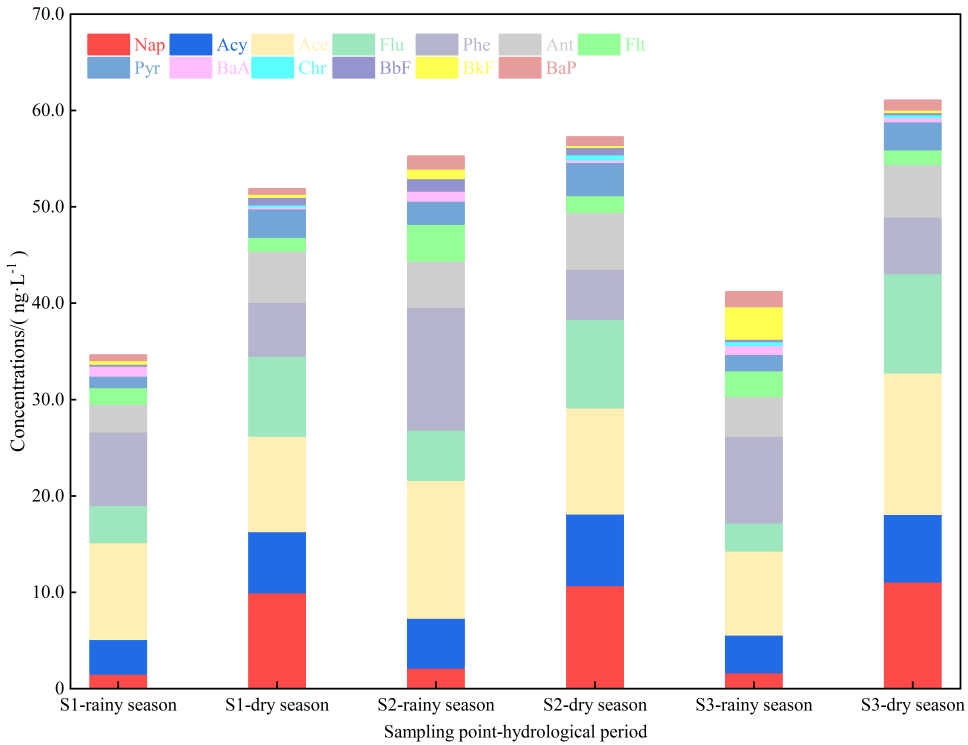
The spatial distribution of PAHs is shown in Figure 3. In the rainy season, sampling site S2 recorded the highest average ∑PAHs concentration (55.39 ng·L⁻¹), followed by S3 (41.19 ng·L⁻¹) and S1 (34.60 ng·L⁻¹), forming a spatial pattern of S2 > S3 > S1. In the dry season, S3 exhibited the highest average (61.00 ng·L⁻¹), followed by S2 (57.26 ng·L⁻¹), and again S1 had the lowest (51.85 ng·L⁻¹), following the pattern S3 > S2 > S1. The consistently low concentrations at S1 in both seasons may be due to its central location in the lake, where hydrodynamic disturbances are minimal and external pollutant inputs are relatively low. Conversely, higher concentrations at S2 and S3 indicate stronger seasonal influence. S2 is located in the western part of the lake, downstream of the confluence between Qilu Lake and Hongqi River—the river with the largest inflow. This region experiences complex hydrological conditions and high water exchange. During the rainy season, Hongqi River receives substantial agricultural runoff and domestic sewage, increasing PAH input through wet deposition and surface runoff [32]. Strong hydrological activity may also cause sediment resuspension and downstream transport, releasing previously deposited PAHs into the water column [3,14]. Thus, external pollutant inputs and secondary release of PAHs are likely the main contributors to elevated concentrations at S2. S3, located in the eastern part of the lake near lakeside villages and transportation infrastructure, is influenced by high traffic volumes (e.g., the Mi-Chu Expressway and Jiangtong Highway) and agricultural activities. These anthropogenic sources may significantly contribute to PAH input [33]. Additionally, during the dry season—coinciding with cold and dry winter-spring periods—low precipitation and reduced lake volume limit effective water circulation, making S3 more prone to PAH accumulation.
3.3. Compositional characteristics of pahs
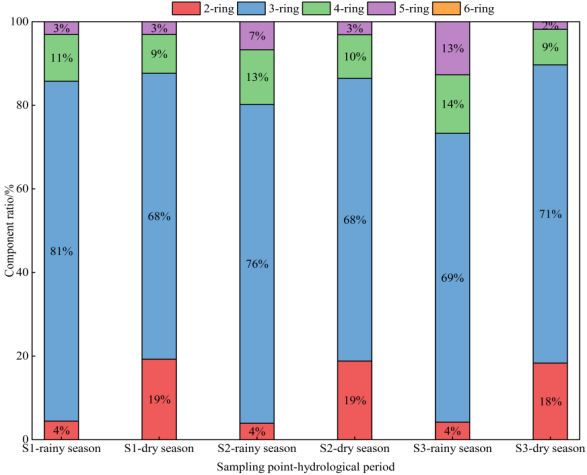
To explore the seasonal variations in PAH composition in Qilu Lake, the PAH monomers were grouped by ring number. The average concentration of each ring-group was calculated for each sampling point and visualized in a stacked bar chart (Figure 4). As shown in Figure 4, the compositional profiles at all three sampling sites (S1, S2, and S3) in both the rainy and dry seasons followed the order: low-ring PAHs (2–3 rings) > medium-ring PAHs (4 rings) > high-ring PAHs (5 rings). Among them, 3-ring PAHs accounted for over 68% of the total at each site, with the highest proportion reaching 81%, indicating a dominant contribution. In contrast, 5-ring PAHs accounted for only 2%–13%, while 2-ring and 4-ring PAHs contributed relatively equally (4%–19% and 9%–14%, respectively). Overall, regardless of the season, PAHs in Qilu Lake were predominantly composed of 3-ring structures, contributing 68%–81% of the total PAH concentration. These compositional features are consistent with findings from other studies. For instance, Kuo Yao [31] reported that 2–3 ring PAHs made up more than 70% of PAHs in East Lake and Tangxun Lake, while Li Shuyin [32] observed that in Danjiangkou Reservoir, the proportion of low-ring PAHs ranged from 69%–100% in the wet season and 95%–100% in the dry season. This trend may be attributed to the physicochemical properties of PAHs—specifically, as ring number increases, PAHs tend to exhibit lower vapor pressure, water solubility, and solubility in general. High-ring PAHs have greater molecular weights and are more likely to adsorb to particulates and sediments, while low-ring PAHs, with lower octanol–water partition coefficients, are more likely to dissolve in the water column [7,8]. As a result, low-ring PAHs tend to dominate in aqueous environments. Additionally, the compositional pattern may be influenced by regional economic activities. Qilu Lake is surrounded by extensive agricultural land and is one of the largest vegetable production bases in Yunnan Province. Biomass combustion—particularly incomplete combustion of crop residues and straw—produces large amounts of low-ring PAHs [34].
3.4. Source apportionment of pahs
3.4.1. Correlation analysis of pahs
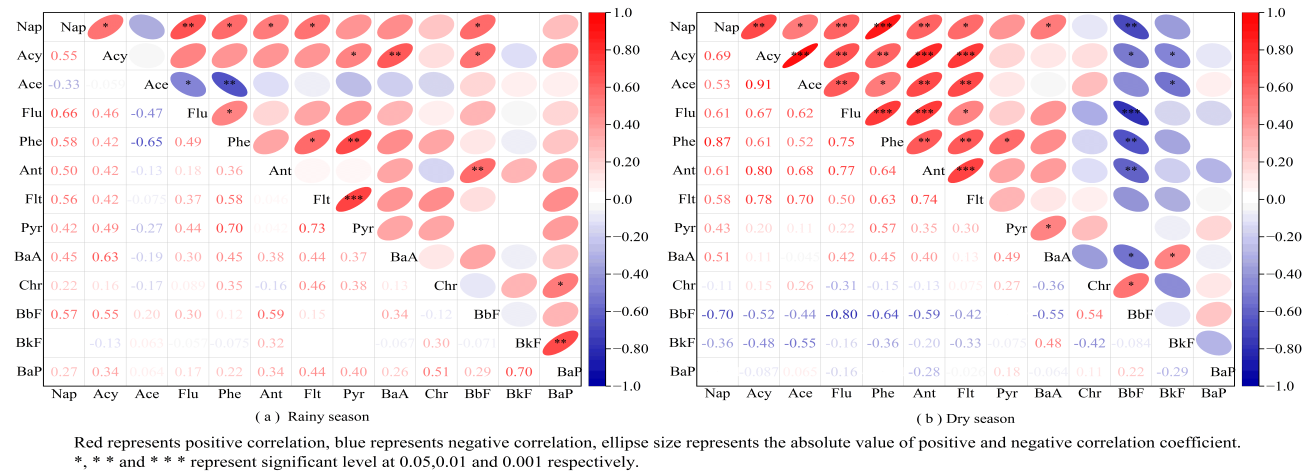
To investigate the potential sources of PAHs in the surface water of Qilu Lake, Spearman correlation analysis was performed on the 13 detected PAH monomers, as the data were not normally distributed. The results are shown in Figure 5. As illustrated in Figure 5(a), in the rainy season, acenaphthene (Ace) exhibited significant negative correlations with phenanthrene (Phe) and fluorene (Flu) at the P < 0.01 and P < 0.05 levels, respectively, with correlation coefficients of -0.65 (Ace–Phe) and -0.47 (Ace–Flu). This suggests an antagonistic relationship between Ace and Phe/Flu or indicates different sources. Fluoranthene (Flt) and pyrene (Pyr) showed a highly significant positive correlation at the P < 0.001 level, with a correlation coefficient of 0.73. In addition, significant positive correlations (P < 0.01) were observed between Nap and Flu, Acy and BaA, Phe and Pyr, Ant and BbF, and BkF and BaP, with correlation coefficients ranging from 0.59 to 0.70. These results indicate that these PAHs exhibit similar variation trends in the Qilu Lake water, suggesting they may originate from the same or similar sources or result from mixed pollution.
Figure 5b shows that during the dry season, low-ring PAHs (2–3 rings) generally had significant or highly significant positive correlations (P < 0.05 to P < 0.001). In particular, the correlations between Nap–Phe, Ace–Acy, and Ant–Acy were especially strong, with coefficients > 0.8 (P < 0.001). Other strong correlations (P < 0.001) were observed among Acy–Flt, Flu–Phe, and Flu–Ant. These results suggest that low-ring (2–3 rings) and some mid-ring PAHs (such as Flt) may originate from similar sources due to similarities in emission and environmental behavior [35]. In contrast, most medium- and high-ring PAHs (4–6 rings) did not exhibit significant correlations with each other or with low-ring PAHs, indicating distinct source differences between low-ring and high-ring PAHs.
3.4.2. Source apportionment of pahs
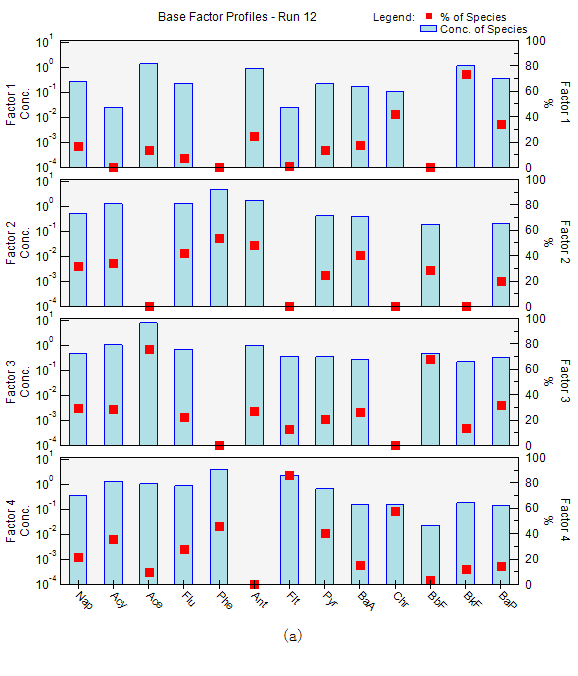
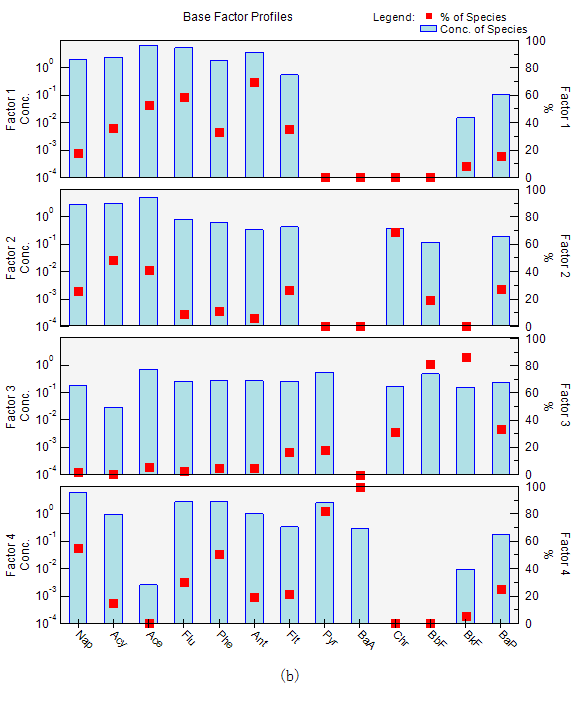
To quantify the sources of PAHs in Qilu Lake, the EPA PMF 5.0 (Positive Matrix Factorization) model was applied. Uncertainties were calculated using the formula provided in Section 1.5, and together with the measured PAH concentrations, were used as input for model simulation. The results are shown in Figures 6 and 7.
In Figure 6a (rainy season), Factor 1 showed high contributions from BkF, Chr, and BaP. BkF and BaP are indicative of diesel and gasoline combustion [8], while Chr is associated with natural gas combustion and is commonly emitted from vehicles fueled by natural gas [36]. Thus, Factor 1 is attributed to traffic emissions. Factor 2 was dominated by Phe, Ant, and Flu. These are strongly associated with coal combustion [31]; Ant is also considered a marker of coke oven emissions [37], and Flu indicates coking and steel production [3]. Therefore, Factor 2 was identified as industrial sources. Factor 3 featured high contributions from Ace and BbF. Ace is typically linked to petroleum product volatilization and leakage [38], while BbF is an indicator of diesel combustion [32], suggesting that Factor 3 represents mixed sources of petroleum volatilization and combustion emissions. Factor 4 had major contributions from Flt, Chr, and Pyr. Flt and Pyr are indicative of coal combustion [7], and Chr, while a marker of natural gas combustion, can also be produced during charcoal burning, agricultural biomass burning, and waste incineration [37]. The region around Qilu Lake is characterized by rural settlements and extensive farmlands where coal and straw are burned, contributing to PAH emissions. Therefore, Factor 4 is identified as a mixed source of coal and biomass combustion.
In the dry season (Figure 6b), Factor 1 was dominated by Ant and Flu, which showed a strong correlation (P < 0.001) in Figure 5, supporting their identification as industrial sources. Factor 2 included Chr, Acy, and Ace, where Chr can originate from natural gas combustion as well as from agricultural, charcoal, and waste burning; Acy is a marker for biomass combustion (e.g., wood and straw) [8]. Thus, Factor 2 is attributed to biomass combustion. Factor 3 had high loadings of BkF and BbF, both high-ring PAHs associated with diesel vehicle exhaust, indicating traffic emissions.
Factor 4 was characterized by high loadings of BaA, Pyr, Nap, and Phe. BaA, Pyr, and Phe are linked to coal combustion, while Nap is a marker of petroleum leakage and volatilization, and also indicative of biomass burning [36,39]. Hence, Factor 4 represents a mixed source of coal and biomass combustion.
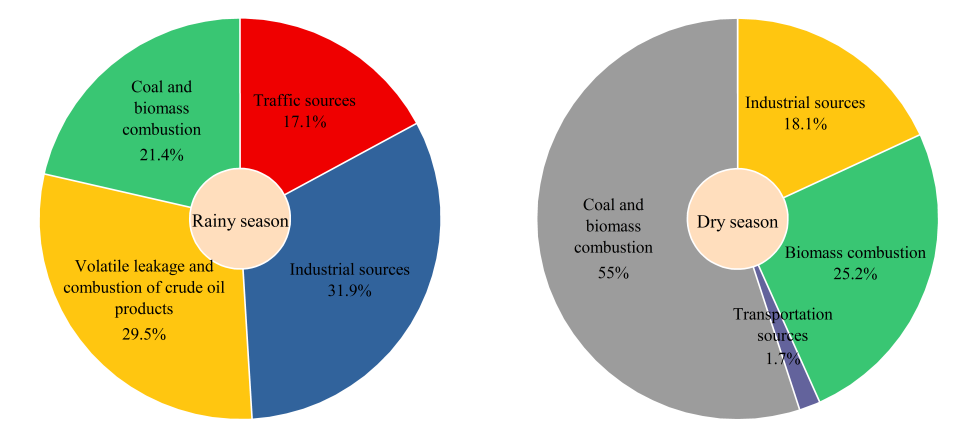
As shown in Figure 7, during the rainy season, industrial sources (31.9%) and petroleum-related volatilization/combustion (29.5%) were the dominant contributors to PAHs, followed by coal and biomass combustion (21.4%), with traffic emissions accounting for the lowest proportion (17.1%). In contrast, during the dry season, coal and biomass combustion contributed the most (55.0%), followed by biomass burning alone (25.2%) and industrial sources (18.1%), with traffic emissions contributing the least (1.7%). These results indicate that PAHs in Qilu Lake during the rainy season mainly originate from industrial activities and petroleum-related emissions (61.4% combined), possibly due to the local industrial structure and meteorological conditions—high temperatures and intense solar radiation during the rainy season promote PAH volatilization, transport, and secondary reactions. In the dry season, PAHs primarily stem from coal and biomass combustion (accounting for 80.2%), which may be attributed to increased coal consumption in nearby areas and the common practice of burning crop residues and household waste in rural lakeside communities.
3.5. Ecological risk assessment of PAHs
Using the Risk Quotient (RQ) method and the formula and assessment criteria listed in Section 2.6, the ecological risks of PAHs detected in the surface water of Qilu Lake were evaluated. The results are presented in Table 4. According to Table 4, none of the 13 detected PAH monomers in the rainy season posed high ecological risk. Specifically, the RQNCs values for naphthalene (Nap) and chrysene (Chr) ranged from 0 to 0.39 and were both below 1, indicating low ecological risk. In contrast, the RQNCs values for acenaphthene (Ace), fluorene (Flu), and anthracene (Ant) were above 1, while their RQNCs values remained below 1, suggesting they posed medium ecological risk and warrant further attention. The remaining eight PAH monomers exhibited risk levels ranging from low to medium. Similarly, in the dry season, none of the 13 PAHs presented high ecological risk. Chr showed the lowest risk level with RQNCs values in the range of 0 to 0.44 (i.e., RQNCs < 1), while Acy, Ace, Flu, and Ant all had RQNCs > 1 and RQMPCS < 1, indicating medium ecological risk. The other eight PAH monomers were also within the low to medium risk range. These findings suggest that Ace, Flu, and Ant are the dominant contributors to ecological risk in both seasons, primarily due to their measured concentrations and the values assigned to the corresponding CQV(NCs) and CQV(MPCs). In terms of total PAHs (∑PAHs), the RQ∑PAHs(NCs) values in the rainy season ranged from 31.95 to 111.15, with a mean of 62.00, while the RQ∑PAHs(MPCs) values ranged from 0.32 to 1.11, with an average of 0.62. Approximately 89% of RQ values fell within the low-risk range, and only 11% were in the medium-risk category, with no high-risk levels observed. In the dry season, RQ∑PAHs(NCs) values ranged from 16.83 to 157.13 (mean: 66.64), and RQ∑PAHs(MPCs) values ranged from 0.17 to 1.57 (mean: 0.67), with 83% of the values indicating low risk and 17% medium risk, again with no high risk recorded.
Notably, despite their low detected concentrations—BaA (mean 1.0 ng·L⁻¹ in the rainy season, not detected in the dry season) and BkF (mean 1.58 ng·L⁻¹ in the rainy season, not detected in the dry season)—risk assessment showed that BaA (with 61% of samples at medium risk) and BkF (67% at medium risk) still posed notable ecological threats to the water body. This highlights the inadequacy of relying solely on concentration-based indicators to assess ecological risk, as they may underestimate the potential harm posed by pollutants present at low concentrations.[40] Therefore, it is essential to integrate chemical contamination assessments with ecological risk evaluations to comprehensively understand the safety status of lake water environments. In conclusion, the risk assessment indicated that most PAH monomers have become risk factors for the aquatic ecosystem. In light of growing national attention toward the management of emerging contaminants, traditional persistent organic pollutants such as PAHs still require sustained monitoring to support the comprehensive pollution control and risk management of Qilu Lake’s aquatic environment.
|
PAHs |
Rainy season |
Dry season |
||||||||||||
|
RQNCs |
RQMPCs |
RQ statistical distribution/% |
RQNCs |
RQMPCs |
RQ statistical distribution/% |
|||||||||
|
Range |
Mean |
Range |
Mean |
Low risk |
Medium risk |
High risk |
Range |
Mean |
Range |
Mean |
Low risk |
Medium risk |
High risk |
|
|
Nap |
0.10~0.32 |
0.15 |
0 |
0 |
100 |
0 |
0 |
0.09~2.34 |
0.89 |
0~0.02 |
0.01 |
50 |
50 |
0 |
|
Acy |
0.98~18.59 |
6.04 |
0.01~0.19 |
0.06 |
6 |
94 |
0 |
1.59~25.43 |
9.91 |
0.02~0.25 |
0.10 |
0 |
100 |
0 |
|
Ace |
4.21~47.52 |
15.75 |
0.04~0.48 |
0.16 |
0 |
100 |
0 |
4.47~62.33 |
16.94 |
0.04~0.62 |
0.17 |
0 |
100 |
0 |
|
Flu |
1.61~16.76 |
5.71 |
0.02~0.17 |
0.06 |
0 |
100 |
0 |
1.93~40.50 |
13.24 |
0.02~0.41 |
0.13 |
0 |
100 |
0 |
|
Phe |
0.34~16.65 |
3.26 |
0~0.17 |
0.03 |
44 |
56 |
0 |
0.31~4.42 |
1.85 |
0~0.04 |
0.02 |
39 |
61 |
0 |
|
Ant |
1.73~10.26 |
5.63 |
0.02~0.10 |
0.06 |
0 |
100 |
0 |
1.51~25.62 |
7.95 |
0.02~0.26 |
0.08 |
0 |
100 |
0 |
|
Flt |
0~4.32 |
0.91 |
0~0.04 |
0.01 |
67 |
33 |
0 |
0~1.02 |
0.52 |
0~0.01 |
0.01 |
83 |
17 |
0 |
|
Pyr |
0~6.80 |
2.52 |
0~0.07 |
0.03 |
17 |
83 |
0 |
0~17.43 |
4.43 |
0~0.17 |
0.04 |
33 |
67 |
0 |
|
BaA |
0~24.04 |
9.97 |
0~0.24 |
0.10 |
39 |
61 |
0 |
0~14.80 |
2.84 |
0~0.15 |
0.03 |
78 |
22 |
0 |
|
Chr |
0~0.39 |
0.04 |
0 |
0 |
100 |
0 |
0 |
0~0.44 |
0.11 |
0 |
0 |
100 |
0 |
0 |
|
BbF |
0~27.70 |
5.94 |
0~0.28 |
0.06 |
22 |
78 |
0 |
0~19.90 |
5.84 |
0~0.20 |
0.06 |
33 |
67 |
0 |
|
BkF |
0.23~11.48 |
3.95 |
0~0.11 |
0.04 |
22 |
78 |
0 |
0~3.50 |
0.65 |
0~0.04 |
0.01 |
78 |
22 |
0 |
|
BaP |
0.74~3.60 |
2.13 |
0.01~0.04 |
0.02 |
22 |
78 |
0 |
0~3.00 |
1.49 |
0~0.03 |
0.01 |
22 |
78 |
0 |
|
∑PAHs |
31.95~111.15 |
62.00 |
0.32~1.11 |
0.62 |
89 |
11 |
0 |
16.83~157.13 |
66.64 |
0.17~1.57 |
0.67 |
83 |
17 |
0 |
The risk entropy of RQ∑PAHs at each sampling site is shown in Figure 8. During the rainy season, the mean RQ∑PAHs(NCs) values at sampling sites S1, S2, and S3 were 48.36, 79.67, and 57.95, respectively, with corresponding RQ∑PAHs(NCs) values of 0.48, 0.80, and 0.58. In the dry season, the mean RQ∑PAHs(NCs) values at S1, S2, and S3 were 61.65, 68.86, and 70.53, respectively, while the corresponding RQ∑PAHs(MPCs) values were 0.61, 0.68, and 0.70. Based on the mean values of RQ∑PAHs across all sampling points, the ecological risk level of Qilu Lake's surface water in both the rainy and dry seasons can be classified as low, with no medium or high ecological risk observed overall. However, it is noteworthy that the maximum RQ∑PAHs(MPCs) value at site S2 during the rainy season, as well as the maximum values at all three sites (S1, S2, and S3) during the dry season, exceeded 1. Meanwhile, the corresponding RQ∑PAHs(NCs) maximum values remained below 800. This suggests that the maximum RQ∑PAHs concentrations observed at site S2 in the rainy season and at all sampling points during the dry season may reach the medium ecological risk level. These findings imply that ∑PAHs accumulation in the lake during certain periods warrants close attention and targeted risk management.
4. Conclusion
(1) Among the surface water samples collected from Qilu Lake, 13 out of 16 PAH monomers were detected to varying degrees, except for IcdP, DahA, and BghiP. The total concentration of ∑16 PAHs ranged from 21.49 to 198.42 ng·L⁻¹ (mean: 49.11 ng·L⁻¹) in the rainy season, and from 12.67 to 213.38 ng·L⁻¹ (mean: 63.79 ng·L⁻¹) in the dry season. Low-ring PAHs (primarily 3-ring compounds) were the dominant components. Compared with some domestic and international surface water bodies, the PAHs pollution level in Qilu Lake is at a moderate level.
(2) There were significant seasonal variations in the concentration distribution of PAHs in the surface water of Qilu Lake. The mean concentration of ∑PAHs showed a trend of dry season (63.79 ng·L⁻¹) > rainy season (49.11 ng·L⁻¹). The maximum detected concentration was Phe (49.94 ng·L⁻¹) in the rainy season and Ace (43.63 ng·L⁻¹) in the dry season. In terms of spatial distribution, the highest concentration of ∑PAHs in the rainy season occurred at Site S2 (Lake Management Station) with 55.39 ng·L⁻¹, followed by S3 (Majiawan) at 41.19 ng·L⁻¹, and the lowest at S1 (Lake Center) with 34.60 ng·L⁻¹. In the dry season, the highest concentration was observed at S3 (61.00 ng·L⁻¹), followed by S2 (57.26 ng·L⁻¹), and the lowest again at S1 (51.85 ng·L⁻¹).
(3) Source apportionment using the PMF model indicated that the sources of PAHs varied with season. During the rainy season, the primary sources were industrial emissions (31.9%) and petroleum product volatilization and combustion (29.5%), followed by coal and biomass combustion (21.4%) and traffic emissions (17.1%). In contrast, during the dry season, PAHs mainly originated from mixed coal and biomass combustion (55.0%) and biomass combustion (25.2%), with industrial sources (18.1%) and traffic emissions (1.7%) playing relatively minor roles.
(4) Ecological risk assessment revealed that the PAHs in Qilu Lake posed low to moderate ecological risks. Among the detected PAHs, Ace, Flu, and Ant were identified as the main ecological risk contributors, while BaA and BkF, despite their low concentrations, should not be neglected. Most sampling sites in the rainy season (S1 and S3) were at low ecological risk levels, whereas occasional moderate risks were observed at S2 during the rainy season and at all sites (S1, S2, and S3) during the dry season, suggesting the need for targeted mitigation and management measures.
CRediT authorship contribution statement
Guowen Li: Writing - original draft, Investigation, Methodology, Formal Analysis, Data curation, Conceptualization. Shujuan Liu: Writing - review & editing, Supervision, Software, Funding acquisition, Project administration, Conceptualization. Liying Zhou: Investigation, Data curation, Conceptualization.
Declaration of competing interest
The authors declare that they have no known competing financial interests or personal relationships that could have appeared to inffuence the work reported in this paper.
Acknowledgments
This work was ffnancially supported by the Yunnan Provincial Department of Education Scientific
Research Fund Project ( grant number 2024J0888 ). We would like to thank EWA Publishing ( https://www.ewapublishing.cn/ ) for English language editing.
References
[1]. TANG Feng, SHA Qing-e, LIU Ying-ying, et al. Evolutionary characteristics of anthropogenic polycyclic aromatic hydrocarbon emissions in Guangdong Province from 2006 to 2020 [J]. China Environmental Science, 2025, 45(1): 19-29.
[2]. QI P Z, QU C K, ALBANESE S, et al. Investigation of polycyclic aromatic hydrocarbons in soils from Caserta provincial territory, southern Italy: Spatial distribution, source apportionment, and risk assessment [J]. J Hazard Mater, 2020, 383: 121158.
[3]. CHEN Y L, SONG R R, LI P, et al. Spatiotemporal distribution, sources apportionment and ecological risks of PAHs: A study in the Wuhan section of the Yangtze River [J]. Environmental Geochemistry and Health, 2023, 45: 7405-7424.
[4]. NA M L, ZHAO Y M, SU R N, et al. Residues, potential source and ecological risk assessment of polycyclic aromatic hydrocarbons (PAHs) in surface water of the East Liao River, Jilin Province, China [J]. Science of the Total Environment, 2023, 886: 163977.
[5]. CORINA C T, ELISABETAIRINA G, CARMEN C L, et al. Distribution, sources and ecological risk assessment of polycyclic aromatic hydrocarbons in waters and sediments from Olt River dam reservoirs in Romania [J]. Chemosphere, 2022, 311(P2): 137024.
[6]. CHEN C F, JU Y R, SU Y C, et al. Distribution, sources, and behavior of PAHs in estuarine water systemsexemplified by Salt River Taiwan [J]. Marine Pollution Bulletin, 2020, 154: 111029.
[7]. WU Xi-jun, DONG Ying, ZHAO Jian, et al. Occurrence Characteristics, Sources, and Toxicity Risk Analysis of Polycyclic Aromatic Hydrocarbons in Typical Rivers of Northern Shaanxi Mining Area, China [J]. Environmental Science, 2023, 44(4): 2040-2051.
[8]. JIN Miao, WU Jing-lu, ZHAN Shu-ie, Shakhimardan Shaniyazov. Distribution, sources and risk assessment of polycyclic aromatic hydrocarbons (PAHs) in waters of Amu Darya Basin, Uzbekistan [J]. Journal of Lake Sciences, 2022, 34(3): 855-867.
[9]. WEN Jia-le, LI Yan, LI Ye, et al. The spatial distribution, source and risk of polycyclic aromatic hydrocarbon in surface sediments of Lake Taihu [J]. Journal of Lake Sciences, 2024, 36(4): 1082-1095.
[10]. CHENG Shu-yan, MA Xiao-hua, WAN Hong-bin, et al. Vertical distribution and source analysis of polycyclic aromatic hydrocarbons in sediments from Songhuaba Reservoir in Kunming City [J]. Research of Environmental Sciences, 2019, 32(4): 593-600.
[11]. SIDDIQUI M H, BHANBHRO U, SHAIKH K, et al. Seasonal occurrence and ecological risk assessment of polycyclic aromatic hydrocarbons in the sediments and water in the left-bank canals of Indus River, Pakistan [J]. Environ Monit Assess, 2024, 196: 1165.
[12]. AMBADE B, SETHI S S, KURWADKAR S, et al. Toxicity and health risk assessment of polycyclic aromatic hydrocarbons in surface water, sediments and groundwater vulnerability in Damodar River Basin [J]. Groundwater for Sustainable Development, 2021, 13: 100553.
[13]. ZHANG Xi-tao, PENG Shu-chuan, WANG Ji-zhong, et al. Pollution characteristics, source apportionment and risk assessment of polycyclic aromatic hydrocarbons in Lake Chaohu [J]. Acta Scientiae Circumstantiae, 2023, 43(5): 47-57.
[14]. GAO Zhan-qi, BI Feng-zhi, HU Guan-jiu, et al. Spatiotemporal distribution characteristics and risk assessment of PAHs in Luoma Lake and its inflow river [J]. Environmental Protection Science, 2022, 48(6): 138-144.
[15]. ZHANG Yuan-chen, CHEN Jia-wei, PAN Lu, et al. Distribution characteristics, sources and ecological risk assessment of polycyclic aromatic hydrocarbons in the water of the Huai River (Anhui section) [J]. Journal of Xinyu University, 2023, 28(2): 25-32.
[16]. ZHAO Z H, GONG X H, ZHANG L, et al. Riverine transport and water-sediment exchange ofpolycyclic aromatic hydrocarbons (PAHs) along the middle-lower Yangtze River, China [J]. Journal of Hazardous Materials, 2021, 403: 123973.
[17]. LI R W, PANG H, GUO Y, et al. Distribution of Polycyclic Aromatic Hydrocarbons and Pesticides in Danjiangkou Reservoir and Evaluation of Ecological Risk [J]. Toxics, 2024, 12(12): 859.
[18]. CAO Y X, XIN M, WANG B D, et al. Spatiotemporal distribution, source, and ecological risk of polycyclic aromatic hydrocarbons (PAHs) in the urbanized semi-enclosed Jiaozhou Bay, China [J]. Science of TheTotal Environment, 2020, 717: 137224.
[19]. QIN Yu, GONG Xiong-hu, WEI Hao-yuan, et al. Pollution characteristics of polycyclic aromatic hydrocarbons (PAHs) in waters of typical rivers in the southwest foothills of the Great Khingan Mountains [J]. Environmental Chemistry, 2024, 43(9): 3054-3069.
[20]. CHENG X, WANG S R, DONG Y, et al. Spatiotemporal Analysis and Risk Prediction of Water Quality Using Copula Bayesian Networks: A Case in Qilu Lake, China [J]. Processes, 2024, 12(12): 2922.
[21]. TANG Zhong-ao, YANG Chang-liang, LIU Wen-qing, et al. Study on the vertical distribution characteristics of nitrogen and phosphorus in the sediment of estuarine wetland of Qilu Lake [J]. Environmental Chemistry, 2025, 44(2): 522-536.
[22]. WANG Yong-qiang, GUO Xiao-chun, Lu Shao-yong, et al. Spatial distribution, related environmental factors and health risk assessment of microcystins in Lake Qilu, a eutrophic plateau lake [J]. Journal of Lake Sciences, 2024, 36(1): 52-63.
[23]. YIN peng-fei, XIONG jin, JIA Yu-xin, et al. Spatial distribution and evaluation of nutrients and grain size in surface sediments of Qilu Lake [J]. Environmental Science & Technology, 2023, 46(10): 32-41.
[24]. LIU Shu-juan, Li Guo-wen, Li Yuan, et al. Establishment and application of 16 polycyclic aromatic hydrocarbons in surface water around coking enterprises by gas chromatography-mass spectrometry [J]. Chemical Research and Application, 2024, 36(1): 211-219.
[25]. SUN Hai-feng, ZHANG Yong, XIE Jing-fang. Applications of Positive Matrix Factorization (PMF) for Source Apportionment of PAHs in the Environment [J]. Asian journal of ecotoxicology, 2015, 10(4): 25-33.
[26]. ZHANG Chao, QIN Chao-jie, FAN Xi, et al. 2024.Distribution, sources and risk assessment of polycyclic aromatic hydrocarbons (PAHs) in water and sediments from the Maxi River Basin in Fuling shale gas field, Chongqing [J]. Acta Scientiae Circumstantiae, 44(4): 133-144.
[27]. SUN Hui-lin, LI Tian-yan, ZHOU Xiao-juan, et al. Climate Change Trends and Characteristics of Yuxi in Recent 54 Years [J]. Journal of Yunnan Normal University(Natural Sciences Edition), 2016, 36(5): 67-73.
[28]. Li Tao, WANG Yu, XU feng, et al. Pollution Characteristics, Source Apportionment and Risk Assessment of Polycyclic Aromatic Hydrocarbons in Surface Water from Taihu Lake Basin [J]. 2018, 41(11): 198-204.
[29]. ADEKUNLE S A, OYEKUNLE O A J, OLADELE S A, et al. Evaluation of Polycyclic Aromatic Hydrocarbons (PAHs) and Health Risk Assessment of Surface Water and Sediments of River Sasa, Ife North Local Government Area, Nigeria [J]. Chemistry Africa, 2020, 3(4): 1-14.
[30]. KAFILZADEH F. Distribution and sources of polycyclic aromatic hydrocarbons in water and sediments of the Soltan Abad River, Iran [J]. The Egyptian Journal of Aquatic Research, 2015, 41(3): 227-231.
[31]. YAO K, XIE Z L, ZHI L H, et al. Polycyclic AromaticHydrocarbons in the Water Bodies of Dong Lake and Tangxun Lake, China: Spatial Distribution, Potential Sources and Risk Assessment [J]. Water, 2023, 15: 2416.
[32]. LI Shu-yin, GUO Wen-si, LI Rui-wen, et al. The pollution characteristics, sources and ecological risk of polycyclic aromatic hydrocarbons (PAHs) in the water environment of Danjiangkou Reservoir [J]. Journal of Henan Normal University (Natural Science Edition), 2024, 52, (4): 36-48.
[33]. WU Hai-juan, GAO Li, LI Fu-juan, et al. Pollution Characteristics, Source Analysis, and Ecological Risk Assessment of Polycyclic Aromatic Hydrocarbons in the Third Drain of Ningxia [J]. Environmental Science, 2024, 45(9): 5254-5263.
[34]. WAN Hong-bin, ZHOU Juan, LUO Duan, et al. Distribution, source characteristics and ecological risk assessment of polycyclic aromatic hydrocarbons in surface sediments of lakes along the middle reaches of the Yangtze River [J]. Journal of Lake Sciences, 2020, 32(6): 1632-1645.
[35]. ZHANG Fu-ying, XU Ming, ZHOU Zeng-xing, et al. Pollution Status and Sources of Polycyclic Aromatic Hydrocarbons and Phthalates in Soil of Industrial Parks in Yangtze River Delta [J]. Journal of Ecology and Rural Environment, 2023, 39(8): 1077-1085.
[36]. MA Ke-jing, SUN Li-juan. Characterization and Source Apportionment of Polycyclic Aromatic Hydrocarbons in PM2.5in Lanzhou [J]. Environmental Science, 2023, 44(11): 5997-6006.
[37]. HE Bo-wen, NIE Sai-sai, LI Yi-lin, et al. Seasonal Distribution Characteristics, Source Analysis, and Health Risk Evaluation of PAHs in PM2.5in Chengde [J]. Environmental Science, 2022, 43(5): 2343-2354.
[38]. WANG Peng-cheng, YANG Ling-xiao, BIE Shu-jun, et al. Pollution Characteristics and Source Analysis of Atmospheric PM2.5-bound Polycyclic Aromatic Hydrocarbons in a Port Area [J]. Environmental Science, 2022, 43(9): 4458-4466.
[39]. MIAO X Y, HAO Y P, CAI J W, et al. The distribution, sources and health risk of polycyclic aromatic hydrocarbons (PAHs) in sediments of Liujiang River Basin: A field study in typical karstic river [J]. Marine pollution bulletin, 2023, 188: 114666.
[40]. LI Guo-wen, SHI Yan-feng, LIU Shu-juan. Variation features and risk assessment of PAEs for lake-reservoir type drinking water sources [J]. Yangtze River, 2024, 55(10): 77-85.
Cite this article
Li,G.;Liu,S.;Zhou,L. (2025). Occurrence, Sources, and Ecological Risks of Polycyclic Aromatic Hydrocarbons in the Surface Water of Qilu Lake, a Low-latitude Plateau Lake. Theoretical and Natural Science,118,44-62.
Data availability
The datasets used and/or analyzed during the current study will be available from the authors upon reasonable request.
Disclaimer/Publisher's Note
The statements, opinions and data contained in all publications are solely those of the individual author(s) and contributor(s) and not of EWA Publishing and/or the editor(s). EWA Publishing and/or the editor(s) disclaim responsibility for any injury to people or property resulting from any ideas, methods, instructions or products referred to in the content.
About volume
Volume title: Proceedings of the 3rd International Conference on Environmental Geoscience and Earth Ecology
© 2024 by the author(s). Licensee EWA Publishing, Oxford, UK. This article is an open access article distributed under the terms and
conditions of the Creative Commons Attribution (CC BY) license. Authors who
publish this series agree to the following terms:
1. Authors retain copyright and grant the series right of first publication with the work simultaneously licensed under a Creative Commons
Attribution License that allows others to share the work with an acknowledgment of the work's authorship and initial publication in this
series.
2. Authors are able to enter into separate, additional contractual arrangements for the non-exclusive distribution of the series's published
version of the work (e.g., post it to an institutional repository or publish it in a book), with an acknowledgment of its initial
publication in this series.
3. Authors are permitted and encouraged to post their work online (e.g., in institutional repositories or on their website) prior to and
during the submission process, as it can lead to productive exchanges, as well as earlier and greater citation of published work (See
Open access policy for details).
References
[1]. TANG Feng, SHA Qing-e, LIU Ying-ying, et al. Evolutionary characteristics of anthropogenic polycyclic aromatic hydrocarbon emissions in Guangdong Province from 2006 to 2020 [J]. China Environmental Science, 2025, 45(1): 19-29.
[2]. QI P Z, QU C K, ALBANESE S, et al. Investigation of polycyclic aromatic hydrocarbons in soils from Caserta provincial territory, southern Italy: Spatial distribution, source apportionment, and risk assessment [J]. J Hazard Mater, 2020, 383: 121158.
[3]. CHEN Y L, SONG R R, LI P, et al. Spatiotemporal distribution, sources apportionment and ecological risks of PAHs: A study in the Wuhan section of the Yangtze River [J]. Environmental Geochemistry and Health, 2023, 45: 7405-7424.
[4]. NA M L, ZHAO Y M, SU R N, et al. Residues, potential source and ecological risk assessment of polycyclic aromatic hydrocarbons (PAHs) in surface water of the East Liao River, Jilin Province, China [J]. Science of the Total Environment, 2023, 886: 163977.
[5]. CORINA C T, ELISABETAIRINA G, CARMEN C L, et al. Distribution, sources and ecological risk assessment of polycyclic aromatic hydrocarbons in waters and sediments from Olt River dam reservoirs in Romania [J]. Chemosphere, 2022, 311(P2): 137024.
[6]. CHEN C F, JU Y R, SU Y C, et al. Distribution, sources, and behavior of PAHs in estuarine water systemsexemplified by Salt River Taiwan [J]. Marine Pollution Bulletin, 2020, 154: 111029.
[7]. WU Xi-jun, DONG Ying, ZHAO Jian, et al. Occurrence Characteristics, Sources, and Toxicity Risk Analysis of Polycyclic Aromatic Hydrocarbons in Typical Rivers of Northern Shaanxi Mining Area, China [J]. Environmental Science, 2023, 44(4): 2040-2051.
[8]. JIN Miao, WU Jing-lu, ZHAN Shu-ie, Shakhimardan Shaniyazov. Distribution, sources and risk assessment of polycyclic aromatic hydrocarbons (PAHs) in waters of Amu Darya Basin, Uzbekistan [J]. Journal of Lake Sciences, 2022, 34(3): 855-867.
[9]. WEN Jia-le, LI Yan, LI Ye, et al. The spatial distribution, source and risk of polycyclic aromatic hydrocarbon in surface sediments of Lake Taihu [J]. Journal of Lake Sciences, 2024, 36(4): 1082-1095.
[10]. CHENG Shu-yan, MA Xiao-hua, WAN Hong-bin, et al. Vertical distribution and source analysis of polycyclic aromatic hydrocarbons in sediments from Songhuaba Reservoir in Kunming City [J]. Research of Environmental Sciences, 2019, 32(4): 593-600.
[11]. SIDDIQUI M H, BHANBHRO U, SHAIKH K, et al. Seasonal occurrence and ecological risk assessment of polycyclic aromatic hydrocarbons in the sediments and water in the left-bank canals of Indus River, Pakistan [J]. Environ Monit Assess, 2024, 196: 1165.
[12]. AMBADE B, SETHI S S, KURWADKAR S, et al. Toxicity and health risk assessment of polycyclic aromatic hydrocarbons in surface water, sediments and groundwater vulnerability in Damodar River Basin [J]. Groundwater for Sustainable Development, 2021, 13: 100553.
[13]. ZHANG Xi-tao, PENG Shu-chuan, WANG Ji-zhong, et al. Pollution characteristics, source apportionment and risk assessment of polycyclic aromatic hydrocarbons in Lake Chaohu [J]. Acta Scientiae Circumstantiae, 2023, 43(5): 47-57.
[14]. GAO Zhan-qi, BI Feng-zhi, HU Guan-jiu, et al. Spatiotemporal distribution characteristics and risk assessment of PAHs in Luoma Lake and its inflow river [J]. Environmental Protection Science, 2022, 48(6): 138-144.
[15]. ZHANG Yuan-chen, CHEN Jia-wei, PAN Lu, et al. Distribution characteristics, sources and ecological risk assessment of polycyclic aromatic hydrocarbons in the water of the Huai River (Anhui section) [J]. Journal of Xinyu University, 2023, 28(2): 25-32.
[16]. ZHAO Z H, GONG X H, ZHANG L, et al. Riverine transport and water-sediment exchange ofpolycyclic aromatic hydrocarbons (PAHs) along the middle-lower Yangtze River, China [J]. Journal of Hazardous Materials, 2021, 403: 123973.
[17]. LI R W, PANG H, GUO Y, et al. Distribution of Polycyclic Aromatic Hydrocarbons and Pesticides in Danjiangkou Reservoir and Evaluation of Ecological Risk [J]. Toxics, 2024, 12(12): 859.
[18]. CAO Y X, XIN M, WANG B D, et al. Spatiotemporal distribution, source, and ecological risk of polycyclic aromatic hydrocarbons (PAHs) in the urbanized semi-enclosed Jiaozhou Bay, China [J]. Science of TheTotal Environment, 2020, 717: 137224.
[19]. QIN Yu, GONG Xiong-hu, WEI Hao-yuan, et al. Pollution characteristics of polycyclic aromatic hydrocarbons (PAHs) in waters of typical rivers in the southwest foothills of the Great Khingan Mountains [J]. Environmental Chemistry, 2024, 43(9): 3054-3069.
[20]. CHENG X, WANG S R, DONG Y, et al. Spatiotemporal Analysis and Risk Prediction of Water Quality Using Copula Bayesian Networks: A Case in Qilu Lake, China [J]. Processes, 2024, 12(12): 2922.
[21]. TANG Zhong-ao, YANG Chang-liang, LIU Wen-qing, et al. Study on the vertical distribution characteristics of nitrogen and phosphorus in the sediment of estuarine wetland of Qilu Lake [J]. Environmental Chemistry, 2025, 44(2): 522-536.
[22]. WANG Yong-qiang, GUO Xiao-chun, Lu Shao-yong, et al. Spatial distribution, related environmental factors and health risk assessment of microcystins in Lake Qilu, a eutrophic plateau lake [J]. Journal of Lake Sciences, 2024, 36(1): 52-63.
[23]. YIN peng-fei, XIONG jin, JIA Yu-xin, et al. Spatial distribution and evaluation of nutrients and grain size in surface sediments of Qilu Lake [J]. Environmental Science & Technology, 2023, 46(10): 32-41.
[24]. LIU Shu-juan, Li Guo-wen, Li Yuan, et al. Establishment and application of 16 polycyclic aromatic hydrocarbons in surface water around coking enterprises by gas chromatography-mass spectrometry [J]. Chemical Research and Application, 2024, 36(1): 211-219.
[25]. SUN Hai-feng, ZHANG Yong, XIE Jing-fang. Applications of Positive Matrix Factorization (PMF) for Source Apportionment of PAHs in the Environment [J]. Asian journal of ecotoxicology, 2015, 10(4): 25-33.
[26]. ZHANG Chao, QIN Chao-jie, FAN Xi, et al. 2024.Distribution, sources and risk assessment of polycyclic aromatic hydrocarbons (PAHs) in water and sediments from the Maxi River Basin in Fuling shale gas field, Chongqing [J]. Acta Scientiae Circumstantiae, 44(4): 133-144.
[27]. SUN Hui-lin, LI Tian-yan, ZHOU Xiao-juan, et al. Climate Change Trends and Characteristics of Yuxi in Recent 54 Years [J]. Journal of Yunnan Normal University(Natural Sciences Edition), 2016, 36(5): 67-73.
[28]. Li Tao, WANG Yu, XU feng, et al. Pollution Characteristics, Source Apportionment and Risk Assessment of Polycyclic Aromatic Hydrocarbons in Surface Water from Taihu Lake Basin [J]. 2018, 41(11): 198-204.
[29]. ADEKUNLE S A, OYEKUNLE O A J, OLADELE S A, et al. Evaluation of Polycyclic Aromatic Hydrocarbons (PAHs) and Health Risk Assessment of Surface Water and Sediments of River Sasa, Ife North Local Government Area, Nigeria [J]. Chemistry Africa, 2020, 3(4): 1-14.
[30]. KAFILZADEH F. Distribution and sources of polycyclic aromatic hydrocarbons in water and sediments of the Soltan Abad River, Iran [J]. The Egyptian Journal of Aquatic Research, 2015, 41(3): 227-231.
[31]. YAO K, XIE Z L, ZHI L H, et al. Polycyclic AromaticHydrocarbons in the Water Bodies of Dong Lake and Tangxun Lake, China: Spatial Distribution, Potential Sources and Risk Assessment [J]. Water, 2023, 15: 2416.
[32]. LI Shu-yin, GUO Wen-si, LI Rui-wen, et al. The pollution characteristics, sources and ecological risk of polycyclic aromatic hydrocarbons (PAHs) in the water environment of Danjiangkou Reservoir [J]. Journal of Henan Normal University (Natural Science Edition), 2024, 52, (4): 36-48.
[33]. WU Hai-juan, GAO Li, LI Fu-juan, et al. Pollution Characteristics, Source Analysis, and Ecological Risk Assessment of Polycyclic Aromatic Hydrocarbons in the Third Drain of Ningxia [J]. Environmental Science, 2024, 45(9): 5254-5263.
[34]. WAN Hong-bin, ZHOU Juan, LUO Duan, et al. Distribution, source characteristics and ecological risk assessment of polycyclic aromatic hydrocarbons in surface sediments of lakes along the middle reaches of the Yangtze River [J]. Journal of Lake Sciences, 2020, 32(6): 1632-1645.
[35]. ZHANG Fu-ying, XU Ming, ZHOU Zeng-xing, et al. Pollution Status and Sources of Polycyclic Aromatic Hydrocarbons and Phthalates in Soil of Industrial Parks in Yangtze River Delta [J]. Journal of Ecology and Rural Environment, 2023, 39(8): 1077-1085.
[36]. MA Ke-jing, SUN Li-juan. Characterization and Source Apportionment of Polycyclic Aromatic Hydrocarbons in PM2.5in Lanzhou [J]. Environmental Science, 2023, 44(11): 5997-6006.
[37]. HE Bo-wen, NIE Sai-sai, LI Yi-lin, et al. Seasonal Distribution Characteristics, Source Analysis, and Health Risk Evaluation of PAHs in PM2.5in Chengde [J]. Environmental Science, 2022, 43(5): 2343-2354.
[38]. WANG Peng-cheng, YANG Ling-xiao, BIE Shu-jun, et al. Pollution Characteristics and Source Analysis of Atmospheric PM2.5-bound Polycyclic Aromatic Hydrocarbons in a Port Area [J]. Environmental Science, 2022, 43(9): 4458-4466.
[39]. MIAO X Y, HAO Y P, CAI J W, et al. The distribution, sources and health risk of polycyclic aromatic hydrocarbons (PAHs) in sediments of Liujiang River Basin: A field study in typical karstic river [J]. Marine pollution bulletin, 2023, 188: 114666.
[40]. LI Guo-wen, SHI Yan-feng, LIU Shu-juan. Variation features and risk assessment of PAEs for lake-reservoir type drinking water sources [J]. Yangtze River, 2024, 55(10): 77-85.