


1. Introduction
Artificial Intelligence (AI) is increasingly becoming part of everyday life, especially in fields like healthcare, education, and entertainment. As its use expands, it's vital to understand how knowledge about AI impacts trust. Understanding AI involves knowing how it operates, what it can achieve, and its limitations. Trusting AI means believing that these systems are dependable, fair, and safe. This research delves into the relationship between knowledge of AI and trust, highlighting its complexity. People who grasp AI might trust it more because they understand its workings. For instance, knowing that AI relies on data to make decisions might make its recommendations more acceptable. However, individuals with in-depth AI knowledge might also be concerned about issues like bias or privacy risks, which could diminish trust. The research aims to test the relationship between AI literacy and the degree of trust. Understanding the link between AI literacy and trust is crucial. It can lead to better educational initiatives, enabling people to make informed choices about AI. It can also guide the development of AI systems that are transparent, fair, and straightforward, thereby boosting trust. Furthermore, it can tackle concerns or misunderstandings that might hinder trust or acceptance of AI.
This study uses multiple methods such as linear regression model and survey to investigate about the relationship between AI cognition and its degree of trust. In essence, this research aims to examine the impact of AI knowledge on trust.
2. Literature review
The relationship between AI literacy and trust in AI systems has garnered increasing attention in recent years, as AI technologies become more integrated into daily life. This section reviews existing research on AI literacy, trust in AI, and the interplay between the two, highlighting key findings, gaps, and areas for further exploration.
2.1. AI literacy: definition and importance
AI literacy refers to an individual’s ability to understand, use, and critically evaluate AI technologies. It encompasses technical knowledge (e.g., how AI algorithms work), ethical awareness (e.g., understanding biases or privacy concerns), and practical skills (e.g., interacting with AI systems). Research has shown that AI literacy is crucial for empowering users to engage with AI technologies effectively and responsibly [1]. For example, studies have found that individuals with higher AI literacy are better equipped to recognize the limitations of AI and make informed decisions about its use [2]. However, levels of AI literacy vary widely among the general public, with many people lacking a basic understanding of how AI works [3].
2.2. Trust in AI: factors and challenges
Trust in AI is a multidimensional concept that involves confidence in the reliability, fairness, and safety of AI systems. Research has identified several factors that influence trust, including transparency, explainability, and perceived competence of AI [4]. For instance, systems that provide clear explanations for their decisions are more likely to be trusted by users [5]. However, trust can be easily eroded by issues such as algorithmic bias, lack of accountability, or unexpected failures [6]. Studies have also shown that trust in AI is not static; it evolves over time as users gain more experience with the technology [7].
2.3. The relationship between AI literacy and trust
The connection between AI literacy and trust is complex and bidirectional. On one hand, higher AI literacy can enhance trust by enabling users to understand how AI systems work and appreciate their benefits. For example, individuals who understand the data-driven nature of AI may be more likely to trust its recommendations [8]. On the other hand, increased AI literacy can also lead to greater skepticism, as users become more aware of potential risks, such as biases or ethical concerns [9]. This duality suggests that the relationship between AI literacy and trust is not straightforward and may depend on contextual factors, such as the type of AI system or the user’s prior experiences.
2.4. Gaps in the literature
While existing research provides valuable insights into AI literacy and trust, several gaps remain. First, most studies focus on either AI literacy or trust in isolation, with limited exploration of how the two concepts interact. Second, there is a lack of empirical evidence on how different dimensions of AI literacy (e.g., technical knowledge vs. ethical awareness) influence trust. Third, the role of demographic factors, such as age, education, or cultural background, in shaping the relationship between AI literacy and trust has not been thoroughly examined. Finally, there is a need for longitudinal studies to understand how trust evolves as users gain more experience and knowledge about AI.
2.5. Theoretical frameworks
Several theoretical frameworks have been used to study trust in technology, including the Technology Acceptance Model (TAM) and the Trust in Automation framework [7]. These frameworks emphasize the importance of perceived usefulness, ease of use, and transparency in building trust. More recently, researchers have proposed models that integrate AI literacy as a key factor influencing trust [6]. These models suggest that enhancing AI literacy can improve trust by increasing users’ understanding of AI systems and reducing uncertainty.
2.6. Implications for design and policy
Research on AI literacy and trust has important implications for the design of AI systems and the development of policies. For example, designing AI systems that are transparent, explainable, and user-friendly can help bridge the gap between AI literacy and trust [10]. Additionally, educational initiatives aimed at improving AI literacy can empower users to engage with AI technologies more confidently and critically [1]. Policymakers can also play a role by promoting ethical AI practices and ensuring that AI systems are accountable and fair.
2.7. Summary
The literature highlights the importance of understanding the relationship between AI literacy and trust in AI systems. While higher AI literacy can enhance trust by improving users’ understanding of AI, it can also lead to greater skepticism if users become aware of potential risks. Addressing the gaps in the literature, such as the need for more empirical studies and the exploration of demographic factors, can provide deeper insights into this complex relationship. Ultimately, fostering AI literacy and designing trustworthy AI systems are essential steps toward ensuring the responsible and widespread adoption of AI technologies.
3. Methodology
This paper gathered the author’s data collection with a questionnaire containing 21 total questions from different aspects, including “Know and Understand AI,” “Use and Apply AI,” and “Evaluate and Create AI” with other fundamental questions to measure degree of trust and eliminate some confounding variables. The total score in the following study is a score out of 21 and the degree of trust is a score out of 10.
3.1. Data process
3.1.1. Data collection
The data used in this paper were collected by a survey. Since there were no previous examples, the author created a new questionnaire regarding the interaction between AI literacy and users’ trust in AI.
In creating this questionnaire, the author focused on the aforementioned key factors. The dimensions that are selected were designed to comprehensively assess an individual’s understanding of AI from different perspectives. The first dimension, "Know and Understand AI," consists of questions that explore basic knowledge of AI, its core concepts, and how various AI techniques function. Each question is supported by a reference, ensuring that respondents are tested on well-established AI theories and practices. For example, question one asks respondents to identify the definition of AI, with the correct answer explaining that AI involves machines simulating human intelligence, as outlined by Russell and Norvig in their work "Artificial Intelligence: A Modern Approach" [11]. Similarly, questions about machine learning, expert systems, and neural networks test the depth of knowledge respondents have about AI technologies and their real-world applications, as seen in the references provided for each question.
The second dimension, "Use and Apply AI," focuses on how AI is applied in various industries such as healthcare, finance, and manufacturing. These questions aim to evaluate whether respondents understand how AI is used to solve practical problems, with each question backed by relevant citations from sources like Esteva et al. [12] and Ricci et al. [13].
Finally, the third dimension, "Evaluate and Create AI," assesses respondents’ ability to evaluate the effectiveness and limitations of AI systems. Questions in this section, such as those addressing overfitting and the bias-variance tradeoff, test whether individuals can understand key machine learning concepts that are essential for evaluating AI systems. The references included, such as Domingos [14] and Bishop [15], provide authoritative sources that ensure respondents' answers reflect established AI principles.
The "Degree of Trust for AI" section draws from the same passage, with each question gauging respondents’ trust in various aspects of AI. The questions focus on factors like reliance on AI for advice, trust in AI’s protection of privacy, and the perceived accuracy of AI responses. These questions were formulated to capture how trust is developed and influenced by users’ experiences and understanding of AI technologies.
This comprehensive structure was designed not only to test AI literacy across multiple dimensions but also to evaluate how trust in AI develops as knowledge increases, allowing for deeper insights into both areas.
3.1.2. Performing cronbach’s analysis
Cronbach's alpha is a statistical measure used to evaluate the internal consistency and reliability of a scale, indicating how closely related its items are in measuring the same construct. Ranging from 0 to 1, values above 0.7 are generally considered acceptable, reflecting a reliable scale. Widely used in social science and psychology research, Cronbach's alpha helps ensure the consistency of multi-item scales, though it does not assess one-dimensionality or validity and should be used alongside other analyses. For the section of “Degree of Trust for AI”, the Cronbach’s alpha was 0.78, which indicates this section of my questionnaire was considered acceptable.
3.2. Regression analysis
The regression analysis can be applied to two fields. First, it can be used to make predictions. Second, it can be used to determine a causal relationship between the X variables (independent variables) and the Y variables (dependent variables).
Regression analysis can be applied to different fields like finance, education, and healthcare. This study offers regression analysis to predict the established trust of AI by multiple X variables (independent variables).
3.2.1. Simple linear regression model
The simple linear regression model to explain the relationship between the degree of AI trust and AI cognition is given by:
 (1)
(1)
After performing R code and a series of techniques, the value of β0 is 6.94140, which indicates the average degree of trust with a score of 0. Moreover, β1 is -0.03024, which means the increment of one score leads to a decrease of 0.03 on one’s degree of trust. Therefore, the fitted equation will be:
 (2)
(2)
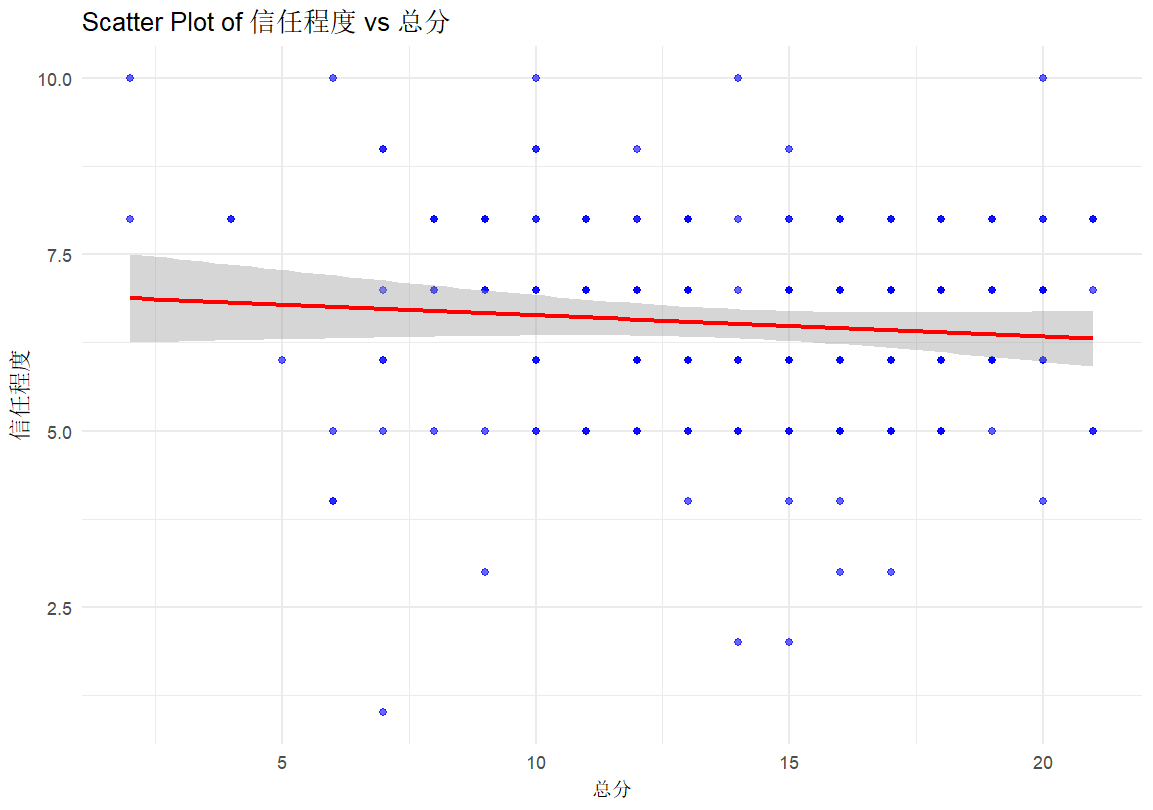
Here, Figure 1 is a visual display of the relationship between the degree of AI trust and AI cognition. The plot in Figure 1 indicates a negative relationship, which means that the more knowledge on AI, the less the degree of trust.
3.2.2. Multiple linear regression model
The multiple linear regression model to explain the relationship between the degree of AI trust and several influential variables is given by:
 (3)
(3)
After performing the R code, the fitted equation will be:
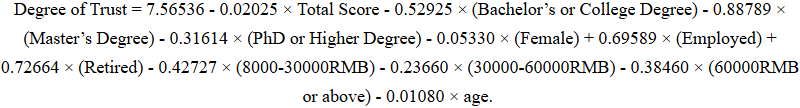 (4)
(4)
The intercept of 7.56536 represents the baseline trust level when all predictors are zero. A one-unit increase in Total Score is associated with a 0.02025 decrease in trust, suggesting that higher scores correspond to slightly lower trust levels. Education level significantly impacts trust, with individuals holding a Bachelor’s or College Degree exhibiting 0.52925 lower trust, those with a Master’s Degree showing 0.88789 lower trust, and individuals with a PhD or higher degree having 0.31614 lower trust, all compared to the reference group of individuals with less than a college degree. Gender differences are also observed, with females reporting 0.05330 lower trust than males. Employment status positively influences trust, as employed individuals have 0.69589 higher trust, and retired individuals show a 0.72664 higher trust level compared to the reference group of unemployed or non-working individuals. Income level negatively affects trust, with individuals earning 8,000–30,000 RMB reporting 0.42727 lower trust, those earning 30,000–60,000 RMB showing 0.23660 lower trust, and those earning 60,000 RMB or more exhibiting 0.38460 lower trust, compared to individuals earning less than 8,000 RMB. Finally, age has a small negative effect, with each additional year decreasing trust by 0.01080.
3.2.3. Hypothesis testing
This paper will adopt a well-known procedure (hypothesis testing) to test the significance of AI literacy on AI trust. To perform this method, the null hypothesis will be formulated as AI literacy have no effect on AI trust, while the alternative hypothesis will be formulated as AI literacy has a significant effect on the degree of AI trust.
3.2.4. Backward selection
Since the t-test offers an unexpected outcome with the null hypothesis failing to be rejected, the author tried backward selection to select the most influential variable in this study.
Backward selection is a method used to simplify a statistical model by removing variables that don't significantly affect the outcome. The process starts with all possible variables in the model. Then, one by one, the variables that have the least impact on the model are removed. The decision to remove a variable is typically based on statistical measures, such as p-values or AIC (Akaike Information Criterion). If a variable has a high p-value (usually above 0.05), it means the variable has little effect on the outcome, and it is considered less influential. The process continues until only the most important variables, those that meaningfully contribute to explaining the data, remain. This helps create a simpler, more efficient model that focuses on the key factors that influence the outcome.
|
Variable Removed |
RSS |
AIC |
|
Step 1: Remove Your monthly income |
429.27 |
170.36 |
|
Step 2: Remove Your occupation |
431.02 |
167.09 |
|
Step 3: Remove Your gender |
431.18 |
165.17 |
|
Step 4: Remove Your age |
431.61 |
163.37 |
|
Step 5: Remove Sum |
432.44 |
161.76 |
|
Step 6: Remove Your educational background |
446.44 |
162.20 |
Start with AIC = 175.28 RSS=427.17
Table 1 is the complete process of the backward selection. The AIC is calculated in the following formula: AIC=n⋅ln(RSS/n)+2k, where n is the number of observations in the dataset, and p is the number of parameters in the model.
Starting with an initial Akaike Information Criterion (AIC) score of 175.28 and a residual sum of squares (RSS) of 427.17, the model iteratively removes variables to find the best-fitting model. In the first step, removing the variable "Your Monthly Income" resulted in an RSS of 429.47 and an AIC of 170.36. The second step involved removing "Your Occupation," which led to an RSS of 431.02 and an AIC of 167.09. The third step removed "Your Gender," resulting in an RSS of 431.18 and an AIC of 165.17. In the fourth step, "Your Age" was removed, yielding an RSS of 431.61 and an AIC of 163.37. The fifth step involved removing "Total Score" , which increased the RSS to 432.44 but decreased the AIC to 161.76. Finally, in the sixth step, removing "Your Education Level" resulted in an RSS of 446.44 and an AIC of 162.20. The goal of backward selection is to minimize the AIC, which balances model fit with complexity. During the process, “Your Education Level” remained and was considered the most influential variable since the overall AIC after reducing “Your Education Level” increases. At the same time, age, gender, total score, occupation, and income are not considered much influential.
4. Results
4.1. t-Test
To test our null hypothesis, first, we use the t-test to measure how far the AI literacy (in graph as “Sum” ) t-statistic is from zero.
|
Estimate |
Std. Error |
t value |
Pr(>|t|) |
|
|
(Intercept) |
6.94140 |
0.36691 |
18.918 |
<2e-16 *** |
|
Sum |
-0.03024 |
0.02493 |
-1.213 |
0.227 |
Relative to standard error, a larger value of the t-statistic provides evidence against the null hypothesis and indicates that Y is associated with X. The value Pr(>|t|) indicates that the p value is greater than the t-statistic. The smaller the p value, the more chances to reject the null hypothesis
From Table 2, it is obvious that the value of the t-statistic (for AI literacy score) is not far from zero, and the p value of 0.227> 0.05 indicates that there is not enough evidence to reject the null hypothesis.
Table 3 shows the result of multiple linear regression model.
|
Estimate |
Std. Error |
t value |
Pr(>|t|) |
|
|
(Intercept) |
7.56536 |
0.65637 |
11.526 |
<2e-16 *** |
|
Sum |
-0.02025 |
0.02853 |
-0.710 |
0.479 |
|
Your educational background University (College or Undergraduate) |
-0.52925 |
0.53388 |
-0.991 |
0.323 |
|
Your educational background: master |
-0.88789 |
0.57083 |
-1.551 |
0.122 |
|
Your educational background: Doctor or above |
-0.31614 |
0.78802 |
-0.401 |
0.689 |
|
Your gender: Female |
-0.05330 |
0.22442 |
-0.238 |
0.813 |
|
Your occupation: On-the-job personnel |
0.69589 |
0.63263 |
1.100 |
0.273 |
|
Your occupation: retired personnel |
0.72664 |
0.82259 |
0.883 |
0.378 |
|
Your monthly income: Rmb 8000-30000 |
-0.42727 |
0.50539 |
-0.845 |
0.399 |
|
Your monthly income: Rmb 30000 – 60000 |
-0.23660 |
0.56518 |
-0.419 |
0.676 |
|
Your monthly income: Rmb 60000 above |
-0.38460 |
0.54773 |
-0.702 |
0.483 |
|
Your age |
-0.01080 |
0.01246 |
-0.867 |
0.387 |
From the table, it is obvious that the value of all the t-statistics (for AI literacy score) is not far from zero, and the p-value for all groups is above 0.05. This indicates that there is not enough evidence to reject the null hypothesis.
4.2. Descriptive statistics
The result of the simple linear regression model is as follows. The residuals of the model show a range from a minimum of -5.7297 to a maximum of 3.6635, with the first quartile (Q1) at -0.7751 and the median at 0.3610, indicating the spread of the data points around the median. The mean total score is 14.1 with a standard deviation of 4.21, suggesting some variability in the scores. The mean trust level is 6.51 with a standard deviation of 1.49, indicating a moderate level of trust among the sample. The total sample size is 202.
The residual standard error is 1.489 with 200 degrees of freedom, which measures the average distance that the observed values fall from the regression line. The R-squared value is 0.00234, indicating that the model explains only a very small portion of the variance in the dependent variable. The F-statistic is 1.471 with 1 and 200 degrees of freedom, and a p-value of 0.2266, indicating that the model is not statistically significant, meaning the predictor variables do not have a strong influence on the response variable.
The result of the multiple linear regression model is as follows. The residuals, which are the differences between observed and predicted values, range from a minimum of -5.6229 to a maximum of 3.5405, with a median of 0.2694. The mean total score is 14.1, with a standard deviation of 4.21, indicating variability in the scores. Trust levels have a mean of 6.51 and a standard deviation of 1.49, suggesting moderate variability in trust. The mean age is 39.6 with a standard deviation of 13.3, reflecting a spread in the age of the sample. The model's residual standard error is 1.499, indicating the average distance that the observed values fall from the regression line. The multiple R-squared value of 0.0432 suggests that the model explains only about 4.32% of the variance in the dependent variable. The adjusted R-squared is -0.01219, indicating that the model does not fit the data well when considering the number of predictors. The F-statistic is 0.7799 with 11 and 190 degrees of freedom, and the p-value is 0.6599, which suggests that the model is not statistically significant, meaning the predictor variables do not have a strong influence on the response variable.
5. Discussion
This research reveals a weak negative relationship between AI literacy and trust in AI, which is unexpected and contrasts with prior studies that typically suggest a positive or neutral correlation. Although the results of this study do not reach statistical significance, the method used in the questionnaire is an effective tool for data collection. The lack of statistical significance may be attributed to factors such as a limited sample size (202 respondents), time constraints, or other confounding variables. Despite this, the questionnaire demonstrates a Cronbach’s alpha above 0.7 and includes questions that are well-suited to examine the topic. It may serve as a useful resource for other researchers in the field and help fill in the gap in literature.
Additionally, the study contributes to the ongoing discussion on AI literacy and trust by exploring how understanding AI can influence perceptions of its trustworthiness. It provides valuable insights into the role that knowledge plays in shaping public trust in AI systems. Given the weak relationship observed, further research is needed to explore other factors that might impact this dynamic. For policy and educational design, this study suggests the need for future work to address the gaps in AI literacy and trust, particularly by evaluating how various educational interventions or communication strategies might improve both knowledge and trust levels among users.
6. Conclusion
In conclusion, this study reveals an unexpected negative relationship between AI literacy and trust in AI. Additionally, the negative adjusted R-squared in the multiple linear regression model suggests that the inclusion of unexplained variables may have contributed to this outcome. The low R-squared and high p-values in both models indicate a weak relationship between the predictors and the outcome. These findings may be attributed to the limited sample size, which could restrict the model's ability to identify significant relationships.
Future research could extend the study period, perhaps over the course of a year, to obtain more reliable results on this topic. Furthermore, the questionnaire developed in this study is available for other researchers to utilize, and expanding the scope to include diverse global populations could yield more generalizable findings and provide deeper insights into the relationship between AI literacy and trust.
References
[1]. Eslami, M., et al. (2019). User attitudes towards algorithmic transparency and accountability. Proceedings of the ACM on Human-Computer Interaction, 3(CSCW), 1-22.
[2]. Hoff, K. A., & Bashir, M. (2015). Trust in automation: Integrating empirical evidence on factors that influence trust. Human Factors, 57(3), 407-422.
[3]. Lee, J. D., & See, K. A. (2004). Trust in automation: Designing for appropriate reliance. Human Factors, 46(1), 50-80.
[4]. Long, D., & Magerko, B. (2020). What is AI literacy? Competencies and design considerations. Proceedings of the 2020 CHI Conference on Human Factors in Computing Systems, 1-13.
[5]. Miller, T. (2019). Explanation in artificial intelligence: Insights from the social sciences. Artificial Intelligence, 267, 1-38.
[6]. Ng, D. T. K., et al. (2021). AI literacy: Definition, teaching, and evaluation. Journal of Educational Computing Research, 58(4), 747-765.
[7]. Ribeiro, M. T., Singh, S., & Guestrin, C. (2016). Why should I trust you? Explaining the predictions of any classifier. Proceedings of the 22nd ACM SIGKDD International Conference on Knowledge Discovery and Data Mining, 1135-1144.
[8]. Shin, D. (2021). The effects of explainability and causability on perception, trust, and acceptance: Implications for explainable AI. International Journal of Human-Computer Studies, 148, 102557.
[9]. Sundar, S. S. (2020). The MAIN model: A heuristic approach to understanding technology effects on credibility. Digital Media, Youth, and Credibility, 47-70.
[10]. Zhang, B., & Dafoe, A. (2019). Artificial intelligence: American attitudes and trends. Oxford University.
[11]. Russell, S., & Norvig, P. (2016). Artificial Intelligence: A Modern Approach (3rd ed.). Pearson.
[12]. Esteva, A., et al. (2017). Dermatologist-level classification of skin cancer with deep neural networks. Nature, 542(7639), 115-118.
[13]. Ricci, F., Rokach, L., & Shapira, B. (2015). Recommender Systems Handbook. Springer.
[14]. Domingos, P. (2015). The Master Algorithm. Basic Books.
[15]. Bishop, C. M. (2006). Pattern Recognition and Machine Learning. Springer.
Cite this article
Feng,G. (2025). The Relationship Between the Degree of AI Cognition and Its Degree of Trust. Theoretical and Natural Science,125,29-38.
Data availability
The datasets used and/or analyzed during the current study will be available from the authors upon reasonable request.
Disclaimer/Publisher's Note
The statements, opinions and data contained in all publications are solely those of the individual author(s) and contributor(s) and not of EWA Publishing and/or the editor(s). EWA Publishing and/or the editor(s) disclaim responsibility for any injury to people or property resulting from any ideas, methods, instructions or products referred to in the content.
About volume
Volume title: Proceedings of CONF-APMM 2025 Symposium: Multi-Qubit Quantum Communication for Image Transmission over Error Prone Channels
© 2024 by the author(s). Licensee EWA Publishing, Oxford, UK. This article is an open access article distributed under the terms and
conditions of the Creative Commons Attribution (CC BY) license. Authors who
publish this series agree to the following terms:
1. Authors retain copyright and grant the series right of first publication with the work simultaneously licensed under a Creative Commons
Attribution License that allows others to share the work with an acknowledgment of the work's authorship and initial publication in this
series.
2. Authors are able to enter into separate, additional contractual arrangements for the non-exclusive distribution of the series's published
version of the work (e.g., post it to an institutional repository or publish it in a book), with an acknowledgment of its initial
publication in this series.
3. Authors are permitted and encouraged to post their work online (e.g., in institutional repositories or on their website) prior to and
during the submission process, as it can lead to productive exchanges, as well as earlier and greater citation of published work (See
Open access policy for details).
References
[1]. Eslami, M., et al. (2019). User attitudes towards algorithmic transparency and accountability. Proceedings of the ACM on Human-Computer Interaction, 3(CSCW), 1-22.
[2]. Hoff, K. A., & Bashir, M. (2015). Trust in automation: Integrating empirical evidence on factors that influence trust. Human Factors, 57(3), 407-422.
[3]. Lee, J. D., & See, K. A. (2004). Trust in automation: Designing for appropriate reliance. Human Factors, 46(1), 50-80.
[4]. Long, D., & Magerko, B. (2020). What is AI literacy? Competencies and design considerations. Proceedings of the 2020 CHI Conference on Human Factors in Computing Systems, 1-13.
[5]. Miller, T. (2019). Explanation in artificial intelligence: Insights from the social sciences. Artificial Intelligence, 267, 1-38.
[6]. Ng, D. T. K., et al. (2021). AI literacy: Definition, teaching, and evaluation. Journal of Educational Computing Research, 58(4), 747-765.
[7]. Ribeiro, M. T., Singh, S., & Guestrin, C. (2016). Why should I trust you? Explaining the predictions of any classifier. Proceedings of the 22nd ACM SIGKDD International Conference on Knowledge Discovery and Data Mining, 1135-1144.
[8]. Shin, D. (2021). The effects of explainability and causability on perception, trust, and acceptance: Implications for explainable AI. International Journal of Human-Computer Studies, 148, 102557.
[9]. Sundar, S. S. (2020). The MAIN model: A heuristic approach to understanding technology effects on credibility. Digital Media, Youth, and Credibility, 47-70.
[10]. Zhang, B., & Dafoe, A. (2019). Artificial intelligence: American attitudes and trends. Oxford University.
[11]. Russell, S., & Norvig, P. (2016). Artificial Intelligence: A Modern Approach (3rd ed.). Pearson.
[12]. Esteva, A., et al. (2017). Dermatologist-level classification of skin cancer with deep neural networks. Nature, 542(7639), 115-118.
[13]. Ricci, F., Rokach, L., & Shapira, B. (2015). Recommender Systems Handbook. Springer.
[14]. Domingos, P. (2015). The Master Algorithm. Basic Books.
[15]. Bishop, C. M. (2006). Pattern Recognition and Machine Learning. Springer.