


1. Introduction
1.1. Background
The International Olympic Committee is gearing up for the 2032 Summer Olympic Games in Brisbane, Australia.Since the birth of the modern Olympic Games, this global sporting event has always been dedicated to demonstrating the limits of human physical and mental ability and promoting friendship and understanding among nations through athletic competition. However, as times have changed, the interests of spectators and the values of the global community have evolved, posing a challenge to the continued appeal and impact of the Games.
In order to maintain the relevance and appeal of the Olympic Games, the IOC is constantly reviewing and adjusting the sports program of the Olympic Games, introducing sports, disciplines or events that resonate with modern values and appeal to a global audience. This strategy not only aims to increase the spectator appeal and participation of the Games, but also to send a positive social message through sport and to promote global cultural exchange and integration. The IOC plans to add flag football, lacrosse and coastal rowing to the 2028 Olympic Games in Los Angeles, and to bring baseball and softball back to the Olympic Games after a 20-year absence. These changes not only reflect the IOC's keen insight into the global sports development trend, but also its continuous optimization and innovation of the Olympic Games program settings.
To guide these decisions, the IOC's Olympic Program Committee has developed a rigorous set of criteria to ensure that each SDE is consistent with the core Olympic values. These criteria include popularity and accessibility, gender equality, sustainability, inclusiveness, relevance and innovation, as well as safety and fair play. These criteria were developed to ensure that the Olympic Games are set up in a way that not only meets the values of modern society, but also attracts the attention of a global audience, while promoting fairness and sustainability in sport and competition.
1.2. Problem restatement
·What factors need to be taken into account when developing the IOC's criteria for evaluating sports, disciplines or events at the Summer Olympic Games to ensure that the selected SDEs are in line with the core Olympic values and appeal to a global audience, while maintaining the continued appeal and impact of the Games?
·Develop an evaluation mathematical model to assess which SDEs best meet the Olympic criteria.
·Select at least three SDEs that were recently added or removed from the Olympics and at least three SDEs that have been in the Olympic program to test the mathematical model developed in Problem 2 and explore the generalizability of the model and the status of these SDEs in the current Olympics.
·Which three SDEs are predicted to be reintroduced to the Olympics in 2032 and which SDEs are likely to be introduced to the Olympics in 2036 and beyond?
·Perform a sensitivity analysis of the model to determine which parameters result in a higher SDE score and discuss whether these parameters are representative of the strengths and weaknesses of the mathematical model?
·Write a letter to the Olympic Committee describing the rationale and results of your model, giving appropriate reasons.
2. Assumptions and justifications
Assumption 1:
Using linear interpolation to fill in missing values accurately reflects the true trend of the data.
Justification 1:
Linear interpolation is a simple and commonly used method of filling in data, which assumes that the data changes linearly between two known points. In cases where the amount of missing data is small and the data distribution around the missing points is relatively uniform, linear interpolation can provide a more reasonable estimate, thus maintaining the continuity and integrity of the data.
Assumption 2:
The four models, Random Forest, BP Neural Network, LSTM model and ARIMA, were able to more accurately predict the trend of sports events after weighted combination.
Justification 2:
Each of these four models has its own advantages, such as Random Forest can deal with nonlinear relationships and a large number of features, BP neural network has strong learning ability, LSTM model is good at dealing with time series data, and
ARIMA model is suitable for short-term prediction. The weighted combination of these models through the entropy weighting method can fully utilize the advantages of each model and improve the accuracy and stability of prediction.
Assumption 3:
The K-mean++ clustering algorithm is effective in clustering emerging sports that fit the public's perception of the Olympics, as well as sports that are likely to be reintroduced to the Olympic program list.
Justification 3:
K-mean++ clustering algorithm is an improved K-means clustering algorithm, which improves the stability and accuracy of clustering by optimizing the selection of the initial clustering centers. The algorithm is able to classify the data into different categories based on their characteristics, thus helping us to filter out emerging sports that meet the public's perception of the Olympics as well as sports that are likely to be reintroduced into the Olympic program list.
Assumption 4:
Assuming that the future impact of social, economic and cultural factors on the development of sports programs is within predictable limits.
Justification 4:
Factors such as force majeure can have a significant impact on reality and these impacts cannot be predicted, so it is assumed that no force majeure exists.
3. Models
3.1. Selection of factors
When the International Olympic Committee organizes the Olympic Games, the selection of sports has its own unique criteria, and this paper aims to help the Olympic Committee to set the criteria and select the suitable sports, the specific factors are shown In Figure 1 below.
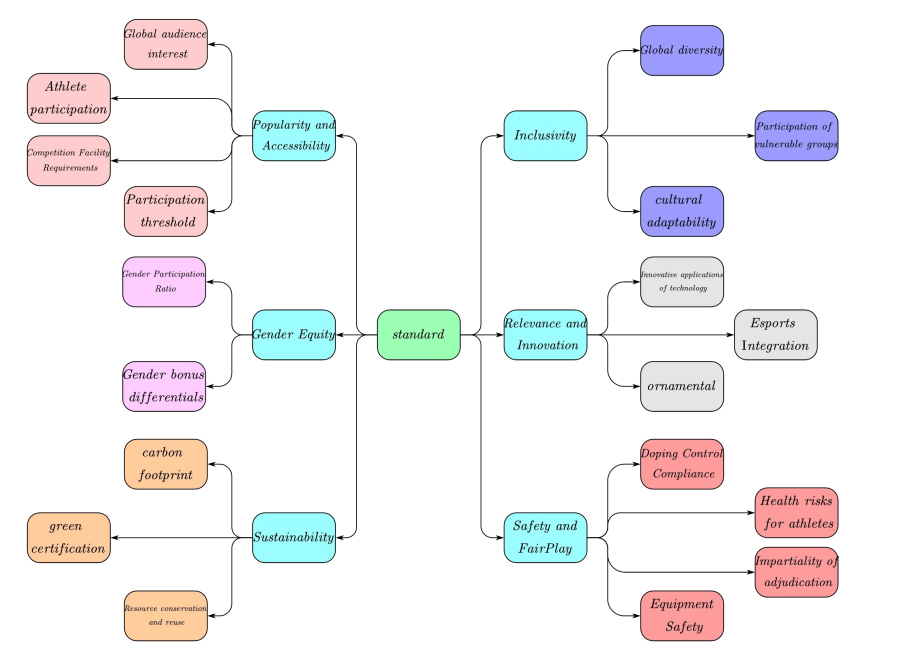
The above indicators are a comprehensive reflection of the set of standards set by the IOC, and can ensure at a deep level that all sports are in line with the Olympic values.
3.2. Combined subjective and objective evaluation model
3.2.1. Extra symbols
|
notation |
hidden meaning |
|
N |
Indicates the number of samples evaluated |
|
mRMR |
denotes the maximum value of the difference between correlation and redundancy |
|
Ej |
denotes the entropy of the jth evaluation index |
|
wj |
denotes the weight of the jth indicator |
|
(AW)i |
denotes the jth element of the vector AW |
|
A |
denote the judgment matrix |
|
W |
denotes a vector of weights |
|
CI |
Indicates a consistency indicator |
|
CR |
Indicates consistency ratio |
|
RI |
Indicates random consistency indicator |
3.2.2. Combined subjective and objective evaluation method
In order to help the IOC evaluate which SDEs are most in line with the standards set for the Olympic Games, a combination of subjective and objective methods was adopted, with the maximum correlation minimum redundancy algorithm and entropy weighting method as the objective evaluation algorithms and the hierarchical analysis method as the subjective algorithm, and the subjective-objective combination of evaluation methods combines both the depth of the subjective feelings and the accuracy of the objective data. Its advantage is that it can comprehensively and integrally reflect the real situation of the evaluated object, taking into account the subjective experience and judgment of human beings, while integrating the objective standards and quantitative data, so as to make the evaluation results more just, reasonable and scientific.
(1) Maximum Correlation Minimum Redundancy Algorithm
In classification problems, the maximum correlation minimum redundancy algorithm is a commonly used feature selection method, the basic principle is to find a set of features in the original feature data that have the greatest relationship with the final output result, but the smallest relationship with other original feature data.
Mutual information is first introduced as a measure of the degree of interdependence between random variables, and mutual information is used to deal with penalizing the correlation between feature data by making them redundant when other selected features are present.
Given two random variables a and b , Their probability density function is p(a),p(b) and p(a, b) ,Then the mutual information is:
feature set s and resemble c the correlation is determined by the individual features fi and resemble c the average of all mutual information between is determined from this:
set s the redundancy of all the features in the feature fi and fj The average of all mutual information between.
The standard mRMR is the maximum value of the difference between correlation and redundancy, defined as follows:
(2) entropy weighting
Entropy weight method is a multi-indicator comprehensive evaluation method for determining the weight of each indicator. It is based on the concept of information entropy, and determines the weights by calculating the entropy value of each indicator to measure the magnitude of its information.
There are a total of N samples being evaluated and a total of 4 evaluation indicators to build the associated judgment matrix.
Normalize A for the indicator.
The entropy of each evaluation index can be defined from the entropy concept:
The entropy weighting formula for the indicator is further obtained as follows:
Included among these,Ej indicate j entropy of evaluation indicators,wj indicate j Weighting of indicators.
(3) TOPSIS Act
Construct the standardization matrix X, and apply the standardization treatment to the judgment matrix Z to get the standardization matrix . The formula for calculating the value of each indicator is as follows:
Construct the weighted normalization matrix. The weights obtained from the
style='position:absolute;left:0pt;margin-left:-0.2pt;margin-top:17.35pt;height:15.1pt;width:399.35pt;z-index:251659264;mso-width-relative:page;mso-height-relative:page;' />entropy weighting method are [1]combined with the normalization matrix to weighted normalization matrix obtain a formula for its calculation is as follows:
Calculate the positive ideal solution for each evaluation metric Z + and negative ideal solution Z- ,The formula for its calculation is as follows:
Calculate the gap between each evaluation indicator and the positive and negative ideal solutions with the following formula:
Finally, the composite score index of each evaluation index can be obtained through calculation Si . The formula for its calculation is as follows:
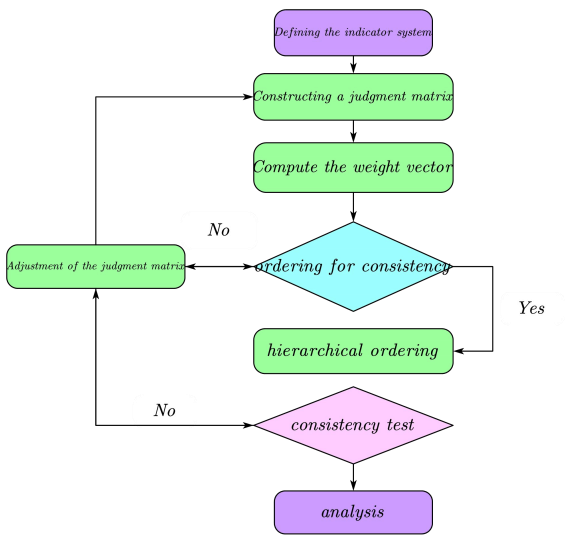
(4) hierarchical analysis
Hierarchical analysis is a decision analysis tool that breaks down a complex problem into its constituent factors and aids decision making by comparing the relative importance of these factors to each other.
The flowchart is shown In Figure 2below.
(5) Combined subjective and objective evaluation algorithms
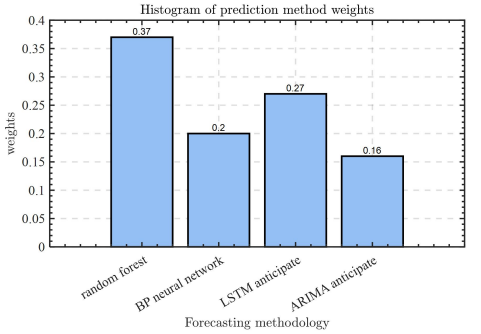
Mainly using the maximum correlation minimum redundancy algorithm to deal with the data of the categorical variables, while the data of the categorical variables account for less in the overall data, [2]using the entropy weighting method and TOPSIS method to deal with the data of the numerical variables, and at the same time, using the hierarchical analysis method to subjectively correct some weights, so that the weights of these four evaluation models are defined as 0.16, 0.25, 0.25, 0.3 according to the proportion of the data, respectively. Thus, the subjective and objective evaluation algorithm is obtained, and the weight histogram is shown In figure 3.
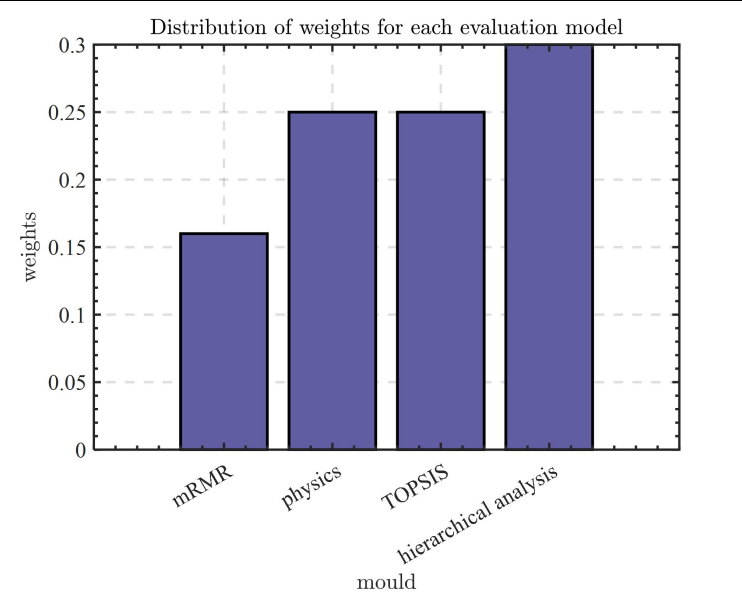
The respective weights ofthe weighted combination models can be more intuitively obtained from In Figure 3, thus reflecting the strength of the model effect.
3.3. Confirmation of SDE's current Olympic status
3.3.1. Extra symbols
|
notation |
hidden meaning |
|
Ψ i and Ψ j |
Indicates known neighboring data points |
|
φi and φj |
Indicates the corresponding point in time |
|
φk |
Indicates the point in time at which interpolation is required |
|
Ψ k and φk |
Denotes the corresponding interpolated value |
|
hi1 |
Representation of values in the implicit layer |
|
un1 |
Denotes the value of the connection between the input layer and the implicit layer |
|
vn1 |
Denotes the value of the link between the implicit layer and the output layer |
|
yt |
Denotes the autocorrelation coefficient |
|
et |
Denotes the error term |
|
ri and θi |
The term representing the demand solution |
3.3.2. Data analysis
It can be seen from the annex that each item has more or less missing values, which will have an impact on the results of the model, so the missing values are filled in using the method of linear interpolation [3].
Linear interpolation is a mathematical method for estimating the value of an unknown data point between two known data points. The basic idea of the method is to assume that the change between two known points is linear and thus use these points to estimate the missing values. The formula for its calculation is given below:
Among them.Ψi and Ψ j are known neighboring data points. φi and φj is the corresponding point in time.φk is the point in time to be interpolated.Ψk because of φk corresponding interpolated values.
Since some items have more missing values and are more concentrated, they are directly filled with 0. The comparison chart between the original data of each index and the data after linear interpolation is finally obtained as shown below In Figure 4.
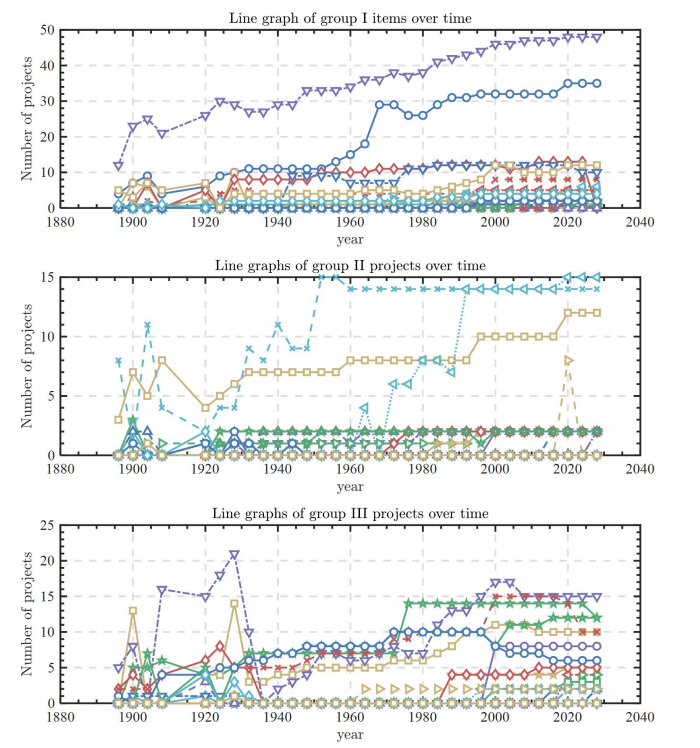
Since plotting the 71 sports items in one line graph is too dense and affects the overall aesthetics, the 71 sports items are divided into 24, 24 and 23 dribbling items, totaling three copies, to enhance the clarity and aesthetics ofthe composition. As can be seen from the figure, the number of most of the sports items is relatively stable, and only a small number of items may have outliers, so box-and-line diagrams are plotted to observe the outliers in each of the 71 sports items.
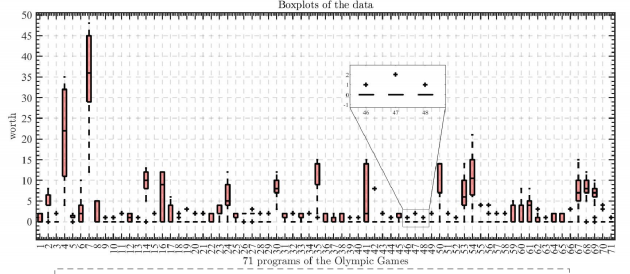
As can be seen In Figure 5, linear interpolation of the data can easily preprocess the data, and in the process of data processing, by comparing the boxplots before and after the interpolation, it can be clearly seen that the number of outliers has been reduced and the overall quality of the data has been improved [4].
3.3.3. Analysis of the result
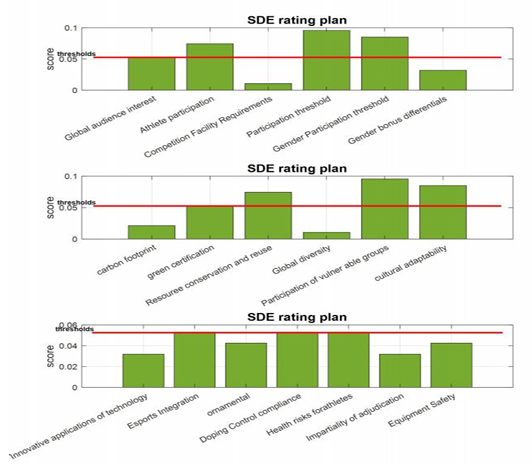
As can be seen In Figure 6, the weighted combination of scoring models for some of the indicators are scored above the queue, respectively: Global audience interest, Athlete participation, Participation threshold, Gemder Participation threshold, green certification, Resouree conservation and reuse, Participation of vulner able groups, cultural adaptability, Esports Integration, Doping Control compliance and Health risks forathletes. Therefore, these indicators are used to make a selection of future SDEs.
3.3.4. Weighted combination prediction modeling
Based on the SDE importance scores obtained from Problem2, this paper establishes a weighted combination prediction model by building Random Forest [5], BP Neural Network [6], LSTM, and ARIMA models and combining them in a weighted average, thus creating a weighted combination prediction model that aids in the discussion of the model to confirm the current Olympic status of these SDEs.
(1) Random Forest Prediction Model
Random Forest prediction model is an integrated learning algorithm that consists of multiple decision trees, and improves the accuracy and robustness of the prediction by synthesizing the prediction results of multiple decision trees. The following is a detailed analysis of the Random Forest predictive model:
(2) BP neural network prediction model
BP neural network is a multi-layer feed forward network trained by error back propagation, its algorithm is called BP algorithm, its basic idea is gradient descent method, using the gradient search technique, in order to make the network's actual output value and the desired output value of the error of the mean squared error to be minimized. The basic steps are as follows:
Input data is entered in the input layer, which enters into the next layer, i.e., the implicit layer, by connecting the weights, where the implicit layer inputs are:
hi1 is the value in the implicit layer. un1 is the value of the link between the input layer and the implicit layer. The input of the implicit layer is the weighted sum of its input parameters, and its output is the input of the Sigmoid function.
function is called the activation function of this neural network. y the outputs and inputs also follow the above principles, viz:
vn1 is the value of the link between the implicit layer and the output layer. Exports y0 after that a positive propagation is completed. Next, backpropagation is performed, i.e. the network outputs the y0 difference from the true value.
It can be seen that the smaller this error is the closer the network is to the real relationship.
(3) LSTM model
Long Short-Term Memory Network is a recurrent neural network approach based on machine learning theory for time series prediction.The LSTM model can effectively address the challenges faced by RNNs in realizing long term dependent tasks and can mitigate the impact of the gradient vanishing problem, which is common in RNNs, on prediction studies. Therefore, LSTM is also considered as a special type of RNN.The structure of RNN recurrent neural network is schematically shown In Figure 7 below.
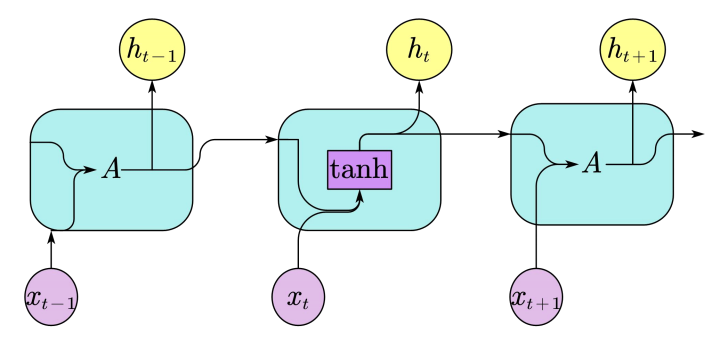
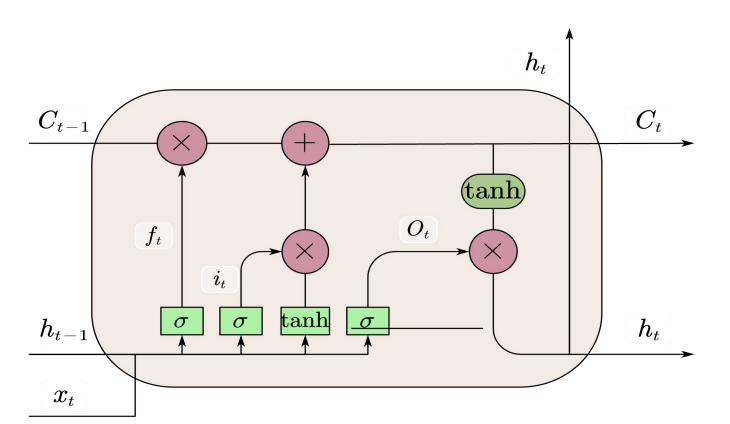
During the training process of the original RNN recurrent neural network, with the extension of the training time and the increase of the number of network layers, it is easy to have the problem of gradient explosion or gradient disappearance, which leads to the network not being able to effectively deal with longer sequences of data, and thus difficult to obtain the information in the long-distance data. To solve this problem, LSTM neural network adds a neural state to RNN for storing long-term data temporal features. This structure makes LSTM suitable for processing and predicting data of longer time series, and is able to deeply mine and store the temporal and semantic information in the data.The structure of LSTM neural network is schematically shown In Figure 8 below.
(4) ARIMA model
ARIMA model, known as autoregressive integral sliding average model, is a commonly used time series forecasting method.ARIMA model makes non-smooth time series data smooth by differentiating the time series data, and then uses autoregressive and sliding average models to model and forecast them. Its basic steps are as follows [7]:
1.autoregressive model
p the order autoregressive formula is:
2. moving average model
3.Autoregressive Moving Average Model
The combination of AR and MA models is known as ARMA model, which is calculated as:
4.Autoregressive Differential Moving Average Model
For a time series that may be a unit root process of order d, it is necessary to first differencing the data. The computational formula is:
3.3.5. Evaluation of the model
(1) random forest
The random forest prediction model based on Bayesian tuning parameter for the same problem I can get the comparison between the predicted response and the real response as shown In Figure 9 below.
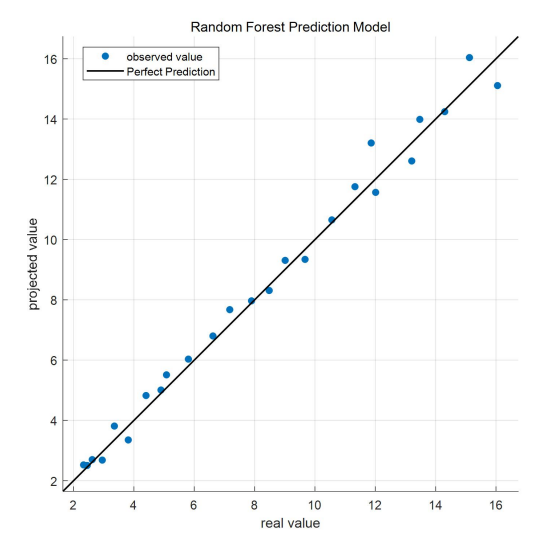
From the above figure, it can be seen that the predicted response basically coincides with the real response, indicating that the random forest prediction model is more effective in predicting the future economic trend of Guangdong, Hong Kong and Macao Greater Bay Area..
(2) BP neural network
The BP neural network prediction model is fitted on the training and test sets and the performance of the model on the dataset is verified and the results are obtained as shown In Figure 10 below.
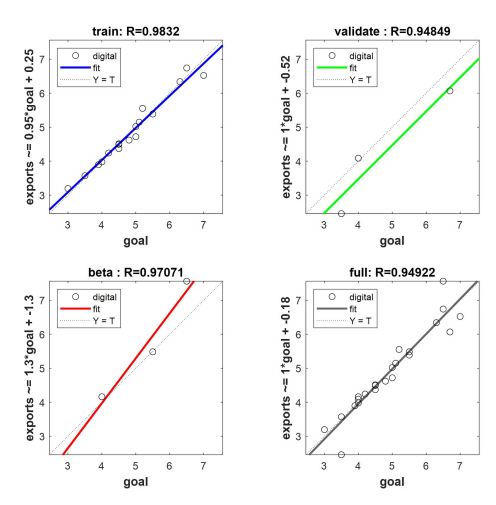
As can be seen from the above figure, the BP neural network model performs well on both the training and test sets and also exhibits extremely high prediction accuracy on the validation dataset.
(3) LSTM model
The model hyperparameters ofthe LSTM prediction model have a more significant impact on the model training results, so the RMSE is chosen as the evaluation index, and the grid search method is used to find the optimal model hyperparameters, and the specific results are shown In Figure 11 below.
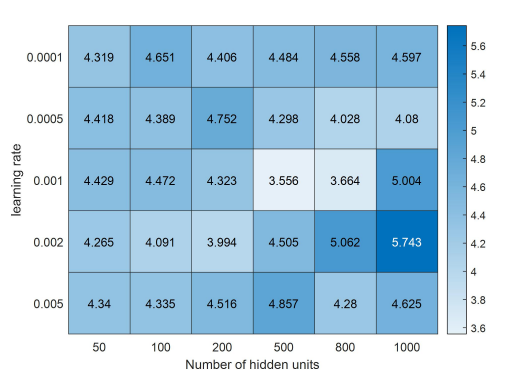
As can be seen from the figure, when the learning rate is taken as 0.001 and the number of hidden units is 500, the root mean square error RMSE achieves a minimum value of 1.851, which is retrained using the modified hyperparameters of the model, and ultimately the coefficient of determination is found to be R2=0.9677, which results in a significant increase in the accuracy of the model.
(4) ARIMA model
The method is used to fit the historical data and predict the future data and the results are visualized as follows In figure 12:
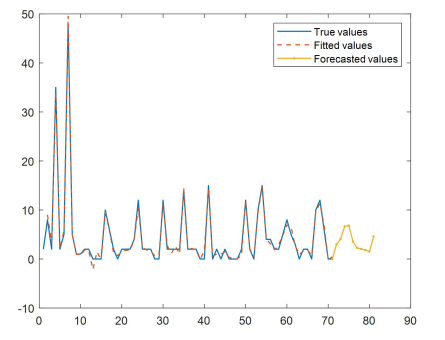
From the above figure, it can be intuitively observed that the fitting effect of the method is better, and the model has a strong generalization ability, which makes the model not only able to perform well on the training data, but also able to provide accurate and reliable prediction results on the unknown data.
3.3.6. Entropy weighting method for determining weights
Entropy weight method is a multi-indicator comprehensive evaluation method for determining the weight of each indicator.It is based on the concept of information entropy, and determines the weights by calculating the entropy value of each indicator to measure the magnitude of its information.
The entropy weighting method is utilized to find the weights of each of the four prediction models, and the specific results are shown In Figure 13 below.
Among these four prediction models, the random forest model has the best prediction effect, while the accuracy of ARIMA prediction is relatively low. The result is in accordance with the weights sought by the entropy weighting method, which better highlights the rationality and objectivity of the entropy weighting method in seeking weights.
3.3.7. Results of the model
From the final weighted combination model, it can be seen that of the 71 items, 45 items show a rising trend, 17 items tend to level off, and 9 items decrease at a faster rate, which is in line with the common sense of the crowd, and thus it can be seen that the SDE chosen by the model is more reasonable, and it can highlight the development trend of the Olympic Games in the future, especially for the four sports: Skateboarding, Sport, Climbing, and Squash and Surfing. In particular, the future development prospects ofthe four sports: Skateboarding, Sport, Climbing, Squash and Surfing cannot be ignored.
3.4. Basic mode
3.4.1. Modeling
At least three SDEs that will be added or deleted by the IOC for the 2032 Olympics and at least three SDEs that have been in the Olympic program since the 1988
Olympics or earlier periods.To ensure that the data is neatly organized, the data is categorized and modeled in a K-mean++ algorithm, as shown in the steps below:
The distance metric commonly used in squared Euclidean distance K-mean++ for two points
(2) cluster assignment
(3) Cluster Center Updates
(4) loss function
The goal of K-mean++ is to minimize the sum of the squared distances of all data points to their corresponding [8] clustering centers, i.e:
(5) convergence condition
The algorithm usually stops when the clustering centers no longer change or when the maximum number of iterations is reached. Convergence can be detected by comparing the change between the old and new clustering centers, for example:
K-mean++ continuously and iteratively optimizes the loss function for clustering the data, and the algorithm tries to find a better optimal solution by optimizing the selection of the initial clustering centers, thus potentially reducing the final total distortion degree.
3.4.2. Solving the model
After an in-depth exploration of the annexes, it was found that, with the development of the times, individual sports have gradually come into people's view, and they are in line with people's general understanding of sports and meet all the requirements, and have a tendency to return to the Olympic Games again. The specific clustering results are shown In Figure 14 below.
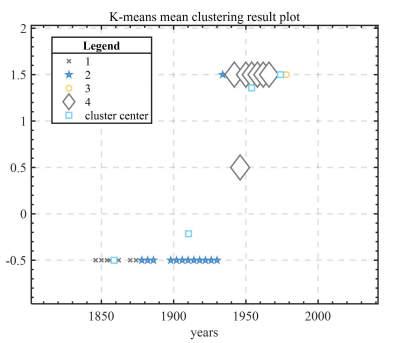
The SDE data were divided into four categories in the cluster analysis, which included emerging sports that are gradually conforming to the public's perception of the Olympics, as well as sports that are likely to be reintroduced to the Olympic program list.
Based on the weighted combinatorial prediction model in Problem 3, the number of programs in the next 1 period for individual sports is predicted, and five sports, Lacrosse, Polo, Squash, Tug of War and Skating, are likely to be reintroduced into the list of Olympic sports by the IOC, as shown In Figure 15 below.
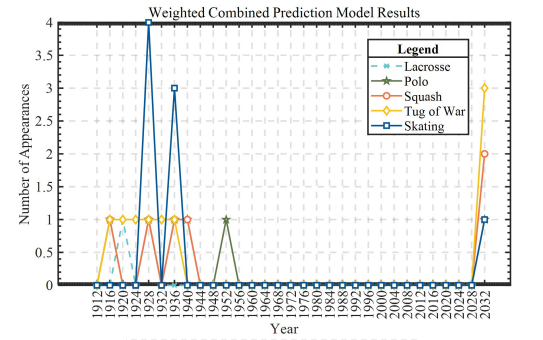
As can be seen from the graph, the project Tug of war is the most promising to enter the list of programs of the International Olympic Committee for the 2032 Olympic Games.It is followed by Squash, and the other three programs are increasingly in line with the public perception of sports.
3.5. Sensitivity analysis
In the K-means++ algorithm, the total distortion success of all classes is usually measured by calculating the sum of the squares of the distances of the sample points within each class to the center of their clusters.This total distortion into degree is the goal of the optimization of the K-means algorithm, i.e., to minimize the sum of the squares of the distances of all sample points to the centers of the clusters to which they belong.
need to be clustered into k classes. The clustering center of each class is
Elbow diagrams are often used to help determine the optimal number of clusters when using the k-mean++ algorithm for cluster analysis.This is shown in the following In Figure 16.
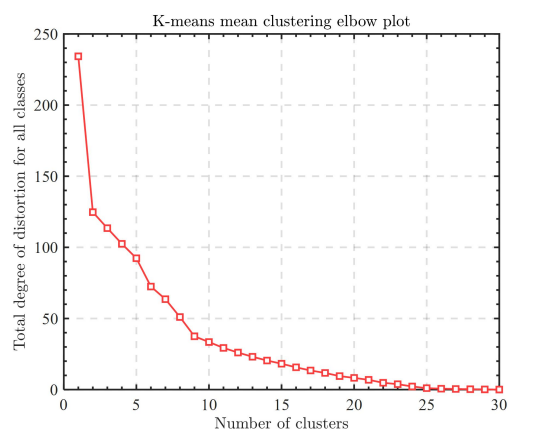
From the figure, it can be seen that the clustering result is better when
4. Conclusion
The International Olympic Committee (IOC) faces the challenge of maintaining the relevance and global appeal of the Summer Olympic Games amid evolving societal values and shifting audience interests. In preparation for the 2032 Brisbane Olympics, the IOC must carefully evaluate the inclusion, exclusion, or reintroduction of sports, disciplines, and events (SDEs) to align with Olympic values while maximizing engagement.
Key Considerations in SDE Evaluation
The Olympic Program Committee employs a multi-criteria decision framework to assess potential SDEs, ensuring they meet the following core Olympic principles:
Global Popularity & Accessibility – The sport must have a broad international following and be feasible for widespread participation.
Gender Equality – Events should promote equitable representation across genders.
Sustainability & Inclusivity – The sport should minimize environmental impact and foster social inclusion.
Innovation & Contemporary Relevance – New or reintroduced SDEs should resonate with modern audiences
Safety & Fair Competition – Ensuring athlete welfare and integrity in competition.
Proposed Analytical Framework
To systematically evaluate SDEs, this study develops a hybrid predictive model integrating:Random Forest,BP Neural Network,LSTM (for time-series trend analysis), and ARIMA.
These models are weighted using entropy-based optimization to enhance prediction accuracy. Additionally, K-means++ clustering is applied to categorize emerging sports based on public perception and Olympic compatibility, facilitating data-driven selection.
Model Validation & Predictive Insights
Testing on Historical SDEs: The model is validated using recently added (e.g., skateboarding, sport climbing) and removed (e.g., baseball, softball) SDEs, alongside traditional Olympic sports (e.g., athletics, swimming).
Projections for 2032: The analysis suggests potential reintroduction of squash, cricket, or breakdancing due to growing global interest.
Long-Term Trends (2036+) – Emerging activities such as esports, parkour, or drone racing may warrant consideration as the Olympic program evolves.
Sensitivity Analysis & Model Robustness
A Monte Carlo-based sensitivity analysis identifies global viewership, youth engagement, and commercial viability as the most influential parameters in SDE scoring. While the model demonstrates strong predictive capability, its dependency on historical trends presents limitations in accounting for sudden socio-cultural shifts or disruptive innovations [9].
Policy Implications & Future Directions
This study provides the IOC with a quantitative, data-driven methodology for SDE selection, balancing tradition with innovation. To further refine decision-making, future research should incorporate:
Real-time engagement metrics (e.g., social media trends),
Stakeholder feedback (athletes, federations, broadcasters), and
Scenario-based forecasting to assess resilience against external shocks.
By adopting this analytically rigorous approach, the IOC can ensure the Olympic Games remain a dynamic, inclusive, and globally resonant spectacle while upholding the movement’s foundational values.
Contribution to Literature: This work advances sports management research by introducing a novel multi-model evaluation framework for Olympic program selection, addressing gaps in predictive analytics for mega-event planning.
References
[1]. Zhang Y, Zheng W , Liu Z .Improving the spaceborne GNSS-R altimetric precision based on the novel multilayer feedforward neural network weighted joint prediction model [J].Defence Technology, 2024
[2]. Bai Y, Zhang Z , Qiao J , et al.Establishment of near-infrared rapid prediction model and comprehensive evaluation model for foxtail millet quality [J].Journal of Food Composition and Analysis, 2024
[3]. M. J L, E. L D .Associations among self-compassion, weight bias internalization, and self-reported psychological and physical health. [J].Stigma and Health, 2024
[4]. Estifeeva M T, Nechaeva M A , Deygen L M I , et al.Ultrasound protein-copolymer microbubble library engineering through poly structure [J].Biomaterials Advances, 2025
[5]. Dhaoui O, Antunes M I , Benhenda I , et al.Groundwater salinization risk assessment using combined artificial intelligence models. [J].Environmental science and pollution research international, 2024
[6]. Nazir A, Chakravarthy K T , Cecchini A D , et al.LangTest: A comprehensive evaluation library for custom LLM and NLP models [J].Software Impacts
[7]. Jin W, Quan Q , Dai K , et al.Research on the Prediction of Wax Deposition Thickness on Pipe Walls Based on the Optimal Weighted Combination Model [J].Processes, 2023
[8]. Li W W, Gu B X , Yang C , et al.Level evaluation of concrete dam fractures based on game theory combination weighting-normal cloud model [J].Frontiers in Materials, 2024, 11
[9]. Leonardo C, Luca R .The demand for sparkling wine: insights on a diversified European market [J].International Journal of Wine Business Research, 2024
Cite this article
Wang,H.;Lang,Y.;Zhang,W. (2025). SDE Selection Options Based on Weighted Portfolio Evaluation Model. Theoretical and Natural Science,104,26-47.
Data availability
The datasets used and/or analyzed during the current study will be available from the authors upon reasonable request.
Disclaimer/Publisher's Note
The statements, opinions and data contained in all publications are solely those of the individual author(s) and contributor(s) and not of EWA Publishing and/or the editor(s). EWA Publishing and/or the editor(s) disclaim responsibility for any injury to people or property resulting from any ideas, methods, instructions or products referred to in the content.
About volume
Volume title: Proceedings of CONF-MPCS 2025 Symposium: Mastering Optimization: Strategies for Maximum Efficiency
© 2024 by the author(s). Licensee EWA Publishing, Oxford, UK. This article is an open access article distributed under the terms and
conditions of the Creative Commons Attribution (CC BY) license. Authors who
publish this series agree to the following terms:
1. Authors retain copyright and grant the series right of first publication with the work simultaneously licensed under a Creative Commons
Attribution License that allows others to share the work with an acknowledgment of the work's authorship and initial publication in this
series.
2. Authors are able to enter into separate, additional contractual arrangements for the non-exclusive distribution of the series's published
version of the work (e.g., post it to an institutional repository or publish it in a book), with an acknowledgment of its initial
publication in this series.
3. Authors are permitted and encouraged to post their work online (e.g., in institutional repositories or on their website) prior to and
during the submission process, as it can lead to productive exchanges, as well as earlier and greater citation of published work (See
Open access policy for details).
References
[1]. Zhang Y, Zheng W , Liu Z .Improving the spaceborne GNSS-R altimetric precision based on the novel multilayer feedforward neural network weighted joint prediction model [J].Defence Technology, 2024
[2]. Bai Y, Zhang Z , Qiao J , et al.Establishment of near-infrared rapid prediction model and comprehensive evaluation model for foxtail millet quality [J].Journal of Food Composition and Analysis, 2024
[3]. M. J L, E. L D .Associations among self-compassion, weight bias internalization, and self-reported psychological and physical health. [J].Stigma and Health, 2024
[4]. Estifeeva M T, Nechaeva M A , Deygen L M I , et al.Ultrasound protein-copolymer microbubble library engineering through poly structure [J].Biomaterials Advances, 2025
[5]. Dhaoui O, Antunes M I , Benhenda I , et al.Groundwater salinization risk assessment using combined artificial intelligence models. [J].Environmental science and pollution research international, 2024
[6]. Nazir A, Chakravarthy K T , Cecchini A D , et al.LangTest: A comprehensive evaluation library for custom LLM and NLP models [J].Software Impacts
[7]. Jin W, Quan Q , Dai K , et al.Research on the Prediction of Wax Deposition Thickness on Pipe Walls Based on the Optimal Weighted Combination Model [J].Processes, 2023
[8]. Li W W, Gu B X , Yang C , et al.Level evaluation of concrete dam fractures based on game theory combination weighting-normal cloud model [J].Frontiers in Materials, 2024, 11
[9]. Leonardo C, Luca R .The demand for sparkling wine: insights on a diversified European market [J].International Journal of Wine Business Research, 2024