


1. Introduction
Extreme low-temperature events pose significant climate hazards by causing freezing rain, snowstorms, power disruptions [1], crop damage that threatens food security [2], and increased cardiovascular disease risks [3]. Understanding their spatiotemporal patterns and driving mechanisms remains a key focus in atmospheric science. Located in the East Asian monsoon zone, China's climate exhibits exceptional complexity due to interactions among Eurasia-Pacific-Indian Ocean thermal contrasts and the Tibetan Plateau's orographic forcing [4], resulting in frequent extreme weather. Despite rising winter temperatures (0.8–1.2°C) in Northeast and East China under East Asian winter monsoon modulation and global warming [5,6], extreme cold events paradoxically show intensified frequency fluctuations [7]. Notably, their climate sensitivity index (CSI) exceeds 1.7 – higher than for extreme high-temperature events [8] – suggesting amplified impacts of global warming.
Identifying changing patterns is crucial for revealing driving factors. Arctic amplification and atmospheric circulation anomalies synergistically intensify these events, though with significant regional heterogeneity [9]. Northwest China shows marked reductions post-1985 [10], while North China exhibits decadal shifts: increased extreme cold days after 2003 followed by decreases after 2013 [11]. Northeast China displays a triphasic trend (high frequency pre-1980s, decline until early-2000s, resurgence post-2000) [9,12]. This spatial variability aligns with amplified warming gradients across China [13]. Paradoxically, while frequency decreases under global warming, intensity has increased [8]. Both intrinsic atmospheric variability and external diabatic forcing (e.g., sea ice anomalies, SST variations) contribute [14].
Existing studies on China's winter extreme cold events primarily focus on local analyses, lacking comprehensive examination of nationwide spatial modes, interannual-decadal evolution patterns, and circulation-driven mechanisms. Here, we combine high-resolution reanalysis data with statistical-physical hybrid methods to clarify multi-scale spatiotemporal characteristics of extreme low-temperature days across China (1961–2020) and reveal their physical links to atmospheric circulation and SSTA anomalies.
2. Data and methods
2.1. Long time series reanalysis data
This study used observation and reanalysis data, including: CN05.1 daily minimum temperature provided by the National Meteorological Information Center , which is based on the observation data from more than 2,400 ground meteorological stations in China. Using the anomaly approximation method, it is obtained by interpolating and superimposing the climate field and anomaly field separately [15], with a resolution of 0.25°×0.25°; the reanalysis dataset released by the National Center for Environmental Prediction/National Center for Atmospheric Research (NCEP/NCAR ReanalysisⅠ) [16], which includes the global monthly sea level pressure field (SLP), 850 hPa, 500 hPa, and 200 hPa geopotential height field and wind field data with a spatial resolution of 2.5°×2.5°; the global sea surface temperature dataset developed by the Met Office Hadley Centre (HadISST) with a spatial resolution of 1°×1°. The winter referred to in the article is from December to February of the following year, which is DJF. After screening the data, a total of 60 winters were identified from 1961 to 2020.
2.2. Construction of extreme low temperature days dataset
Referring to the definition of extreme low temperature thresholds [17-19], this paper used the CN05.1 daily minimum temperature data, for a given grid point, all the daily minimum temperatures for the 60 years from 1961 to 2020 (21,915 days in total) are sorted in ascending order, and the temperature value at the fifth percentile is taken as the extreme low temperature threshold for that grid point. If the daily minimum temperature on a certain day in that grid point falls below the threshold, it is assumed that an extreme low temperature event occurs in that grid point. The number of days with daily minimum temperatures below the threshold in the winter of each year (DJF) for each grid point is defined as the extreme low temperature days (ELDs). All grid points define their respective ELDs in the same way.
2.3. Data analysis methods
The statistical methods used in this study include sliding average, cumulative anomaly, empirical orthogonal function decomposition (EOF) [20], Pearson's correlation analysis, and lead-lag regression and correlation. North's test was used for the results of EOF decomposition [21] and Students' t-test was used for correlation and regression analysis [22].
3. Results and discussion
3.1. The spatiotemporal distribution of ELDS
First, this paper studies the spatiotemporal distribution characteristics of winter extreme low temperature days in China. The threshold pattern exhibits a pronounced "south-high, north-low" gradient (Fig. 1a), with the positive and negative threshold boundary line located at 25°N.[8,9]. ELDs demonstrate nationwide uniformity, averaging 17-18 days annually (Fig. 1b). Notably, the annual mean daily minimum temperature increased by about 3°C, rising from -14°C in the 1960s to -11°C in recent decades. Especially after 1985, events with temperatures below -13.5°C have significantly decreased, and events below -13°C have nearly disappeared after 2000. Concurrently, ELDs decreased by over 50%, declining from 10-12 days/year (1960s) to 4-6 days/year (2010s), with heightened interannual variability during 1960s-1980s followed by stabilization post-1985. Cumulative anomaly analysis reveals that there was an interdecadal abrupt change in ELDs in 1985 [8,10,23] (Fig. 1c). The annual average minimum temperature rise and the decrease in ELDs occur synchronously, showing a significant negative correlation feature.

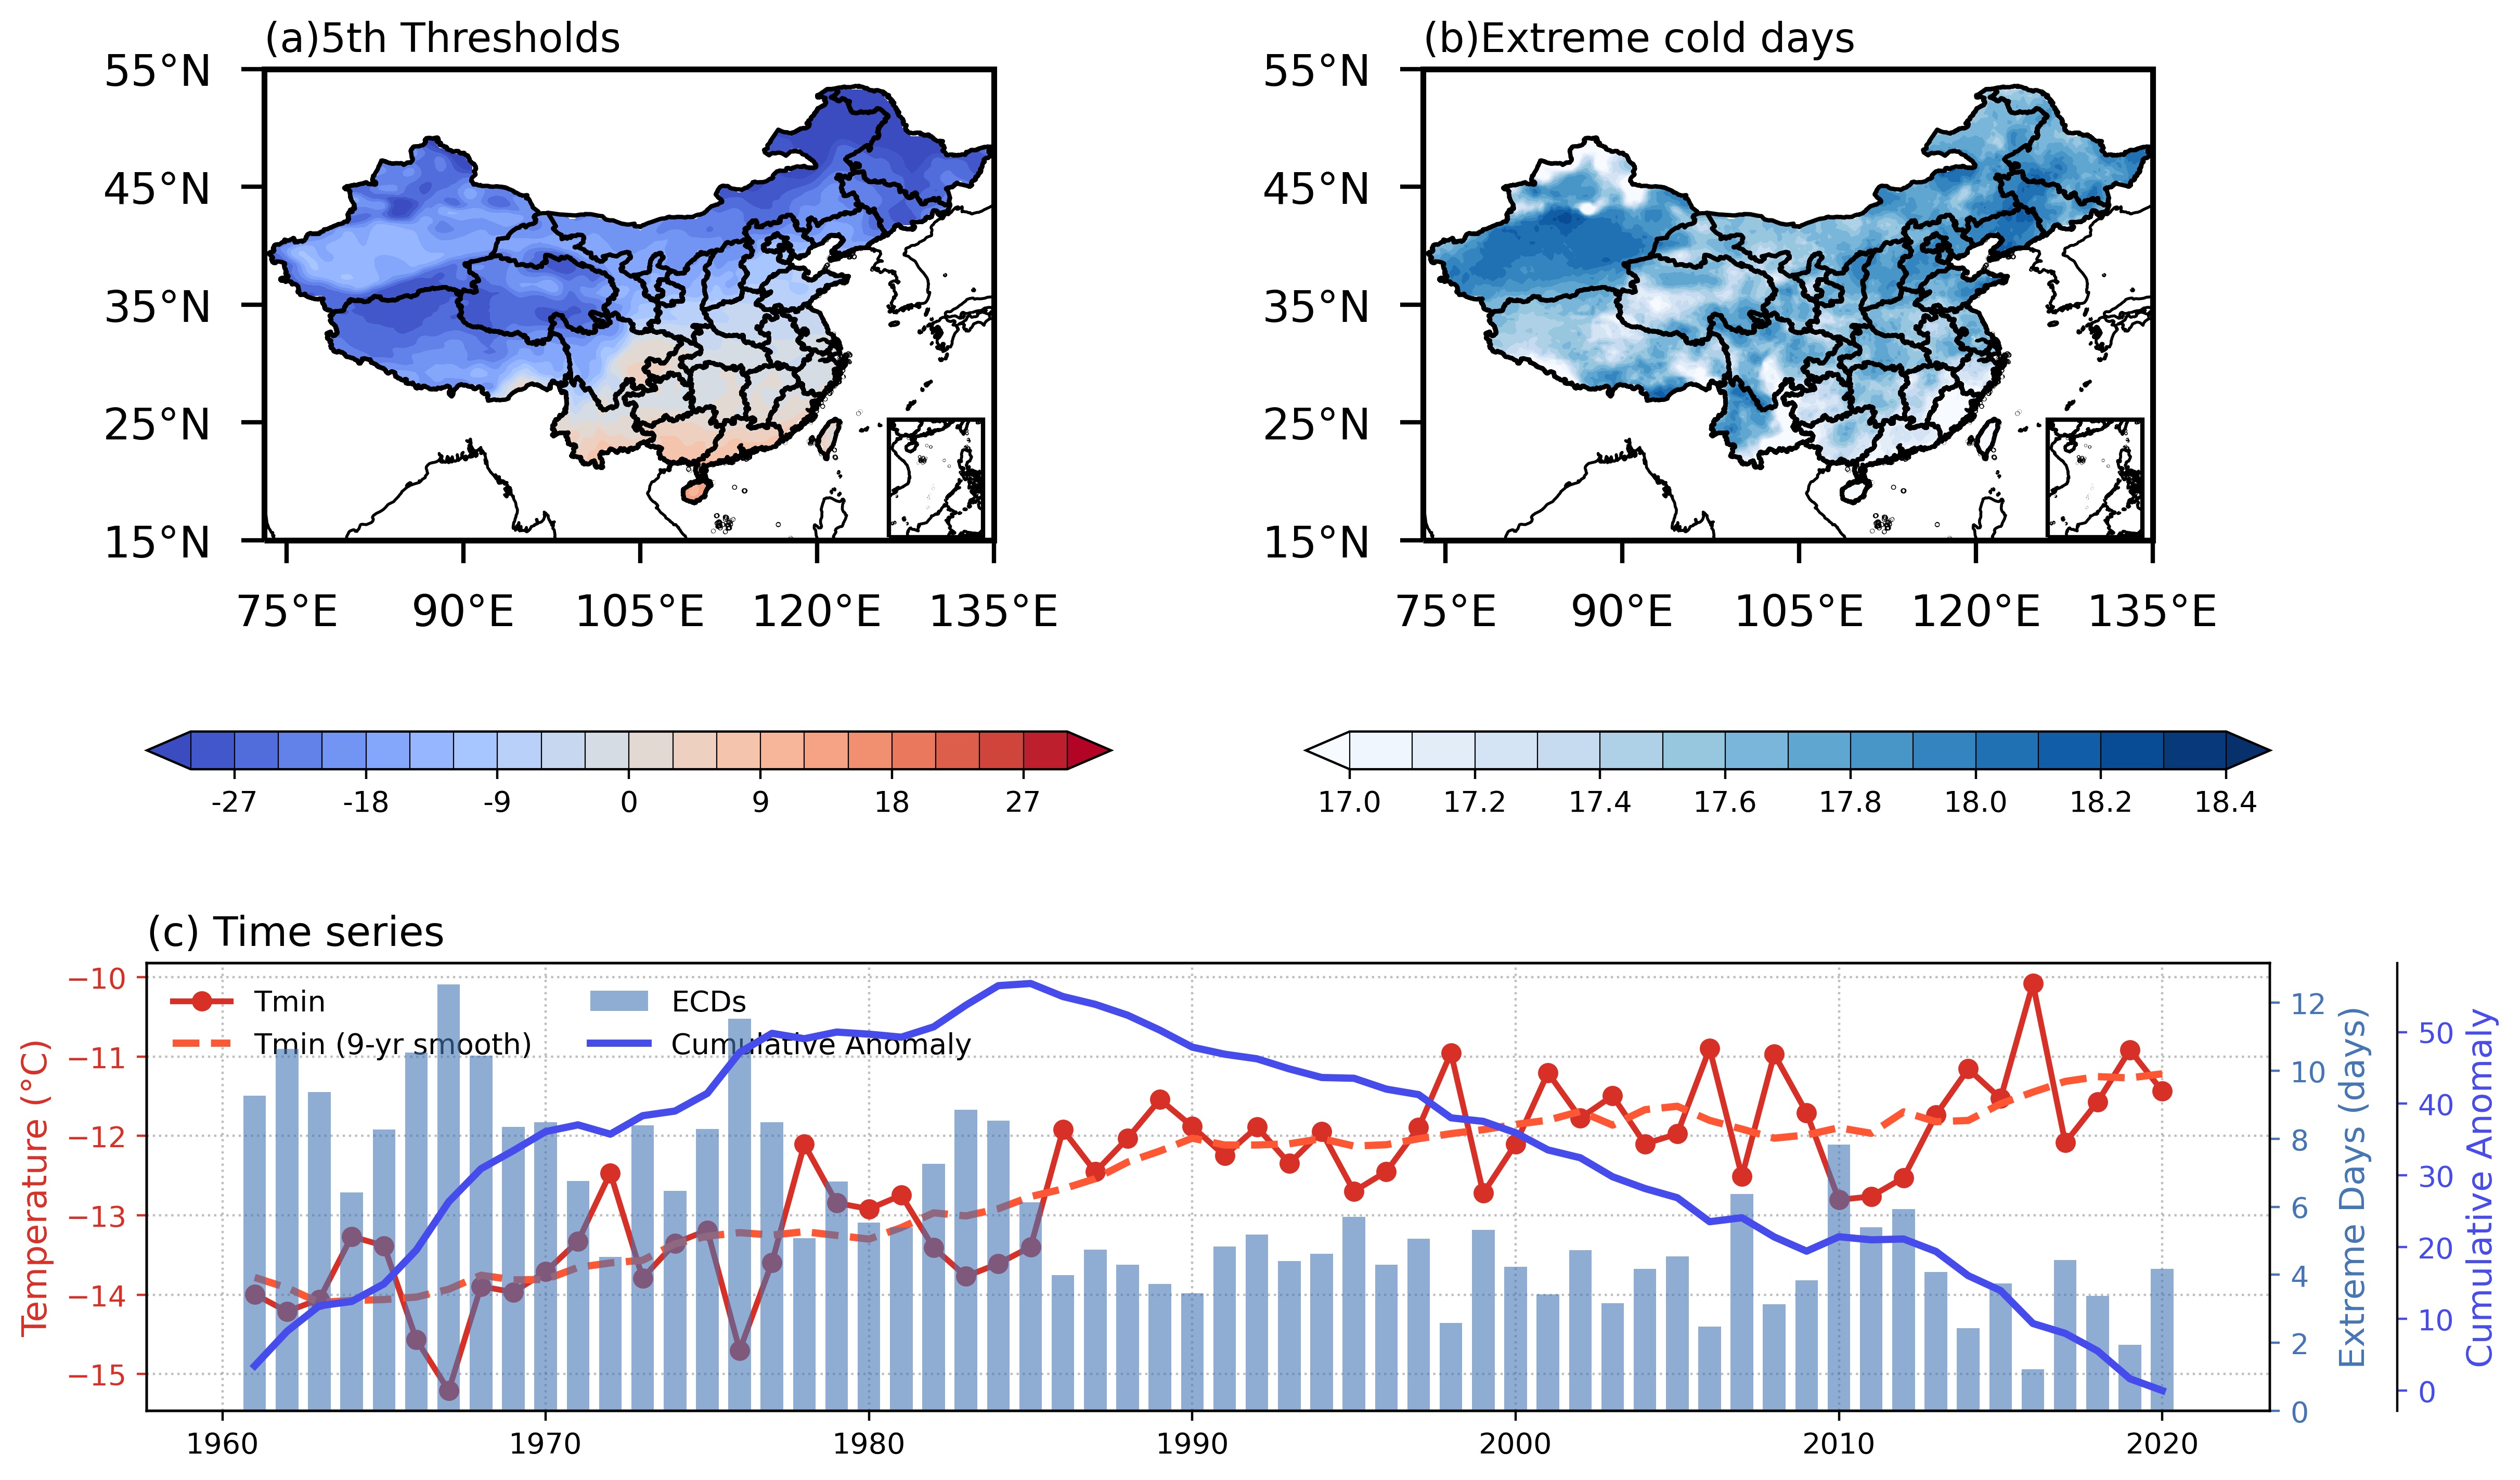
Figure 1. (a) Spatial distribution of the 5th-percentile threshold for extreme low temperatures (°C) in China; (b) Distribution of winter extreme low-temperature days (ELDs); (c) Time series (1961-2020) of: annual mean daily minimum temperature (red solid line), its 9-year sliding average (dashed line), ELDs (bars), and cumulative ELD anomaly (blue solid line), in 1961-2020
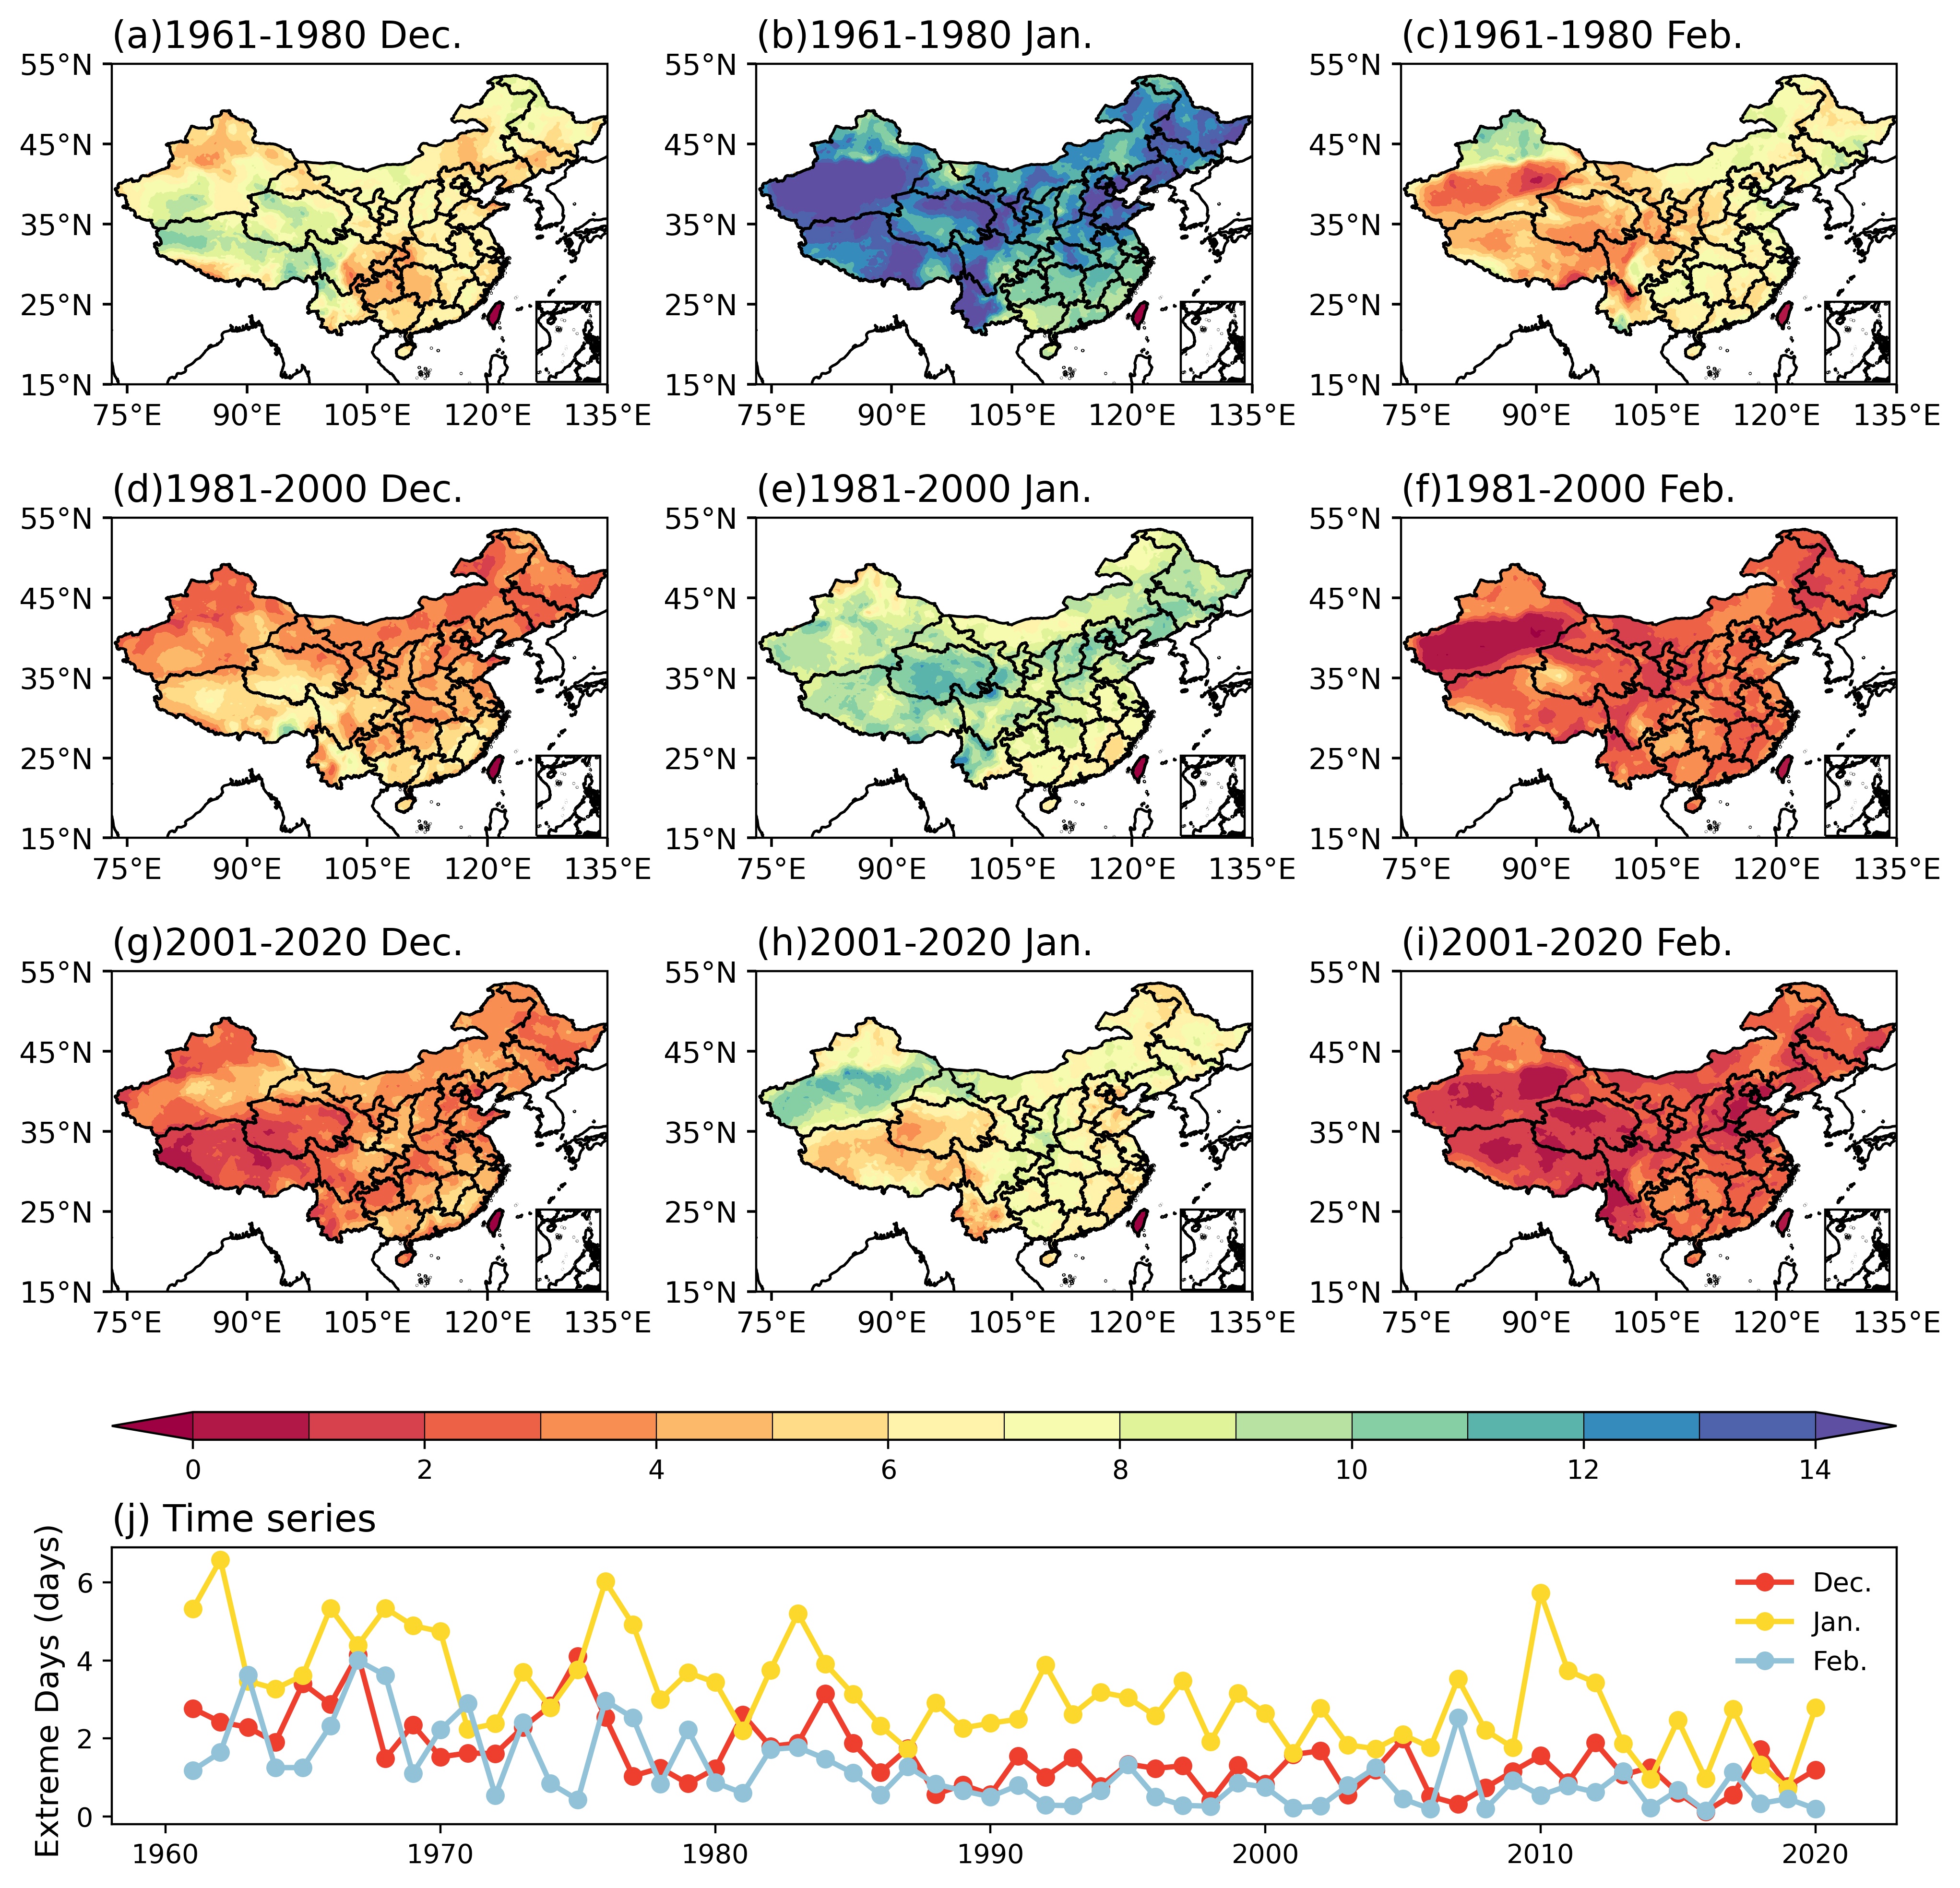
This study further conducted a phased statistical analysis of ELDs in December, January, and February in China every 20 years since 1961, and calculated the annual time series of the number of ELDs for each month (Fig. 2). Horizontal comparisons reveals that there is a monthly variation in the high-value areas of ELDs, with a concentration in December in northern, southern and southwestern China; a winter peak was reached in January; and shifted to the northwestern part in February (Figs. 2a-i). Vertical comparisons show that the spatial distribution of ELDs within the same month exhibits intergenerational stability, but the number of ELDs “gradually decreases” in the later period compared to the earlier period, which confirms that the increase in winter average temperature under the background of global warming may have an inhibiting effect on extreme low temperature events, and that regional response differences are significant (with greater attenuation in the northeast and the Qinghai-Tibet Plateau region) (Fig. 2a-i).Meanwhile, except for a few years, the average ELDs in each winter month has significantly decreased since the mid-1980s (Fig. 2j). The above spatiotemporal features corroborate the abrupt climate change phenomenon of ELDs around the 1980s [10,12,19], and the warming trend is more pronounced in the north.
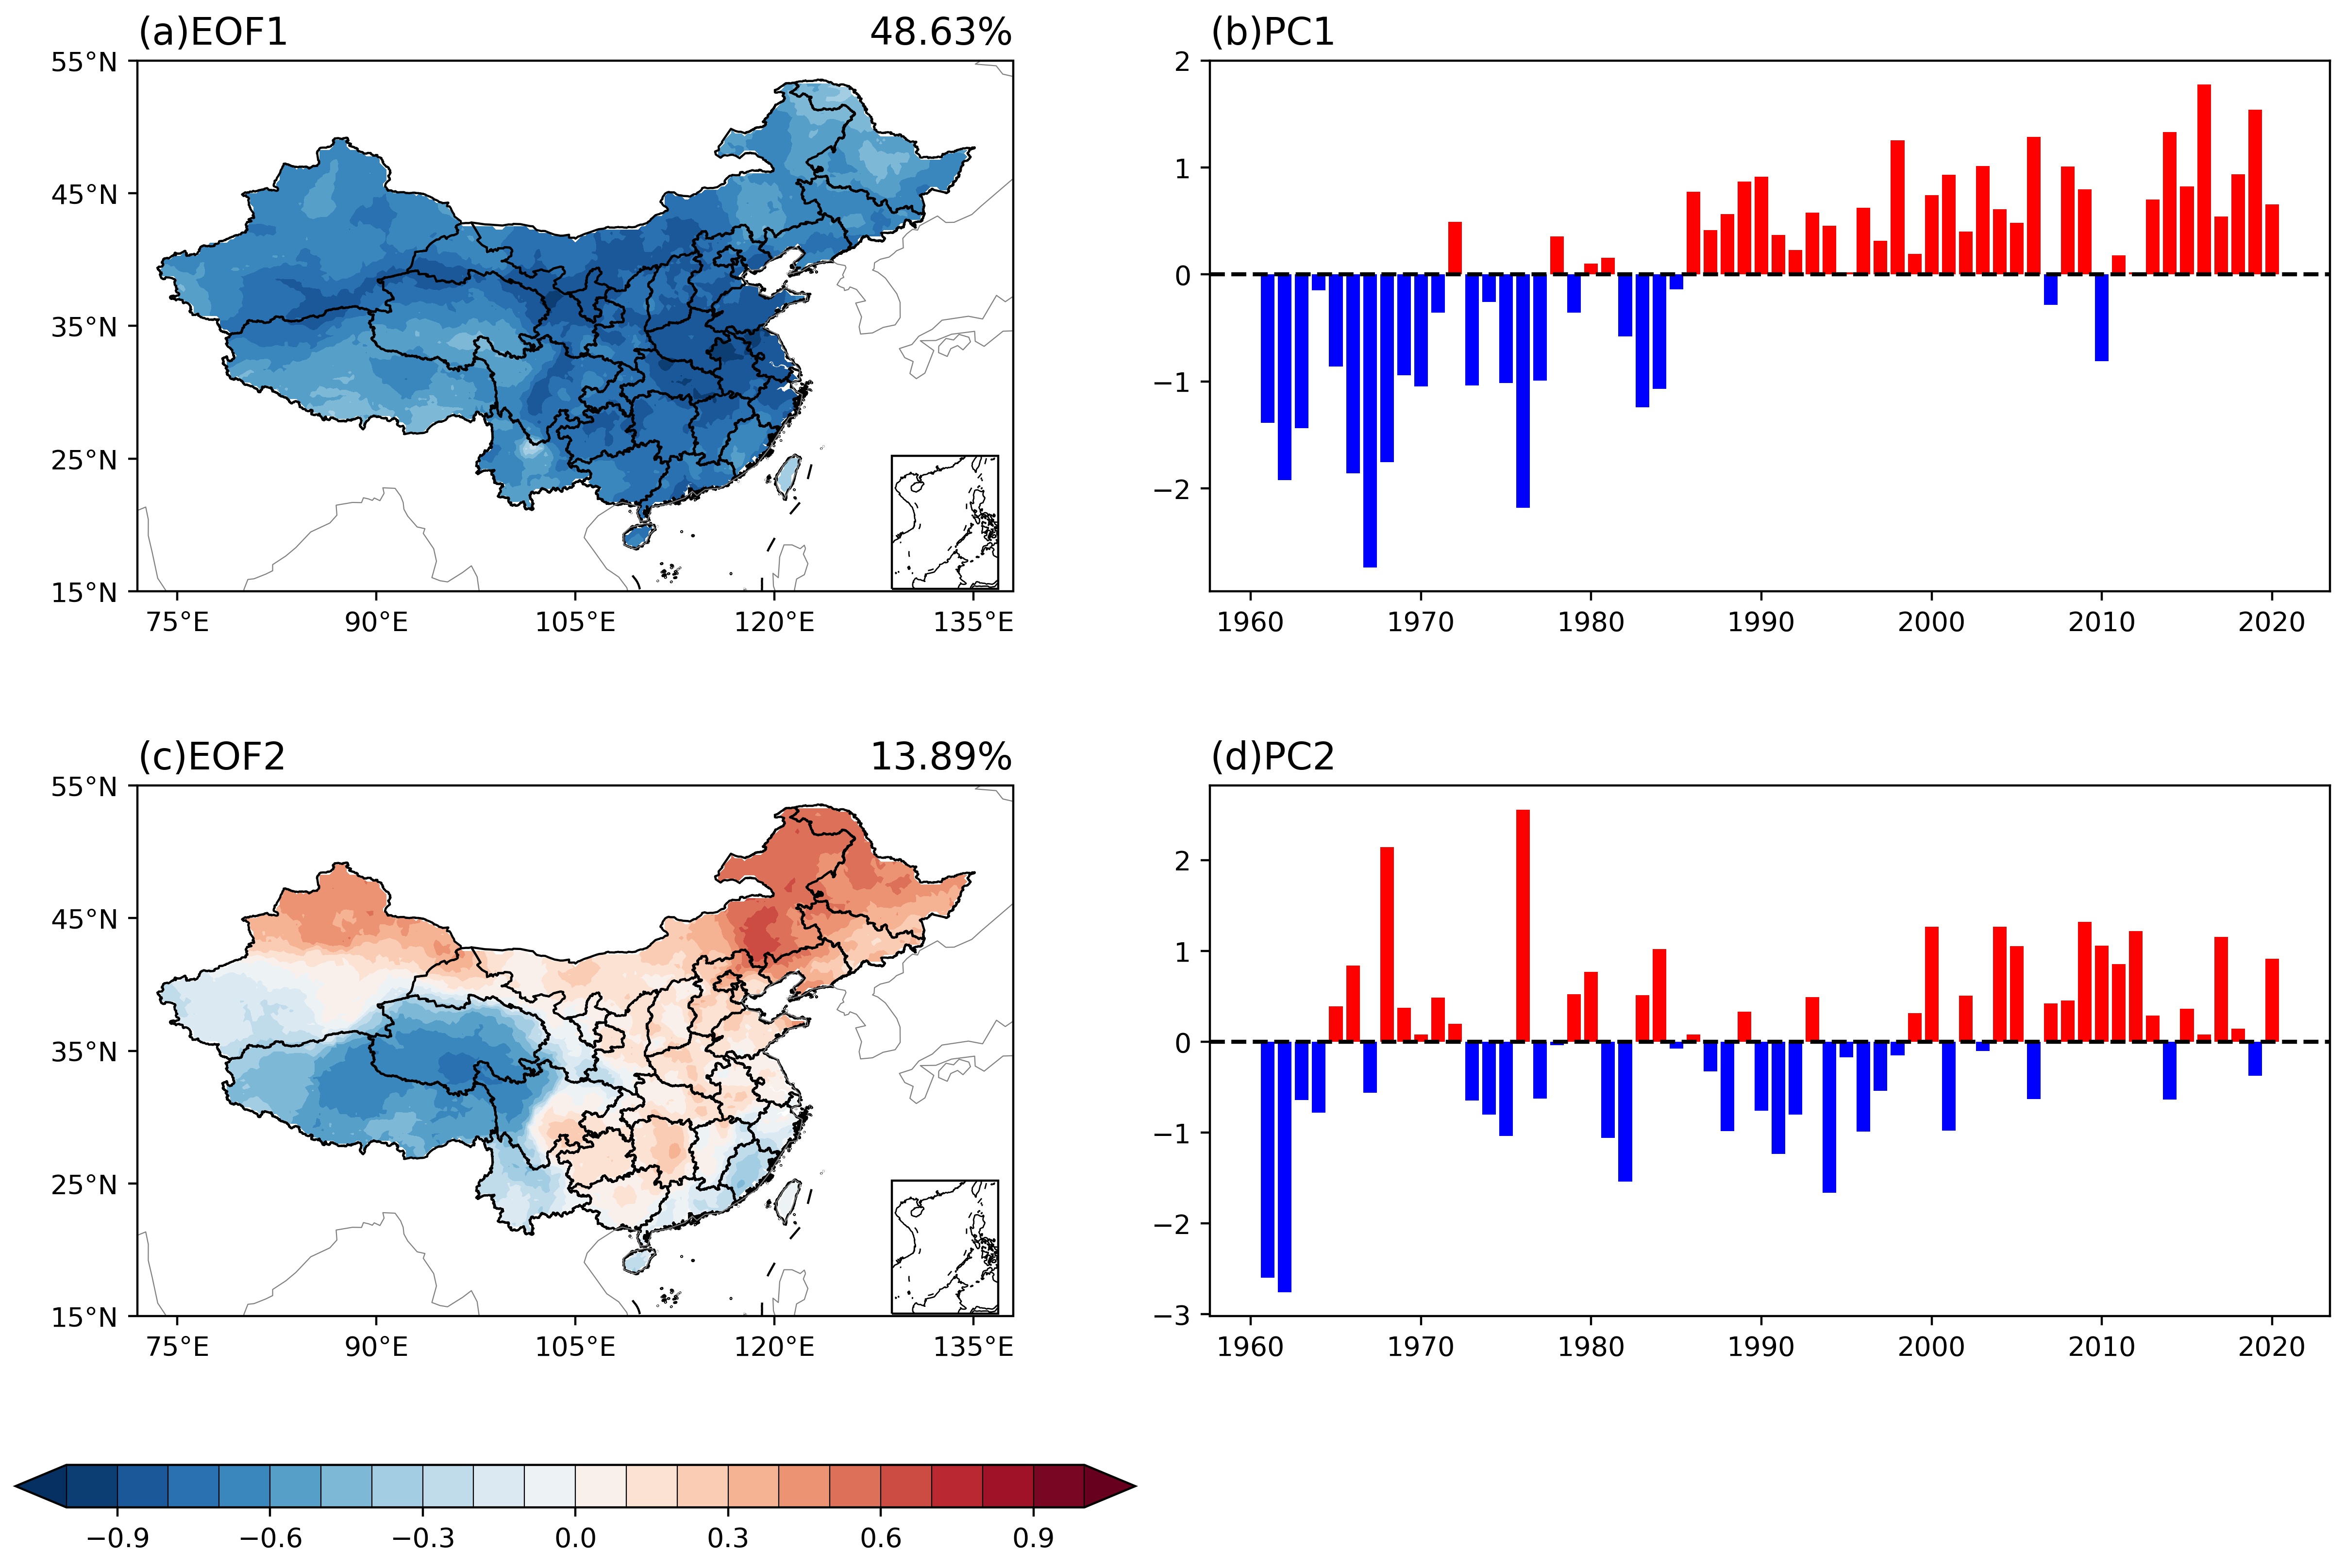
This study identifies the principal modes of extreme low-temperature days (ELDs) through EOF analysis [20] The leading mode (EOF1) exhibits a nationwide coherent pattern with maximum loadings over central China (Fig. 3a), consistent with climatological ELDs distribution (Fig. 1b). EOF2 displays a north-south dipole structure where ELDs in northwestern/northeastern/northern China inversely correlate with southern/southwestern regions (Fig. 3c). These main spatial modes are consistent with previous studies [24-26]. EOF1 and EOF2 together explain 62.52% of the total variance, which can well explain the spatiotemporal characteristics of ELDs. Cumulatively explaining 62.52% variance, both modes meet North et al. [27] criteria for statistical independence, indicating distinct physical drivers.
The principal component of EOF1 (PC1) reveals an interdecadal regime shift transitioning from negative to positive phase around 1985 (Fig. 3b), consistent with China's ELD transition (Fig. 1c) [10]. EOF2's component (PC2) shows prominent interannual variability during 1961–2023 (Fig. 3d), with amplitude reduction post-1980s.
3.2. The correlation between ECDs and atmospheric circulation
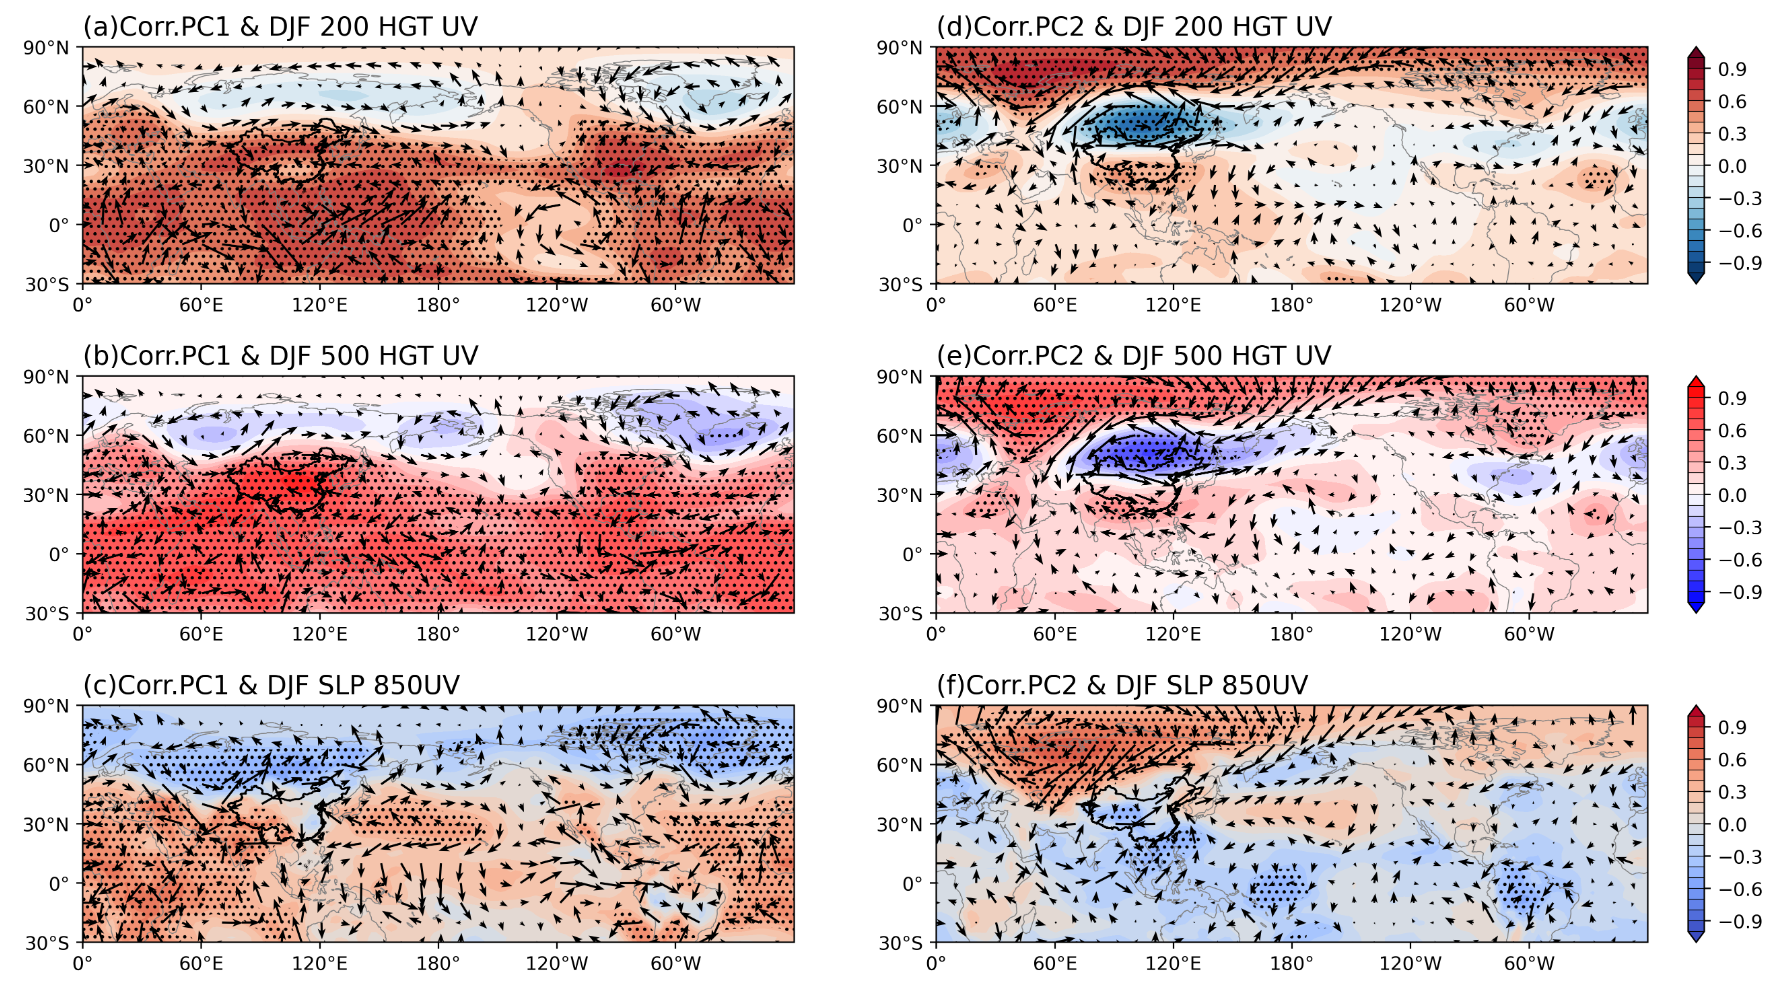
To elucidate the physical drivers of these modes, contemporaneous correlations are made between the principal components and the global sea level pressure, the 850 hPa wind field, and the 500 hPa versus 200 hPa geopotential height field and wind field respectively (Fig. 4).
For EOF1’s regionally consistent negative pattern, coherent negative geopotential height anomalies over Arctic/northern Siberia at 200–500 hPa accompany cyclonic circulation anomalies (Fig. 4a-b), suggesting polar vortex expansion. This configuration facilitates southward cold air intrusion and amplifies meridional perturbations in the westerly jet stream [28]. Concurrently, mid-low latitudes exhibit widespread positive height anomalies (Fig. 4a-b). At surface levels, Siberia shows depressed sea-level pressure with 850 hPa cyclonic anomalies, while the Northwest Pacific displays elevated pressure and anticyclonic circulation (Fig. 4c).
The atmospheric circulation associated with the north-south dipole distribution (Fig. 3c) indicates that the winter-time geopotential height and wind field exhibit a quasi-baric distribution from bottom to top (Figures 4d–f). At upper-Mid Troposphere (200–500 hPa), strong positive height anomalies over the Arctic–West Siberia juxtaposed with negative anomalies across northern China–Mongolian Plateau, accompanied by cyclonic circulation (Fig. 4d-e). This configuration reflects polar vortex intensification/southward displacement, enhancing meridional jet stream perturbations that channel cold air into mid-latitudes – a signature resembling the negative Arctic Oscillation phase (AO-) [29,30]. Ural blocking high development promotes Siberian cold air accumulation, with cyclonic steering guiding westerly cold surges into northern China (Fig. 4e). Simultaneously, 850 hPa cyclonic anomalies generate southerly flow over southern China, inhibiting cold air penetration southward (Fig. 4f). The transition from low-level (850 hPa) convergence to upper-level (200 hPa) divergence creates a coupled vertical profile conducive to convective intensification and extreme cold/precipitation events.
3.3. Contemporaneous correlation between ECDs and SSTA
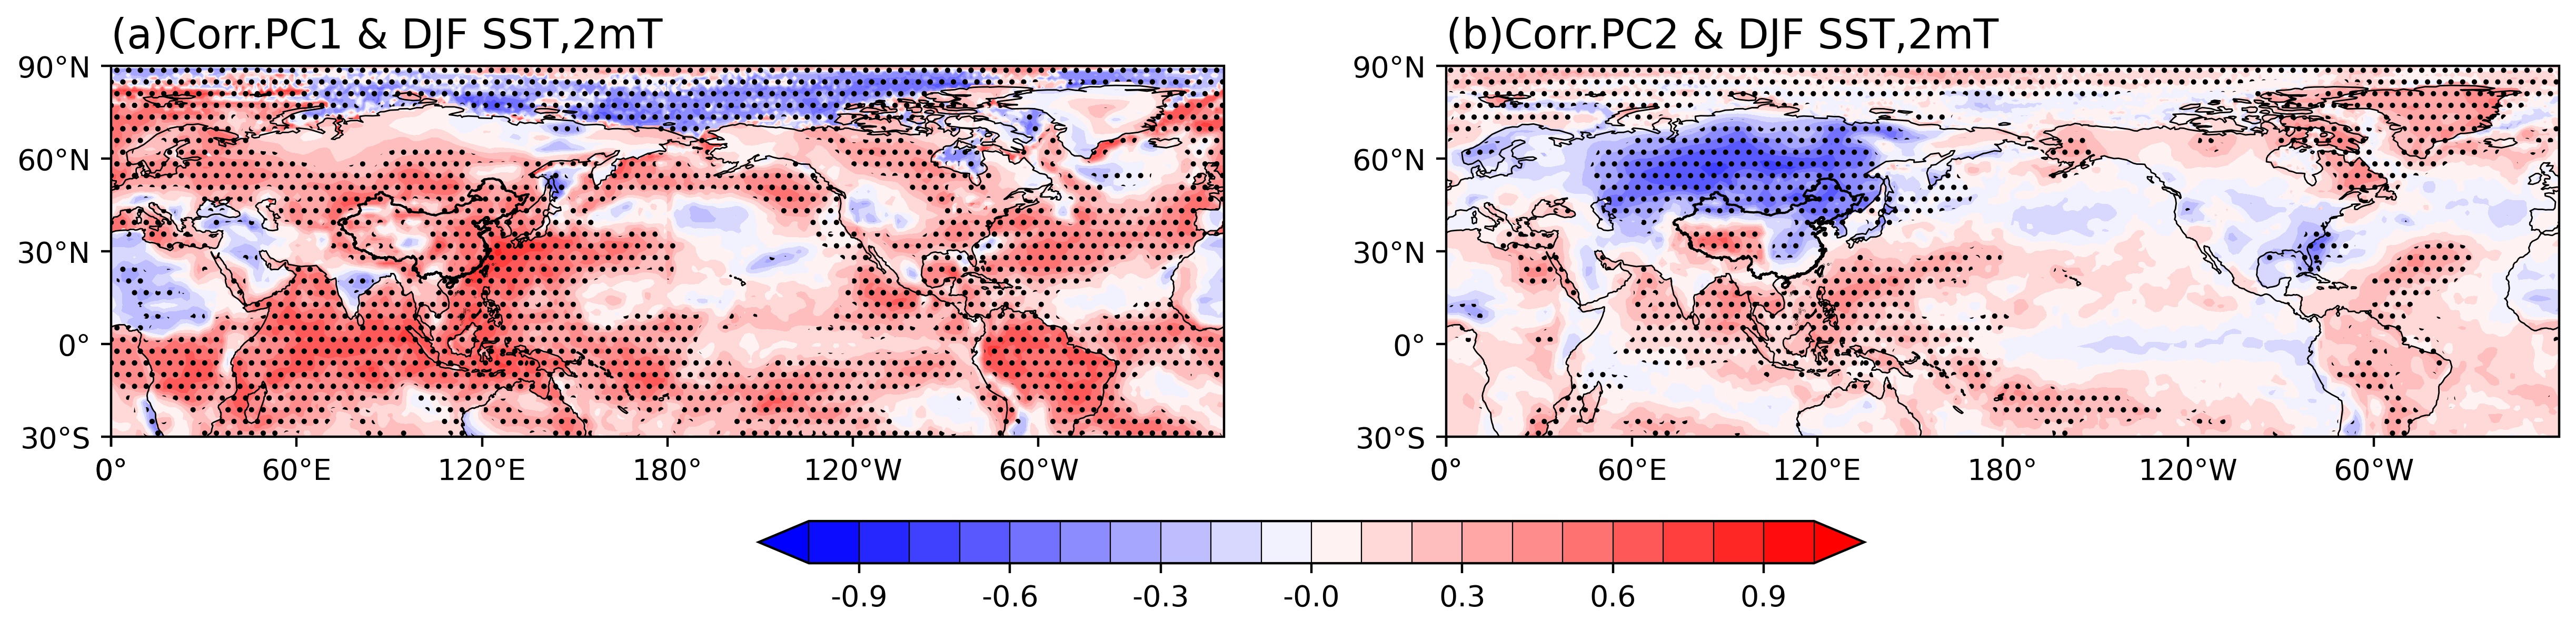
Aiming to further investigate the physical connection between sea surface temperature anomaly(SSTA)and ELDs, the contemporaneous correlation distributions of PC1 and PC2 with global SSTA are calculated (Fig. 5).
For EOF1, the North Pacific Ocean shows a positive-negative-positive correlation distribution from north to south, with a significant negative anomaly signal near the Aleutian Islands, the largest positive anomaly region occurs near the East China Sea along the West Pacific coast, which exhibits an inverse-phase oscillation throughout the year with the negative anomaly in the central part of the region. And almost all the rest of the ocean area exhibits significant positive anomaly correlation except for the Atlantic Ocean south of Greenland, where a negative anomaly center is observed (Fig. 5a). This large-scale positive correlations may reflect the suppression of extreme low temperature events by the overall trend of SST warming under the background of global warming [31]. For the distribution of the contemporaneous correlation between EOF2 and SSTA (Fig. 5b), a significant positive correlation is observed along the southeast coast of China (0°-30°N, 120°E-180°W), and a La Niña-like SST pattern [32], whereas the correlation with other sea areas is not significant.
3.4. Lead-lag regression of ECDs and SSTA
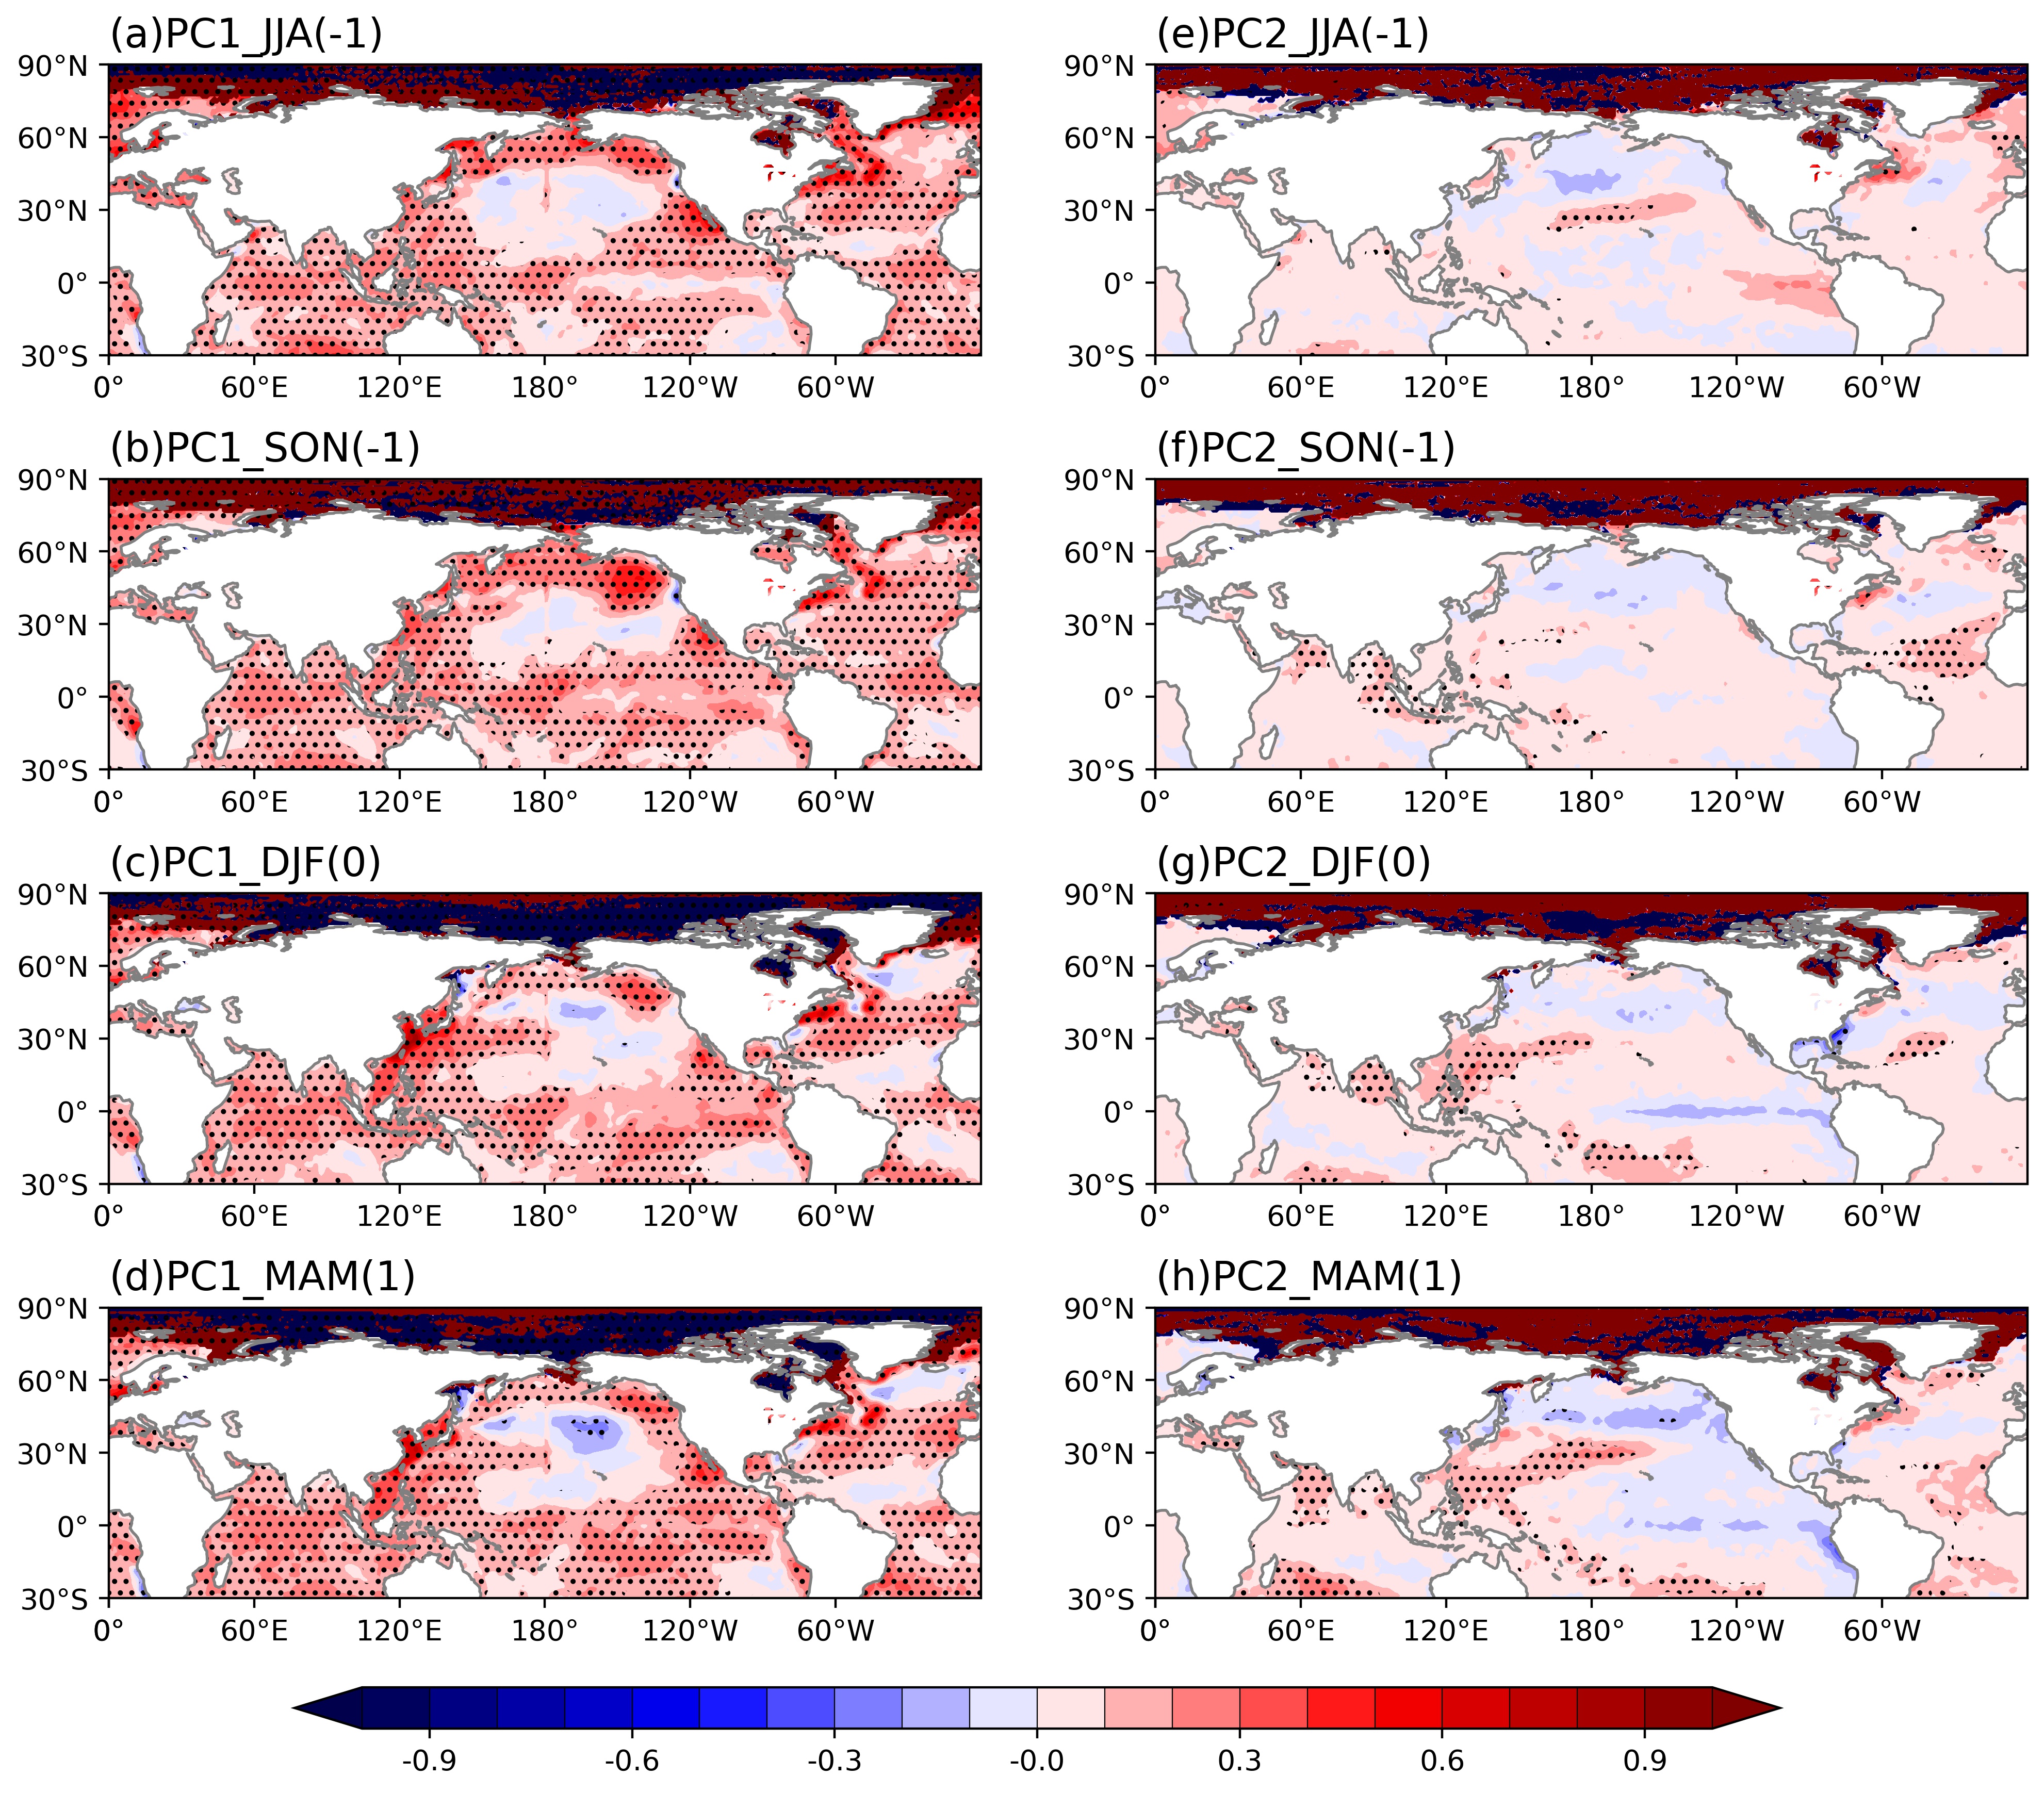
To further explore the signal of SSTA on the ELDs, this paper calculates the lead lag regressions of PC1 and PC2 with SSTA for each season (Fig. 6). For EOF1(nationally coherent mode), weak negative anomalies emerge in the central North Pacific during preceding summer, flanked by positive anomalies in Alaska Bay and the San Francisco coast (Fig. 6a). These signals intensify seasonally: Alaskan positive anomalies expand in fall while central Pacific negative anomalies weaken (Fig. 6b), culminating in amplified phase-locked patterns by late spring (Fig. 6d). Notably, Indian and Atlantic Ocean SSTAs exhibit persistent negative correlations with ELDs across all seasons [31].
EOF2(north-south dipole mode) reveals contrasting phase evolution: its North Pacific precursor anomalies oppose EOF1 during pre-summer to fall (Figs. 6e-f vs. 6a-b) but align during winter to spring (Figs. 6g-h vs. 6c-d). It is also noted that the signal of "east-negative-west-positive" dipole variations in the equatorial Pacific (5°S-5°N) gradually strengthens from the pre-summer to the later spring.
4. Conclusion
This study investigates winter extreme low-temperature events in China, analyzing the spatiotemporal distribution of extreme low-temperature days (ELDs) and their physical linkages with atmospheric circulation and sea surface temperature anomalies (SSTA). Key findings are:
(1) Spatiotemporal Evolution of ELDs: From 1961 to 2020, winter ELDs in China declined by over 50%, with minimum temperatures rising from −14°C to −11°C and sub−13°C extremes disappearing post-2000; EOF analysis reveals two dominant modes explaining 62.52% of the variance: a nationwide decline mode (EOF1, 48.63%) with an interdecadal shift around 1985, and a north–south dipole mode (EOF2, 13.89%) with weakened interannual fluctuations post-1980s.
(2) Atmospheric Circulation Linkages: EOF1 is linked to negative geopotential height anomalies and southward-expanding polar vortices that enhance cold air intrusion but are offset by mid–low latitude blocking highs, while EOF2 features a quasi-barotropic AO-negative-like structure with Arctic–West Siberian highs and northern China lows driving cold surges into northern China and creating a thermal dipole via vertical circulation coupling.
(3) SSTA Connections: EOF1 shows broad positive correlations with winter SSTA across most oceans and year-round tropical (10°S–10°N) SSTs, while EOF2 is associated with La Niña–like tropical Pacific dipole SSTs that intensify from pre-summer to post-spring, though their tropical linkages remain seasonally variable and statistically insignificant.
Limitations and Future Work: Results are limited to correlative analyses; physical processes and causality require numerical experiments. External forcings like sea ice, Eurasian snowpack [33,34], and other factors [35], which modulate events via surface albedo/energy balance [5] remain undiscussed. Future studies should employ high-resolution regional climate models to explore multi-circle interactions, improving predictions of extreme cold events under climate change.
References
[1]. Cao Chen, and Wang Zengping. "Reflections on the impact of extreme weather on new power systems and countermeasures." Southern Energy Construction 12.1(2025): 43-57.
[2]. Lesk, Corey , P. Rowhani , and N. Ramankutty . "Influence of extreme weather disasters on global crop production." Nature 529.7584(2016): 84.
[3]. Katznelson, Ethan , et al. "Climate Change and Congenital Heart Disease: A Narrative Review." Congenital Heart Disease 19.6(2024).
[4]. Hu Beibei. Interannual and interdecadal variability of extreme low temperature events in China. Diss. of Ocean University of China, 2015.
[5]. Intergovernmental Panel on Climate Change. Climate Change 2023: Synthesis Report. Contribution of Working Groups I, II and III to the Sixth Assessment Report of the Intergovernmental Panel on Climate Change. IPCC, 2023, DOI: 10.59327/IPCC/AR6-9789291691647.
[6]. Liu, S., et al. "Impacts of East Asian winter winds on winter temperature changes in northeastern China." Geoscience 35. 04 (2015): 507-514. doi: 10.13249/j.cnki.sgs.2015.04.017.
[7]. Ying-Xian, Zhang , L. Yan-Ju , and D. Yi-Hui . "Identification of winter long-lasting regional extreme low-temperature events in Eurasia and their variation during 1948-2017." (2021).
[8]. Han, Y. Q., Zhou, L. T., and Huang, R. H.. "Temporal and spatial characteristics of extreme low temperature events in winter and half-year in China and their relationship with the East Asian winter winds." Climate and Environmental Research 26. 01 (2021): 1-17.
[9]. Wang, Bingjie, et al. "Changes in extreme cold events in China in the last 100 years based on reanalyzed data." Advances in Climate Change Research 19.04(2023): 403-417.
[10]. Shao, Wei-Ling, et al. "Key influencing factors of winter extreme low temperature events in northwest China region before and after climate warming." Desert and Oasis Meteorology 18.06(2024): 64-71.
[11]. Zhu, Yali , F. Song , and D. Guo . "Interdecadal changes in the frequency of winter extreme cold events in North China during 1989–2021." Atmospheric and Oceanic Science Letters 17.4(2024).
[12]. Min JZ, et al. "Interdecadal variability of extreme low winter temperatures and their causes in northeast China." Meteorological science 42.06(2022): 711-720.
[13]. CMA Climate Change Centre. Blue Book on Climate Change in China (2022). Science Press, 2022.
[14]. Hoskins, Brian , and R. P. Pearce . "Large-Scale Dynamical Processes in the Atmosphere." Academic Press, (1983).
[15]. Jia Wu, and Xuejie Gao. "A set of gridded day-by-day observations of the Chinese region and comparison with other data." Geophysical Journal 56.4 (2013): 1102-1111.
[16]. National Oceanic and Atmospheric Administration. "NCEP Reanalysis Data." NOAA Physical Sciences Laboratory, U.S. Department of Commerce, [https: //psl.noaa.gov], Accessed 21 Nov. 2018.
[17]. Pan Xiaohua, Zhai Panmao. "Selection and analysis of temperature extremes." Meteorology 10(2002): 28-31.
[18]. Zhang, N., Sun, Zao-Bo, and Zeng, G. "Changes in extreme temperatures in China from 1955 to 2005." Journal of Nanjing Meteorological Institute .01(2008): 123-128. doi: 10.13878/j.cnki.dqkxxb.2008.01.004.
[19]. Fu Dongxue, et al. "Spatial and temporal characteristics of extreme low temperatures in China during the winter months of 1955-2006." Meteorological Science 31.03 (2011): 274-281.
[20]. Huang, J. Y.. Meteorological Statistical Analysis and Forecasting Methods. Meteorological Press, 1990.
[21]. Smith, Thomas M. , et al. "Reconstruction of historical sea surface temperatures using empirical orthogonal functions." J. Climate 9.6(1996): 1403-1420.
[22]. Kalpi, Damir , N. Hlupi , and M. Lovri . "Student's t-Tests." International Encyclopedia of Statistical Science Part (2011): 1559-1563.
[23]. Hu W.W.. Changing characteristics of extreme low temperature in northern China and its prediction under 1.5/2°C global warming.2019.Nanjing University of Information Engineering, MA thesis.doi: 10.27248/d.cnki.gnjqc.2019.000101.
[24]. Kang, L., et al. "Interannual variability of winter temperatures in China and its relationship with atmospheric circulation and SST anomalies." Climate and Environmental Research 14.01 (2009): 45-53.
[25]. Xiao, et al. "Year‐to‐year variability of surface air temperature over China in winter." International Journal of Climatology: A Journal of the Royal Meteorological Society 38.4(2018): 1692-1705.
[26]. Zuo, Zhiyan , et al. "Variations of widespread extreme cold and warm days in winter over China and their possible causes." Science China(Earth Sciences) 2(2022).
[27]. North, Gerald R. , et al. "Sampling Errors in the Estimation of Empirical Orthogonal Functions." Monthly Weather Review 110.7(1982): 699.
[28]. Li, Think, and Wang, Y. G. "Characteristics of the atmospheric circulation in the Northern Hemisphere in the winter of 2022/2023 and its impact on China's weather and climate." Meteorology 49.07(2023): 881-891.
[29]. Park, Tae Won , et al. "Influences of Arctic Oscillation and Madden-Julian Oscillation on cold surges and heavy snowfalls over Korea: A case study for the winter of 2009–2010." Journal of Geophysical Research Atmospheres 115.D23(2010): D23122.
[30]. Yang, Xiaoye , et al. "Interdecadal Variation of Winter Cold Surge Path in East Asia and Its Relationship with Arctic Sea Ice." Journal of Climate 33.11(2020).
[31]. Beibei Hu, Fei Huang, and Peng Jin. "Relationship between extreme winter low temperature events and SST and sea ice in China." Climate Change Research Letters 4.3 (2015): 12.
[32]. Yu Jiahui. Structural asymmetry mechanism of El Niño and La Niña.2023.Nanjing University of Information Engineering, MA thesis. doi: 10.27248/d.cnki.gnjqc.2023.000099.
[33]. Watanabe, M., and T. Nitta. "Decadal Change in the Atmospheric Circulation and Associated Surface Climate Variations in the Northern Hemispheric Winter." Journal of Climate, vol. 12, 1999, pp. 494-510.
[34]. Clark, Martyn P. , and M. C. Serreze . "Effects of Variations in East Asian Snow Cover on Modulating Atmospheric Circulation over the North Pacific Ocean." Journal of Climate 13.20(2010): 3700-3710.
[35]. Ye Ducheng, and Gao Youxi. Meteorology of the Tibetan Plateau. Science Press, 1979.
Cite this article
Ning,Z. (2025). Spatiotemporal Evolution of Winter Extreme Low Temperature Days in China and Their Causality. Theoretical and Natural Science,119,173-182.
Data availability
The datasets used and/or analyzed during the current study will be available from the authors upon reasonable request.
Disclaimer/Publisher's Note
The statements, opinions and data contained in all publications are solely those of the individual author(s) and contributor(s) and not of EWA Publishing and/or the editor(s). EWA Publishing and/or the editor(s) disclaim responsibility for any injury to people or property resulting from any ideas, methods, instructions or products referred to in the content.
About volume
Volume title: Proceedings of ICEGEE 2025 Symposium: Sensor Technology and Multimodal Data Analysis
© 2024 by the author(s). Licensee EWA Publishing, Oxford, UK. This article is an open access article distributed under the terms and
conditions of the Creative Commons Attribution (CC BY) license. Authors who
publish this series agree to the following terms:
1. Authors retain copyright and grant the series right of first publication with the work simultaneously licensed under a Creative Commons
Attribution License that allows others to share the work with an acknowledgment of the work's authorship and initial publication in this
series.
2. Authors are able to enter into separate, additional contractual arrangements for the non-exclusive distribution of the series's published
version of the work (e.g., post it to an institutional repository or publish it in a book), with an acknowledgment of its initial
publication in this series.
3. Authors are permitted and encouraged to post their work online (e.g., in institutional repositories or on their website) prior to and
during the submission process, as it can lead to productive exchanges, as well as earlier and greater citation of published work (See
Open access policy for details).
References
[1]. Cao Chen, and Wang Zengping. "Reflections on the impact of extreme weather on new power systems and countermeasures." Southern Energy Construction 12.1(2025): 43-57.
[2]. Lesk, Corey , P. Rowhani , and N. Ramankutty . "Influence of extreme weather disasters on global crop production." Nature 529.7584(2016): 84.
[3]. Katznelson, Ethan , et al. "Climate Change and Congenital Heart Disease: A Narrative Review." Congenital Heart Disease 19.6(2024).
[4]. Hu Beibei. Interannual and interdecadal variability of extreme low temperature events in China. Diss. of Ocean University of China, 2015.
[5]. Intergovernmental Panel on Climate Change. Climate Change 2023: Synthesis Report. Contribution of Working Groups I, II and III to the Sixth Assessment Report of the Intergovernmental Panel on Climate Change. IPCC, 2023, DOI: 10.59327/IPCC/AR6-9789291691647.
[6]. Liu, S., et al. "Impacts of East Asian winter winds on winter temperature changes in northeastern China." Geoscience 35. 04 (2015): 507-514. doi: 10.13249/j.cnki.sgs.2015.04.017.
[7]. Ying-Xian, Zhang , L. Yan-Ju , and D. Yi-Hui . "Identification of winter long-lasting regional extreme low-temperature events in Eurasia and their variation during 1948-2017." (2021).
[8]. Han, Y. Q., Zhou, L. T., and Huang, R. H.. "Temporal and spatial characteristics of extreme low temperature events in winter and half-year in China and their relationship with the East Asian winter winds." Climate and Environmental Research 26. 01 (2021): 1-17.
[9]. Wang, Bingjie, et al. "Changes in extreme cold events in China in the last 100 years based on reanalyzed data." Advances in Climate Change Research 19.04(2023): 403-417.
[10]. Shao, Wei-Ling, et al. "Key influencing factors of winter extreme low temperature events in northwest China region before and after climate warming." Desert and Oasis Meteorology 18.06(2024): 64-71.
[11]. Zhu, Yali , F. Song , and D. Guo . "Interdecadal changes in the frequency of winter extreme cold events in North China during 1989–2021." Atmospheric and Oceanic Science Letters 17.4(2024).
[12]. Min JZ, et al. "Interdecadal variability of extreme low winter temperatures and their causes in northeast China." Meteorological science 42.06(2022): 711-720.
[13]. CMA Climate Change Centre. Blue Book on Climate Change in China (2022). Science Press, 2022.
[14]. Hoskins, Brian , and R. P. Pearce . "Large-Scale Dynamical Processes in the Atmosphere." Academic Press, (1983).
[15]. Jia Wu, and Xuejie Gao. "A set of gridded day-by-day observations of the Chinese region and comparison with other data." Geophysical Journal 56.4 (2013): 1102-1111.
[16]. National Oceanic and Atmospheric Administration. "NCEP Reanalysis Data." NOAA Physical Sciences Laboratory, U.S. Department of Commerce, [https: //psl.noaa.gov], Accessed 21 Nov. 2018.
[17]. Pan Xiaohua, Zhai Panmao. "Selection and analysis of temperature extremes." Meteorology 10(2002): 28-31.
[18]. Zhang, N., Sun, Zao-Bo, and Zeng, G. "Changes in extreme temperatures in China from 1955 to 2005." Journal of Nanjing Meteorological Institute .01(2008): 123-128. doi: 10.13878/j.cnki.dqkxxb.2008.01.004.
[19]. Fu Dongxue, et al. "Spatial and temporal characteristics of extreme low temperatures in China during the winter months of 1955-2006." Meteorological Science 31.03 (2011): 274-281.
[20]. Huang, J. Y.. Meteorological Statistical Analysis and Forecasting Methods. Meteorological Press, 1990.
[21]. Smith, Thomas M. , et al. "Reconstruction of historical sea surface temperatures using empirical orthogonal functions." J. Climate 9.6(1996): 1403-1420.
[22]. Kalpi, Damir , N. Hlupi , and M. Lovri . "Student's t-Tests." International Encyclopedia of Statistical Science Part (2011): 1559-1563.
[23]. Hu W.W.. Changing characteristics of extreme low temperature in northern China and its prediction under 1.5/2°C global warming.2019.Nanjing University of Information Engineering, MA thesis.doi: 10.27248/d.cnki.gnjqc.2019.000101.
[24]. Kang, L., et al. "Interannual variability of winter temperatures in China and its relationship with atmospheric circulation and SST anomalies." Climate and Environmental Research 14.01 (2009): 45-53.
[25]. Xiao, et al. "Year‐to‐year variability of surface air temperature over China in winter." International Journal of Climatology: A Journal of the Royal Meteorological Society 38.4(2018): 1692-1705.
[26]. Zuo, Zhiyan , et al. "Variations of widespread extreme cold and warm days in winter over China and their possible causes." Science China(Earth Sciences) 2(2022).
[27]. North, Gerald R. , et al. "Sampling Errors in the Estimation of Empirical Orthogonal Functions." Monthly Weather Review 110.7(1982): 699.
[28]. Li, Think, and Wang, Y. G. "Characteristics of the atmospheric circulation in the Northern Hemisphere in the winter of 2022/2023 and its impact on China's weather and climate." Meteorology 49.07(2023): 881-891.
[29]. Park, Tae Won , et al. "Influences of Arctic Oscillation and Madden-Julian Oscillation on cold surges and heavy snowfalls over Korea: A case study for the winter of 2009–2010." Journal of Geophysical Research Atmospheres 115.D23(2010): D23122.
[30]. Yang, Xiaoye , et al. "Interdecadal Variation of Winter Cold Surge Path in East Asia and Its Relationship with Arctic Sea Ice." Journal of Climate 33.11(2020).
[31]. Beibei Hu, Fei Huang, and Peng Jin. "Relationship between extreme winter low temperature events and SST and sea ice in China." Climate Change Research Letters 4.3 (2015): 12.
[32]. Yu Jiahui. Structural asymmetry mechanism of El Niño and La Niña.2023.Nanjing University of Information Engineering, MA thesis. doi: 10.27248/d.cnki.gnjqc.2023.000099.
[33]. Watanabe, M., and T. Nitta. "Decadal Change in the Atmospheric Circulation and Associated Surface Climate Variations in the Northern Hemispheric Winter." Journal of Climate, vol. 12, 1999, pp. 494-510.
[34]. Clark, Martyn P. , and M. C. Serreze . "Effects of Variations in East Asian Snow Cover on Modulating Atmospheric Circulation over the North Pacific Ocean." Journal of Climate 13.20(2010): 3700-3710.
[35]. Ye Ducheng, and Gao Youxi. Meteorology of the Tibetan Plateau. Science Press, 1979.