


1. Introduction
Customer churn — customers terminating their services in any kind of business — is a common business practice today, be it telecom, Internet, or finance industry. Churn rate is the percentage of users that stop using a service divided by the total number of active customers at any one time. It has been proven to be a much more efficient metric for long-run competitiveness compared to acquisition cost [1]. However, traditional manual analysis methods are overwhelmed by the scale and complexity of this data: how can you make sense of it all? Over the past few years, however, various machine learning techniques to extract data mining have been employed tremendously in churn prediction modeling, which can help organizations to predict when a customer is likely to leave and take action accordingly [2].
Logistic Regression, Decision Tree, and K-Nearest Neighbours (KNN) are the classical algorithms in classification, which can be easily implemented using R language and have been widely employed in churn analysis [3,4]. In addition, Amin et al. presented a rough set-based mechanism, which successfully copes with uncertainty and enhances churn prediction accuracy in the telecommunication field [5]. The paper systematically compares these three models by applying them to the Telco Customer Churn dataset in order to evaluate how well they work for churn prediction.
These days, customer churn prediction is a newly boosted topic in academia and industry. Huang et al. used ensemble classification models for accurate prediction in telecoms [6]. Idris et al. used Minimum Redundancy Maximum Relevance (mRMR) feature selection and RotBoost to achieve better performance over an enhanced model [7]. Keramati et al. employed several other data mining methods harmoniously to increase precision, whereas Verbeke et al. made important contributions and also sought to underline the importance of model interpretability in business applications [3,8]. Najar et al. performed a comparative analysis of machine learning models for churn prediction [9]. In a recent study, Ullah et al. showed the enhancement of churn prediction accuracy via hybrid model combinations and ensemble learning using different methods [10]. Furthermore, A comprehensive review of machine learning applications in churn prediction identified current challenges such as class imbalance and overfitting, and recommended future directions involving deep learning and explainable AI [11].
2. Method
2.1. Data source
This study utilizes the publicly available Telco Customer Churn dataset from the Kaggle platform, which contains customer information from a telecommunications provider, including their subscription status and service usage behaviour [12]. The dataset comprises 7,043 customer records with multiple variables related to service details, charges, any text or content that exceeds the specified margins will not be printed.
2.2. Variable description and data preprocessing
The dataset includes 7,043 customers, 21 predictor variables, and one target variable (Churn). Key variables are summarized in Table 1.
|
Variable Name |
Meaning |
|
Gender |
Gender |
|
Senior Citizen |
Whether the customer is a senior citizen |
|
Tenure |
Number of consecutive months of service |
|
Phone Service |
Whether the customer subscribes to phone service |
|
Multiple Lines |
Whether the customer subscribes to multiple phone lines |
|
Internet Service |
Types of Internet Services |
|
Contract |
Contract type |
|
Monthly Charges |
Monthly spending amount |
|
Total Charges |
Total consumption amount |
|
Payment Method |
Mode of payment |
|
Churn |
Indicates whether the customer has discontinued the service (target variable)) |
During data preprocessing, all binary and categorical variables were converted into numerical or factor types suitable for modelling. Variables with over 20% of missing data were eliminated, whereas those with lower rates of missing values were filled in using suitable imputation techniques. All categorical variables underwent numerical encoding to ensure they were compatible with classification algorithms. The dataset was divided into a training set comprising 80% of the data and a testing set containing 20% for the purposes of model development and assessment.
2.3. Feature selection
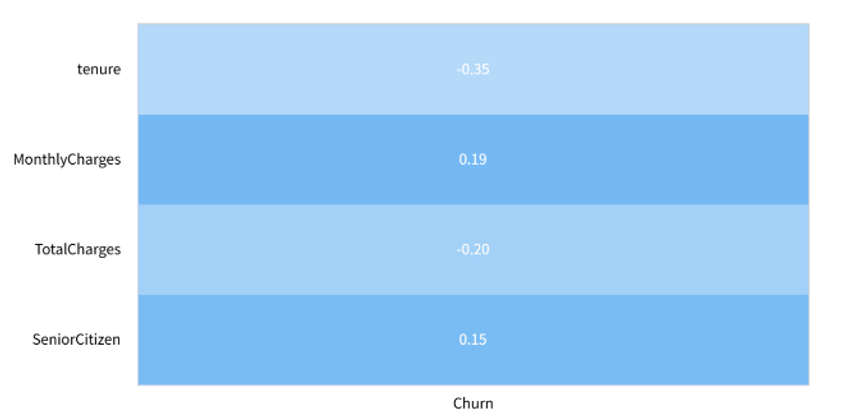
To mitigate the risk of introducing noise and redundancy that could hinder model performance, feature selection and dimensionality reduction were conducted. Initially, a correlation analysis was performed to eliminate variables weakly associated with customer churn. Subsequently, principal component analysis (PCA) was applied to identify the most informative features. Only principal components with a cumulative variance explanation exceeding 85% were retained. This process aimed to reduce model complexity while improving generalization ability, as shown in Figure 1.
2.4. Model concepts
This study adopts three commonly used classification models for churn prediction: Logistic Regression, Decision Tree, and K-Nearest Neighbours (KNN). Logistic Regression is a commonly utilized generalized linear model that is effective for binary classification tasks, as it delivers interpretable probability estimates. Decision Trees operate by recursively partitioning the data according to feature values, resulting in clear visual representations that enhance interpretability. KNN, a form of lazy learning algorithm, classifies new instances by referencing the majority label among its closest neighbours within the feature space. All models were developed using pre-processed and selected features, employing an 80:20 division for the training and testing datasets.
2.5. Machine learning workflow
Model performance was evaluated using the confusion matrix and its derived metrics.
Where True Positive (TP) indicates the actual churns that have been accurately anticipated, True Negative (TN) denotes the non-churns that have been correctly identified, False Positive (FP) represents the non-churns mistakenly classified as churn, and False Negative (FN) signifies the churns that have been inaccurately categorized as non-churn.
In addition to accuracy, precision, recall, and F1-score were employed for comprehensive evaluation. These metrics were used to compare the effectiveness and suitability of each model in identifying churn customers.
3. Results and discussion
3.1. Customer churn statistics
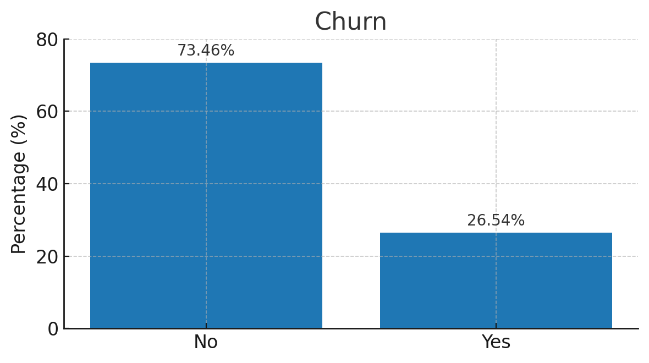
In the analysed dataset, around 26.5% of customers discontinued their service, whereas 73.5% continued. Figure 2 illustrates the distribution between churned and non-churned customers.
3.2. Model performance comparison
The performance indicators for the three models on the test set are consolidated in Table 2:
|
Model |
Accuracy |
Precision |
Recall |
F1 Score |
|
Logistic Regression |
0.803 |
0.715 |
0.620 |
0.664 |
|
Decision Tree |
0.786 |
0.693 |
0.605 |
0.646 |
|
K-Nearest Neighbours (K=7) |
0.811 |
0.725 |
0.645 |
0.682 |
Table 2 presents the performance metrics, which encompass accuracy, precision, recall, and F1 score for Logistic Regression, Decision Tree, and K-Nearest Neighbors (KNN). KNN achieved the highest accuracy (81.1%) and F1 score, while Logistic Regression demonstrated relatively high precision and good interpretability.
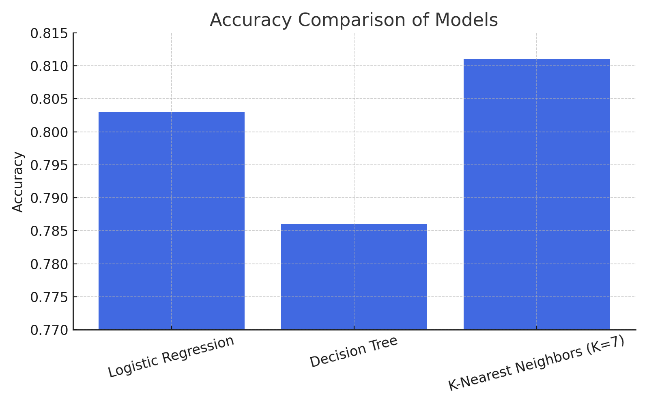
Figure 3 illustrates the performance of the three models on the test dataset. The KNN model demonstrated the greatest accuracy, closely succeeded by the Logistic Regression model, while the Decision Tree model recorded the least effective performance, thereby reinforcing the findings presented in Table 3.
3.3. KNN confusion matrix analysis
Table 3 presents the confusion matrix for the KNN model on the test set:
|
Actual/Predicted |
Predicted non-churn |
Predicted Churn |
|
Actual non-churn |
1220 |
180 |
|
Actual Churn |
88 |
315 |
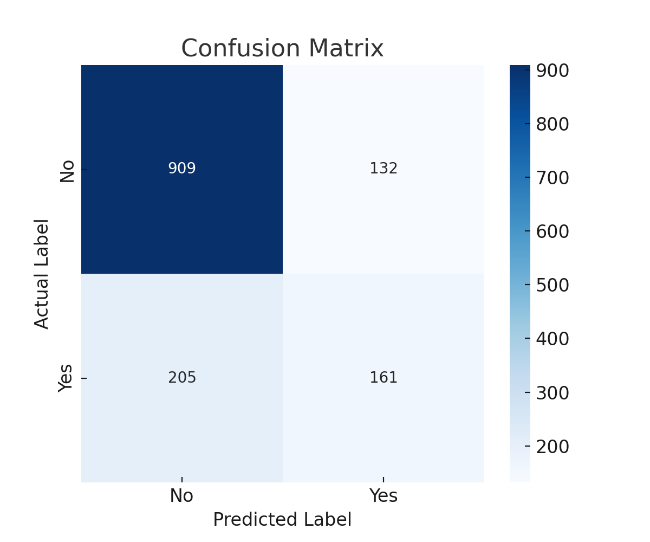
Figure 4 provides a heatmap visualization of the confusion matrix. The KNN model showed strong performance in identifying non-churned customers (negative class), correctly predicting 1,220 non-churned users, while misclassifying 180 of them as churned. It correctly identified 315 churned customers but failed to detect 88.
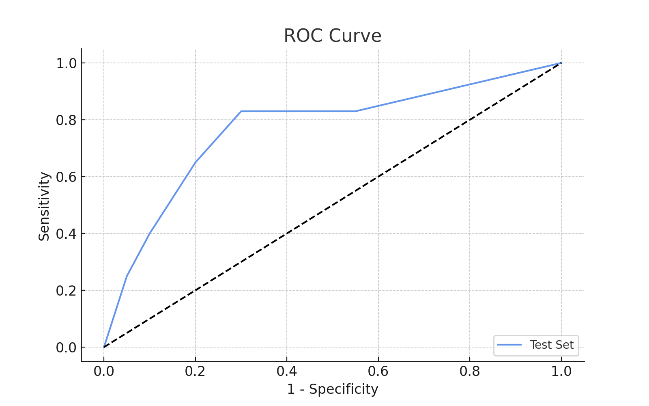
As illustrated by the ROC curve presented in Figure 5, the overall classification performance of the KNN model is moderate. Although the ROC curve reflects performance across different thresholds, the AUC score did not reach an ideal level due to class imbalance. Overall, the model performs well in identifying non-churned customers but recall for churned users remains limited. While precision and recall are relatively balanced, the limited number of churned instances in the dataset slightly affects KNN's performance on the positive class.
4. Conclusions
This study employed three classic machine learning classification models—Logistic Regression, Decision Tree, and K-Nearest Neighbors (KNN) to construct predictive models for customer churn using the Telco Customer Churn dataset. Each model underwent preprocessing and was evaluated using various performance metrics.
The paper analysis results that the KNN model has performed better out of the three models in all performance metrics, providing maximum accuracy (81.1%), precision, recall, and F1-score. The Logistic Regression can be viewed as behaving consistently and as exhibiting a strong interpretable nature, making it compatible with business decision-making. The other, Decision Tree model, was easier to understand and more interpretable but had lower predictive performance, which could lead to overfitting.
Also, the confusion matrix and ROC curve were used to evaluate the models. What the results produced was that all 3 models have something to offer, in a sense: Logistic Regression had good precision, KNN struck a balance between precision and recall, and Decision Tree is probably most useful for scenarios where explainability is needed.
Conclusively, for the Telco Customer Churn dataset, KNN had the best models in terms of classification performance. The empirical analysis above could provide some practical inspiration to both academia and industry on customer churn management and prediction; yet it is also subject to the problem of generalization due to the limited number of datasets that have been used.
References
[1]. Coussement, K., & Van den Poel, D. (2008). Churn prediction in subscription services: An application of support vector machines while comparing two parameter-selection techniques. Expert Systems with Applications, 34(1), 313–327.
[2]. Bahnsen, A. C., Aouada, D., & Ottersten, B. (2015). Example-dependent cost-sensitive decision trees. Expert Systems with Applications, 42(19), 6609–6619.
[3]. Verbeke, W., Martens, D., Mues, C., & Baesens, B. (2011). Building comprehensible customer churn prediction models with advanced rule induction techniques. Expert Systems with Applications, 38(3), 2354–2364.
[4]. Lariviere, B., & Van den Poel, D. (2005). Predicting customer retention and profitability by using random forests and regression forests techniques. Expert Systems with Applications, 29(2), 472–484.
[5]. Amin, A., Anwar, S., Adnan, A., et al. (2019). Customer churn prediction in the telecommunication sector using a rough set approach. Neurocomputing, 237, 242-254.
[6]. Huang, B., Kechadi, T., & Buckley, B. (2012). Customer churn prediction in telecommunications. Expert Systems with Applications, 39(1), 1414–1425.
[7]. Idris, A., Khan, A., & Lee, Y. S. (2013). Intelligent churn prediction in telecom: Employing mRMR feature selection and RotBoost based ensemble classification. Applied Intelligence, 39(3), 659–672.
[8]. Keramati, A., Jafari-Marandi, R., Aliannejadi, M., et al. (2014). Improved churn prediction in telecommunication industry using data mining techniques. Applied Soft Computing, 24, 994–1012.
[9]. Najar, S., Chahbar, M., & Mouhoub, M. N. (2021). Predicting customer churn in the telecommunication industry using machine learning techniques. Procedia Computer Science, 194, 229-236.
[10]. Ullah, I., Aslam, M., Latif, S., & Qureshi, K. N. (2019). Customer churn prediction in telecommunication industry using ensemble learning. TELKOMNIKA, 17(3), 1305–1311.
[11]. Zhu, X., et al. (2022). A review of machine learning for customer churn prediction. Artificial Intelligence Review, 55(4), 3213–3236.
[12]. Kaggle. (2023). Telco Customer Churn Dataset.
Cite this article
Wei,S. (2025). Comparative Analysis of Machine Learning Models for Telecom Customer Churn Prediction. Theoretical and Natural Science,134,24-30.
Data availability
The datasets used and/or analyzed during the current study will be available from the authors upon reasonable request.
Disclaimer/Publisher's Note
The statements, opinions and data contained in all publications are solely those of the individual author(s) and contributor(s) and not of EWA Publishing and/or the editor(s). EWA Publishing and/or the editor(s) disclaim responsibility for any injury to people or property resulting from any ideas, methods, instructions or products referred to in the content.
About volume
Volume title: Proceedings of CONF-APMM 2025 Symposium: Controlling Robotic Manipulator Using PWM Signals with Microcontrollers
© 2024 by the author(s). Licensee EWA Publishing, Oxford, UK. This article is an open access article distributed under the terms and
conditions of the Creative Commons Attribution (CC BY) license. Authors who
publish this series agree to the following terms:
1. Authors retain copyright and grant the series right of first publication with the work simultaneously licensed under a Creative Commons
Attribution License that allows others to share the work with an acknowledgment of the work's authorship and initial publication in this
series.
2. Authors are able to enter into separate, additional contractual arrangements for the non-exclusive distribution of the series's published
version of the work (e.g., post it to an institutional repository or publish it in a book), with an acknowledgment of its initial
publication in this series.
3. Authors are permitted and encouraged to post their work online (e.g., in institutional repositories or on their website) prior to and
during the submission process, as it can lead to productive exchanges, as well as earlier and greater citation of published work (See
Open access policy for details).
References
[1]. Coussement, K., & Van den Poel, D. (2008). Churn prediction in subscription services: An application of support vector machines while comparing two parameter-selection techniques. Expert Systems with Applications, 34(1), 313–327.
[2]. Bahnsen, A. C., Aouada, D., & Ottersten, B. (2015). Example-dependent cost-sensitive decision trees. Expert Systems with Applications, 42(19), 6609–6619.
[3]. Verbeke, W., Martens, D., Mues, C., & Baesens, B. (2011). Building comprehensible customer churn prediction models with advanced rule induction techniques. Expert Systems with Applications, 38(3), 2354–2364.
[4]. Lariviere, B., & Van den Poel, D. (2005). Predicting customer retention and profitability by using random forests and regression forests techniques. Expert Systems with Applications, 29(2), 472–484.
[5]. Amin, A., Anwar, S., Adnan, A., et al. (2019). Customer churn prediction in the telecommunication sector using a rough set approach. Neurocomputing, 237, 242-254.
[6]. Huang, B., Kechadi, T., & Buckley, B. (2012). Customer churn prediction in telecommunications. Expert Systems with Applications, 39(1), 1414–1425.
[7]. Idris, A., Khan, A., & Lee, Y. S. (2013). Intelligent churn prediction in telecom: Employing mRMR feature selection and RotBoost based ensemble classification. Applied Intelligence, 39(3), 659–672.
[8]. Keramati, A., Jafari-Marandi, R., Aliannejadi, M., et al. (2014). Improved churn prediction in telecommunication industry using data mining techniques. Applied Soft Computing, 24, 994–1012.
[9]. Najar, S., Chahbar, M., & Mouhoub, M. N. (2021). Predicting customer churn in the telecommunication industry using machine learning techniques. Procedia Computer Science, 194, 229-236.
[10]. Ullah, I., Aslam, M., Latif, S., & Qureshi, K. N. (2019). Customer churn prediction in telecommunication industry using ensemble learning. TELKOMNIKA, 17(3), 1305–1311.
[11]. Zhu, X., et al. (2022). A review of machine learning for customer churn prediction. Artificial Intelligence Review, 55(4), 3213–3236.
[12]. Kaggle. (2023). Telco Customer Churn Dataset.