


1. Introduction
Tesla, Inc. stands as a leading American innovator in electric vehicles and clean energy. Because of the potential of new energy vehicles, its prospects shine brightly. This research focus on the using LSTM model to predict the price returns of Tesla Inc. stock. Although different deep learning models may be suitable for different stock prediction environments, the LSTM model has the best performance among the three models in this research.
LSTM is a deep learning algorithm with feedback connections that excels in processing sequential data. Its architecture includes a cell, output gate, input gate, and forget gate [1]. LSTM model is a brilliant method to keep efficiency and accuracy for the stock prediction. The key attribute of LSTM networks is their capability to learn long-term dependencies, a feature that was unattainable with Recurrent Neural Networks (RNNs). To predict subsequent time steps, the network necessitates an update to its weight values, which in turn demands the retention of data from the initial time step [2].
The dataset is taken from the TESLA Stock Data. The historical data in this dataset pertains to the TESLA INC. stock (TSLA). The currency is USD, and the data is available on a daily basis. The dataset includes 2956 data points from 2010 to 2022, including the first and last transaction of a trading day, the highest and lowest price during a trading day, and the number of units exchanged in a day. A wealth of useful data is available from the TESLA Stock Data for the LSTM model to train and test. Pre-processing the data is a crucial step in the LSTM model. It could increase the model’s forecast accuracy and operational effectiveness.
The performance metrics like MAE, MSE, and RMSE are used to show the accuracy of the different models. In this research, it can be used to proof which model have the most accurate result among LSTM model, Linear regression, and Random Forest. Using multiple metrics can help to build a convinced result and reduce errors. Numerous performance and error metrics are available for addressing regression and classification issues. The study advocates for the use of multi-fitness criteria—employing a range of metrics concurrently on a single problem—to bolster the validity of Machine Learning (ML) models, as employing multiple metrics may mitigate some of the constraints presented by individual metrics [3].
The profits realized by an investor are derived from two main elements - firstly, the capital gain, which is the variation in the asset’s price, and secondly, the cash flows, which can take forms such as dividends or coupons. It is crucial to note that these two elements, despite their distinctive natures, collectively constitute the total returns achieved from an investment [4]. It is the detailed reason of the machine learning model cannot be the powerful guide to make the investment decisions.
Following is a summary of the remaining sections of this article: Sections 2 and 3 contain a literature review, methods for the LSTM model and alternative models, findings, a model comparison, and Sections 4 and 5 provide a conclusion.
2. Literature Review
Narayana Darapaneni et al. utilized methods like LSTM and Random Forest, alongside other algorithms, to predict stock movements of companies like Reliance, HDFC Bank, TCS, and SBI using historical data and sentiment analysis. Results indicated that while LSTM had a better MAPE than the Random Forest model. However, no definitive trading strategy can forecast future stock Trends [1].
Kraus, M., and Feuerriegel, S. investigated the use of deep neural networks, like LSTM and RNN, to Predict stock price movements based on financial disclosures. By comparing traditional bag-of-words methods, deep learning model and the transfer learning, they found that deep learning models provided superior predictive performance. The result emphasized the importance of context-dependent information and non-linear relationships in financial decision support [5]. Convolutional neural networks (CNNs) are used in the algorithmic trading model CNN-TA that Sezer, O. B., and Ozbayoglu, A. M. created to transform financial time series into 2-D visual representations. Based on the original time series data, they classified these photos as Buy, Sell, or Hold. The Results showed that classic Buy and Hold strategies and other methods were outperformed by the CNN-TA model favored trading strategies [6].
The usefulness of different artificial neural network (ANN) models, including the multi-layer perceptron (MLP) and dynamic artificial neural network (DAN2), for predicting stock exchange rates was examined by Guresen, E. et al. The outcomes show that the traditional MLP model performed better than other models. The study also highlighted the MLP model’s potential as a solid tool for stock market forecasting [7].
In order to forecast stock market indices, Ali, M., et al. developed a hybrid new forecasting method that integrated the long-short term memory (LSTM) network with EMD based on the Akima spline interpolation technique. The KSE-100 index of the Pakistan Stock Exchange was subjected to this methodology, and its performance was contrasted with that of more established models like SVM, Random Forest, and Decision Tree. The outcomes showed that the suggested hybrid Akima-EMD-LSTM model performed better in predicting accuracy than all other models, making it a suggested model for stock prediction [8].
3. Data analysis
3.1. Machine Learning Introduction
Price return is how much you earn from stock based on its increase in value, but not counting any.
Other income like dividends. The calculation formula is formula 1:
\( Total Stock Return = (P1– P0)+\frac{D}{P0}\ \ \ (1) \)
P0: Initial Stock Price
P1: Ending Stock Price (Period 1)
D: Dividends
The vanishing gradient issue in conventional RNNs is addressed by the LSTM model, a sort of recurrent neural network that can remember data over lengthy sequences. It is made up of a cell and three gates (input, output, and forget) that control information flow and allow the network to choose to keep or delete data.

Figure 1. LSTM model
Forget gate as follows:
\( {f_{t}}= {σ_{g}}({W_{f}}{x_{t}}+ {U_{f}}{c_{\lbrace t-1\rbrace }}+ {b_{f}}) \)
Input gate:
\( {i_{t}}= {σ_{g}}({W_{i}}{x_{t}}+ {U_{i}}{c_{\lbrace t-1\rbrace }}+ {b_{i}}) \)
Output gate:
\( {o_{t}}= {σ_{g}}({W_{o}}{x_{t}}+ {U_{o}}{c_{\lbrace t-1\rbrace }}+ {b_{o}}) \)
Cell state update:
\( {c_{t}}= {f_{t}}⊙{c_{\lbrace t-1\rbrace }}+ {i_{t}}⊙{σ_{c({W_{c}}{x_{t}}+ {b_{c}})}} \)
Hidden state update:
\( {h_{t}}= {o_{t}}⊙{σ_{h({c_{t}})}} \)
Linear Regression
Formula 2 show the relationship between a dependent variable and one or more independent variables is called a linear regression.
\( Y = a + bX + ε\ \ \ (2) \)
Where:
• Y is the dependent variable,
• X is the independent variable,
• a is the y-intercept,
• b is the slope of the line,
• ε is the residuals.
Linear regression emerges as a great option for analyses involving smaller sample sizes, offering models that are comparatively straightforward to interpret and comprehend. However, it may fail when confronted with an excessive number of predictor variables [9]. It can be used in the research because the data sample is not large. However, it may provide incorrect prediction in the large data sample model.
In order to anticipate things more accurately and prevent drawing the erroneous conclusions when forecasting categories or continuous numbers, Random Forest is an ensemble learning technique that builds several decision trees using bagging and random feature selection. Employing majority voting for classification and averaging for regression. The algorithm provides robust predictions, even when some data is missing, it can still make reliable guesses. It consists of a substantial number of decision trees, collectively referred to as a forest, which essentially average the predictive results of the individual trees. The technique incorporates three randomness-based principles: randomly choosing training data for building trees, randomly selecting subsets of variables when splitting nodes, and only taking into account a portion of all variables for node splitting in each foundational decision tree. Each fundamental tree in a random forest learns from a random sample taken from the dataset during training. [10]
The research used historical daily data to predict Tesla’s daily stock returns with three machines. learning models: Linear Regression, Random Forest, and LSTM model. Initial data preparation involved scaling the returns, creating a 7-days look-back feature. Afterward, training and testing segments are created from the dataset. Each model was systematically trained on the training data, followed by evaluation using performance metrics such as MSE, MAE, and RMSE. The residuals of the models were used to understand the errors of prediction.
3.2. Data Source
The data is from Kaggle, a public repository. The TESLA Stock Data dataset, which captures daily stock prices from 2010 through 2022, goes by that name. The dataset includes 2956 data points, including the highest and lowest prices as well as the first and last transaction of a trading day. The data is based on daily level and the currency is USD.
3.3. Result
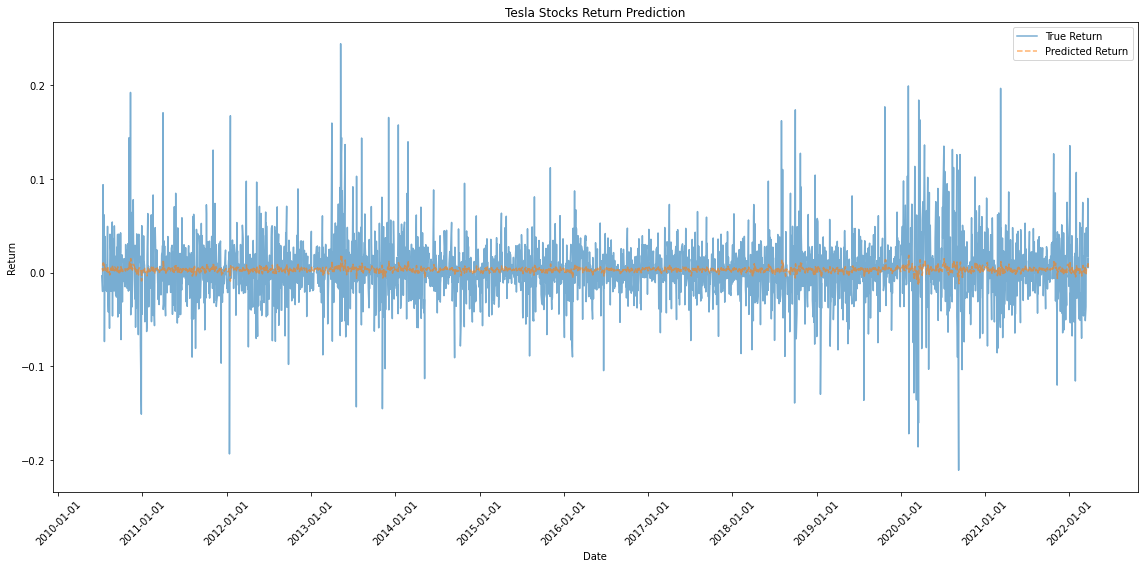
Figure 2. LSTM model return result
Figure 2 display the returns and the predicted return of the Tesla stock in 12 years. It reflects the daily changes in Tesla stock over the 12-year period.
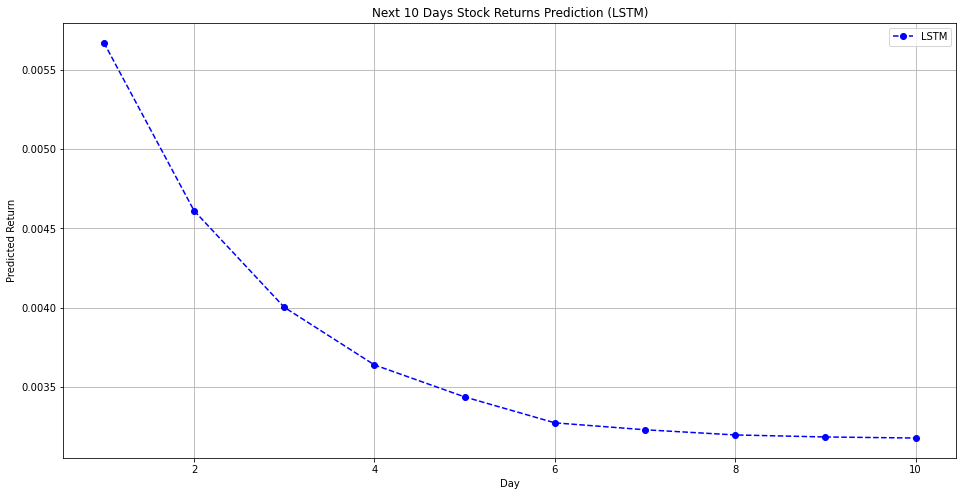
Figure 3. Predict next 10 days
Figure 3 reflect the next 10 days changes rate based on the LSTM model prediction. It shows Tesla stock slowly growing over the next ten days.
Table 1. Result of different comparison
LSTM | Linear Regression | Random Forest | |
MSE | 0.006498 | 0.006575 | 0.007543 |
MAE | 0.055308 | 0.556635 | 0.058749 |
RMSE | 0.080610 | 0.081088 | 0.086849 |
LSTM model, Linear Regression, and Random Forest MSE, MAE, and RMSE values were compared in Table 1 to determine which model performed the best. As the table 1 shown, all three criteria got the lowest values for the LSTM model. The outcome showed that the LSTM model performed better than the other models in this evaluation and had superior accuracy.
4. Conclusion
The research on predicting Tesla stock returns demonstrated that the LSTM model clearly outper-formed other forecasting models such as Linear Regression and Random Forest. The LSTM model exhibited enhanced performance metrics such as MSE, MAE, and RMSE. They are vital in gauging the accuracy and reliability of any predictive model.
However, the study still has limitations. Firstly, it focused solely on Tesla stock, which might limit the generalizability of the findings. Secondly the dataset of the research is not large enough to proof its accuracy in the real world. In addition, the predictability observed for Tesla stock might not be used in other stocks, thereby limiting the broader application of the findings of the research.
The stock market is a complex system influenced by a complex factor. Economic changes, market dynamics, and political decisions can all cause substantial impacts on stock prices. Therefore, even with a robust predictive model like the LSTM, it is challenging to avoid all potential influences, making it a tool to aid decision-making rather than a definitive guide for stock investments. Investors should not rely solely on the machine learning model result to make investment decisions.
References
[1]. Darapaneni, N. Paduri, A. R. Sharma, H. Manjrekar, M. Hindlekar, N. Bhagat, P. Agarwal, Y. 2022, Stock price prediction using sentiment analysis and deep learning for Indian markets. (arXiv preprintarXiv, vol. 2204).
[2]. Nikou, M. Mansourfar, G. Bagherzadeh, J. 2019, Stock price prediction using DEEP learning algorithm and its comparison with machine learning algorithms. (Intelligent Systems in Accounting, Finance and Management, vol. 26), no. 4, pp. 164-174.
[3]. Naser, M. Z. Alavi, A. H. 2021, Error metrics and performance fitness indicators for artificial intelligence and machine learning in engineering and sciences. (Architecture, Structures and Construction), pp. 1-19.
[4]. Hartzmark, S. M. Solomon, D. H. 2022, Reconsidering Returns. (The Review of Financial Studies, vol. 35), no. 1, pp. 343–393.
[5]. Kraus, M. Feuerriegel, S. 2017, Decision support from financial disclosures with deep neural networks and transfer learning. (Decision Support Systems, vol. 104), pp. 38-48.
[6]. Sezer, O. B. Ozbayoglu, A. M. 2018, Algorithmic financial trading with deep convolutional neural networks: Time series to image conversion approach. (Applied Soft Computing, vol. 70), 525-538.
[7]. Guresen, E. Kayakutlu, G. Daim, T. U. 2011, Using artificial neural network models in stock market index prediction. (Expert systems with Applications, vol. 38), (8), pp. 10389-10397.
[8]. Ali, M. Khan, D. M. Alshanbari, H. M. El-Bagoury, A. A. A. H. 2023, Prediction of complex stock market data using an improved hybrid emd-lstm model. (Applied Sciences, vol. 13), no. 3, pp. 1429.
[9]. Hope, T. M. 2020, Linear regression. In Machine Learning . (Academic Press). pp. 67-81.
[10]. Nabipour, M. Nayyeri, P. Jabani, H. Shahab, S. Mosavi, A. 2020, Predicting stock market trends using machine learning and deep learning algorithms via continuous and binary data; a comparative analysis. (IEEE Access, vol. 8), pp. 150199-150212.
Cite this article
Geng,Z. (2023). Tesla stock prediction and analysis based on LSTM model. Theoretical and Natural Science,26,68-73.
Data availability
The datasets used and/or analyzed during the current study will be available from the authors upon reasonable request.
Disclaimer/Publisher's Note
The statements, opinions and data contained in all publications are solely those of the individual author(s) and contributor(s) and not of EWA Publishing and/or the editor(s). EWA Publishing and/or the editor(s) disclaim responsibility for any injury to people or property resulting from any ideas, methods, instructions or products referred to in the content.
About volume
Volume title: Proceedings of the 3rd International Conference on Computing Innovation and Applied Physics
© 2024 by the author(s). Licensee EWA Publishing, Oxford, UK. This article is an open access article distributed under the terms and
conditions of the Creative Commons Attribution (CC BY) license. Authors who
publish this series agree to the following terms:
1. Authors retain copyright and grant the series right of first publication with the work simultaneously licensed under a Creative Commons
Attribution License that allows others to share the work with an acknowledgment of the work's authorship and initial publication in this
series.
2. Authors are able to enter into separate, additional contractual arrangements for the non-exclusive distribution of the series's published
version of the work (e.g., post it to an institutional repository or publish it in a book), with an acknowledgment of its initial
publication in this series.
3. Authors are permitted and encouraged to post their work online (e.g., in institutional repositories or on their website) prior to and
during the submission process, as it can lead to productive exchanges, as well as earlier and greater citation of published work (See
Open access policy for details).
References
[1]. Darapaneni, N. Paduri, A. R. Sharma, H. Manjrekar, M. Hindlekar, N. Bhagat, P. Agarwal, Y. 2022, Stock price prediction using sentiment analysis and deep learning for Indian markets. (arXiv preprintarXiv, vol. 2204).
[2]. Nikou, M. Mansourfar, G. Bagherzadeh, J. 2019, Stock price prediction using DEEP learning algorithm and its comparison with machine learning algorithms. (Intelligent Systems in Accounting, Finance and Management, vol. 26), no. 4, pp. 164-174.
[3]. Naser, M. Z. Alavi, A. H. 2021, Error metrics and performance fitness indicators for artificial intelligence and machine learning in engineering and sciences. (Architecture, Structures and Construction), pp. 1-19.
[4]. Hartzmark, S. M. Solomon, D. H. 2022, Reconsidering Returns. (The Review of Financial Studies, vol. 35), no. 1, pp. 343–393.
[5]. Kraus, M. Feuerriegel, S. 2017, Decision support from financial disclosures with deep neural networks and transfer learning. (Decision Support Systems, vol. 104), pp. 38-48.
[6]. Sezer, O. B. Ozbayoglu, A. M. 2018, Algorithmic financial trading with deep convolutional neural networks: Time series to image conversion approach. (Applied Soft Computing, vol. 70), 525-538.
[7]. Guresen, E. Kayakutlu, G. Daim, T. U. 2011, Using artificial neural network models in stock market index prediction. (Expert systems with Applications, vol. 38), (8), pp. 10389-10397.
[8]. Ali, M. Khan, D. M. Alshanbari, H. M. El-Bagoury, A. A. A. H. 2023, Prediction of complex stock market data using an improved hybrid emd-lstm model. (Applied Sciences, vol. 13), no. 3, pp. 1429.
[9]. Hope, T. M. 2020, Linear regression. In Machine Learning . (Academic Press). pp. 67-81.
[10]. Nabipour, M. Nayyeri, P. Jabani, H. Shahab, S. Mosavi, A. 2020, Predicting stock market trends using machine learning and deep learning algorithms via continuous and binary data; a comparative analysis. (IEEE Access, vol. 8), pp. 150199-150212.