


1. Introduction
The fourth industrial revolution, marked by digitization, is poised to bring about extensive and profound changes to the world. Digital Twin (DT), as the general-purpose technology to drive the next revolution, possesses immense potential for applications across various domains [1]. Initially derived from the “mirror space model” proposed by Michael Grieves in his product lifecycle management course, DT integrates simulation technologies from Multidisciplinary, Multiphysics, and Multiscale simulation techniques by utilizing data from physical models, sensor updates, and historical states. Employing this technique, the digital world in the information dimension and the physical world in terms of entities merge seamlessly, giving rise to Digital Twin Models (DTM) capable of reflecting the composition, characteristics, and functionalities of physical entities. In the digital realm, by observing the changes occurring in DTMs under the influence of various simulated factors, significant costs of trial and error in the physical world can be reduced, thereby providing decision-making plans for solving potential future issues.
To achieve a reasonable balance between environmental, social and economic performance in intelligent manufacturing system, and minimize manufacturing and processing costs as well as mitigating potential risks, DT maps real products onto DTMs. This enables the continuous presentation of the latest product state to manufacturers for evaluating product performance and eliminating the substandard items. In this regard, Yildiz combined DT with Virtual Reality (VR) [2], introducing the concept of a Virtual Factory that integrates simulation models of the factory and its subsystems. It employs a collaborative virtual reality learning scenario involving multi-user to demonstrate and evaluate wind turbines. This approach is regarded as a dynamic, open, and holistic solution. Although the integration of these two technologies enhances production efficiency and user experience in intelligent manufacturing, however, most studies have focused on non-living entities, leaving many issues regarding the application of DT in life forms worthy of further exploration.
In summary, in response to the limitations of existing research, this study delves into the field of agriculture and proposes a method for generating a digital twin model that can accurately replicate the growth status of plants. This method utilizes a 3D reconstruction technique based on deep learning to establish a one-to-one mapping relationship between physical entities and their digital counterparts, constructing a DTM of a life-form exemplified by plants, throughout the entire lifecycle. This enables the precise reproduction of objects from the physical world into the digital realm. In addition, to evaluate the construction effectiveness of the generated DTMs using the proposed method, we summarize a set of evaluation metrics and put forth a corresponding computational method to assess the effectiveness of the DTM generated at different periods of plant growth.
2. DTM Generation Methods Applicable to Plants
The life cycle of most plants begins with the germinating period, followed by the growing period, the maturing period, and eventually the wilting period. To accurately present the growth states of plants during each period using DTM, we proposed a method called Plant Digital Avatar Generating Method (PDAG) for generating digital twin models of plants. This method utilizes a multi-view geometry-based reconstruction approach to generate DTMs. To ensure that the generated DTMs not only faithfully capture the changes in plant morphology across different growing periods but also reflect the entire lifecycle of a plant, PDAG analyzes the growth characteristics, at different periods. and selects the algorithms from the Neural Radiance Fields (NeRF) [3]and the Neural Implicit Surfaces (NeuS) [4] for the current growth cycle. By adjusting the training network parameters of the chosen algorithm, PDAG generates DTMs with high simulation credibility. While delivering high-quality models, PDAG is able to effectively reduce the computational resources cost associated with the model generation, thus enhancing the effect of the DTM construction.
In this study, pea seedlings were selected as the research subject and cultivated using a combination of soil-based and hydroponics methods. The process of implementing PDAG is illustrated in figure 1, which is divided into three steps: data acquisition and processing, selecting the algorithm for generating DTM, and generating DTM.
The first step involves the collection and processing of growth data. Initially, video data of plants at various growth periods is collected at specific intervals. Subsequently, only the video data showing significant changes in plant characteristics is retained. Finally, a number of images are extracted from the videos to be utilized for generating DTMs.
The second step entails the selection of an algorithm for DTM generation. The purpose of data acquisition and processing is to identify the images required for generating DTMs, thereby enabling the construction of DTM using model’s generation algorithm. Initially, DTMs are generated at distinct periods according to the default settings of the algorithm. Subsequently, a comparative analysis is conducted between the generated models and the physical entities to assess differences, allowing for the identification of suitable DTM generation algorithms for varying plant growth periods.
The final step involves the generation of DTMs. The parameters of the selected algorithm’s generation network chosen and adjusted to generate DTMs with good construction outcomes. Additionally, parameter adjustments should consider to balance between model generation quality and computational resources consumption. In conclusion, by following the aforementioned three steps, an accurate digital representation of plants at different growth periods can be obtained.
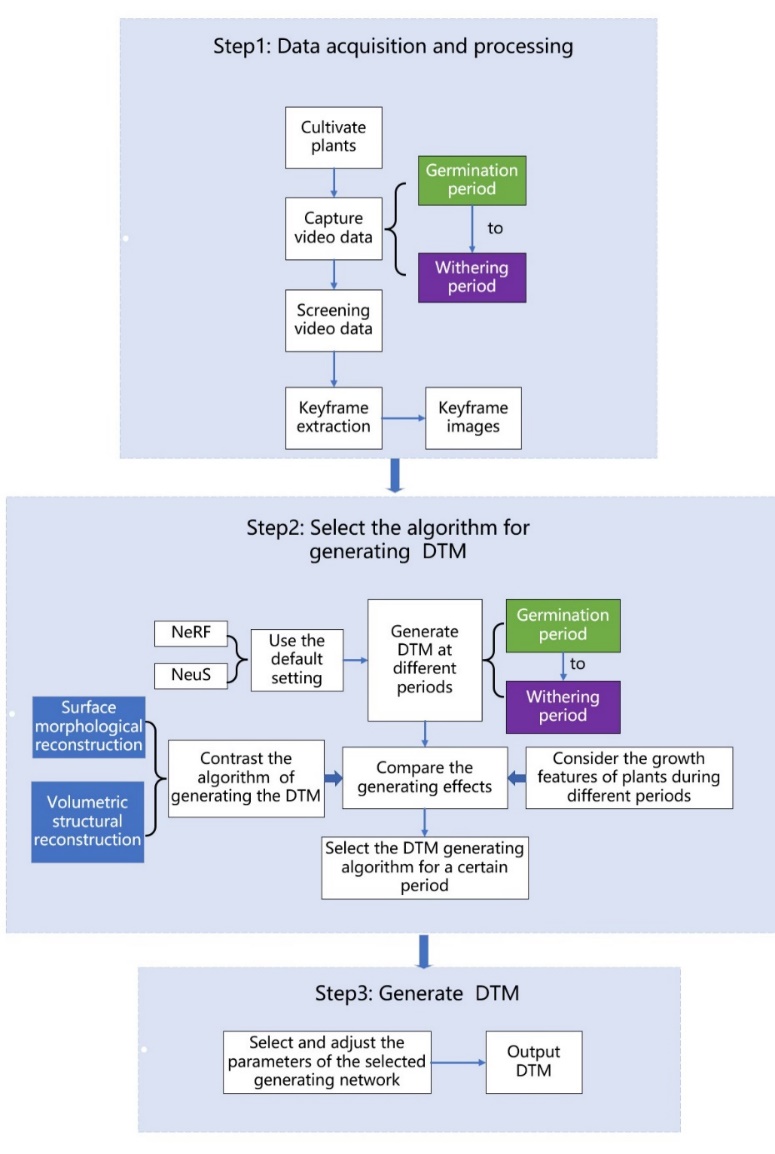
Figure 1. Flowchart of PDAG
3. Experiment
3.1. Weight Allocation
To quantitatively compare the effectiveness of generating DTM using different methods, we used evaluation formulas to calculate the results. Weight allocation should accurately assign the influence of each evaluation metric on the computational results, which is essential for the evaluation outcome. As numerous factors affect both simulation credibility and computational resource usage, a comprehensive consideration of evaluation metrics is necessary to derive reliable computational scores. We categorized all relevant influencing factors into two levels of evaluation metrics, as shown in Table 1. DTM simulation credibility, build time, Video Random Access Memory (VRAM), and ROM were considered as the primary level of evaluation indicators for assessing model construction effectiveness. Among them, the simulation credibility metric comprised Chamfer Distance (CD) [5], Earth Mover’s Distance (EMD) [6], K-Nearest Neighbor (KNN) [7], and colour as secondary evaluation indicators.
Table 1. Two-level of evaluation metrics for measuring DTM generation effect
Primary level evaluation indicators | Simulation credibility | Building time | VRAM | ROM |
Secondary evaluation indicators | CD | EMD | RGB | KNN |
3.2. Evaluation Formula
To calculate the scores for the simulation credibility and construction effect scores of PDAG, NeRF, NeuS, and MVS in generating DTM for each growth period of plants, an evaluation formula has been specified. To map the quantitative values of various evaluation metric to specified ranges and remove the magnitude of the different dimensional evaluation metrics, as shown in Equation 1, this formula normalizes the evaluation metrics:
\( {X_{nor}}=\frac{X-{X_{min}}}{{X_{max}}-{X_{min}}}\ \ \ (1) \)
Where “X” denotes the quantitative value of an evaluation indicator in a specific growth period, “Xmax” represents the maximum quantified value of a certain evaluation indicator in a given growth period, “Xmin” is the minimum quantitative value of the assessment metric during a given growth cycle, and “Xnor” signifies the normalized quantitative value of a certain evaluation indicator.
Once the normalization is complete and the inverse is taken, we calculated the simulation credibility score of the DTM using the weighted summation formula shown in Equation 2:
\( {X_{A}}=\sum _{i=1}^{4}{X_{Ai}}{ω_{Ai}}\ \ \ (2) \)
Where, \( {X_{A1}} \) , \( {X_{A2}} \) , \( {X_{A3}} \) , \( and {X_{A4}} \) are the normalized quantitative values of the four secondary evaluation indicators for simulation credibility, while \( {ω_{A1}} \) , \( {ω_{A2}} \) , \( {ω_{A3}} \) , and \( {ω_{A4}} \) denote the weight values of these indicators, respectively, and \( {X_{A}} \) represents the simulation credibility scores of DTM generated by PDAG, NeRF, NeuS, and MVS.
Similarly, the score for the effectiveness of construction is calculated using Equation 3:
\( {X_{B}}=\sum _{i=1}^{4}{X_{Bi}}{ω_{Bi}}\ \ \ (3) \)
Where, \( {X_{B1}} \) , \( {X_{B2}} \) , \( {X_{B3}},{X_{B4}} express \) the normalized quantitative values of credibility, ROM, building time, and existing factors. \( {ω_{B1}} \) , \( {ω_{B2}} \) , \( {ω_{B3}} \) , and \( {ω_{B4}} \) indicate the weight values corresponding to these indicators. \( {X_{B}} \) denotes the score of construction effectiveness for DTM generated by PDAG, NeRF, NeuS, and Multiple View Stereo (MVS) [8], respectively.
3.3. Parameter Setting Scheme of PDAG
After ensuring the model’s appropriate simulation credibility, the highest-scoring construction approach was selected, resulting in the algorithm chosen for PDAG and the corresponding training network setup scheme as shown in Table 2.
Table 2. Algorithms chosen for PDAG and the corresponding training network setup scheme
Period | Selected algorithm | Settings of the training network | ||
Germinating period | NeRF | RES = 512 | MC density threshold = 5.000 | Mesh Render mode = Vertex Colours |
Growing period | NeuS | Learning rate = 5e-4 | Batch size = 64 | Iteration times = 100000 |
Maturing period | NeuS | Learning rate = 5e-4 | Batch size = 256 | Iteration times = 100000 |
Wilting period | NeRF | RES = 600 | MC density threshold = 6.000 | Mesh Render mode = Vertex Colours |
4. Experiment result
The DTM constructed by different methods, as shown in figure 2, demonstrated varying levels of simulation credibility. Firstly, throughout the entire growth cycle, the PDAG achieved the highest simulation credibility score, which was 96.9% higher than the lowest score obtained by MVS. NeRF and NeuS have similar scores, with even the lowest scoring NeuS surpassing MVS by 64.8%. Secondly, in terms of colour presentation, the majority of the areas in the DTMs generated by PDAG, NeuS, and NeRF appear green, while most areas generated by MVS appear grey, deviating from the colour of the physical entity. Upon closer examination of the model details, although the branch reconstruction by MVS was relatively realistic compared to the physical entity, the dense point distribution in the buds and leaf parts led to poor reproduction effects.
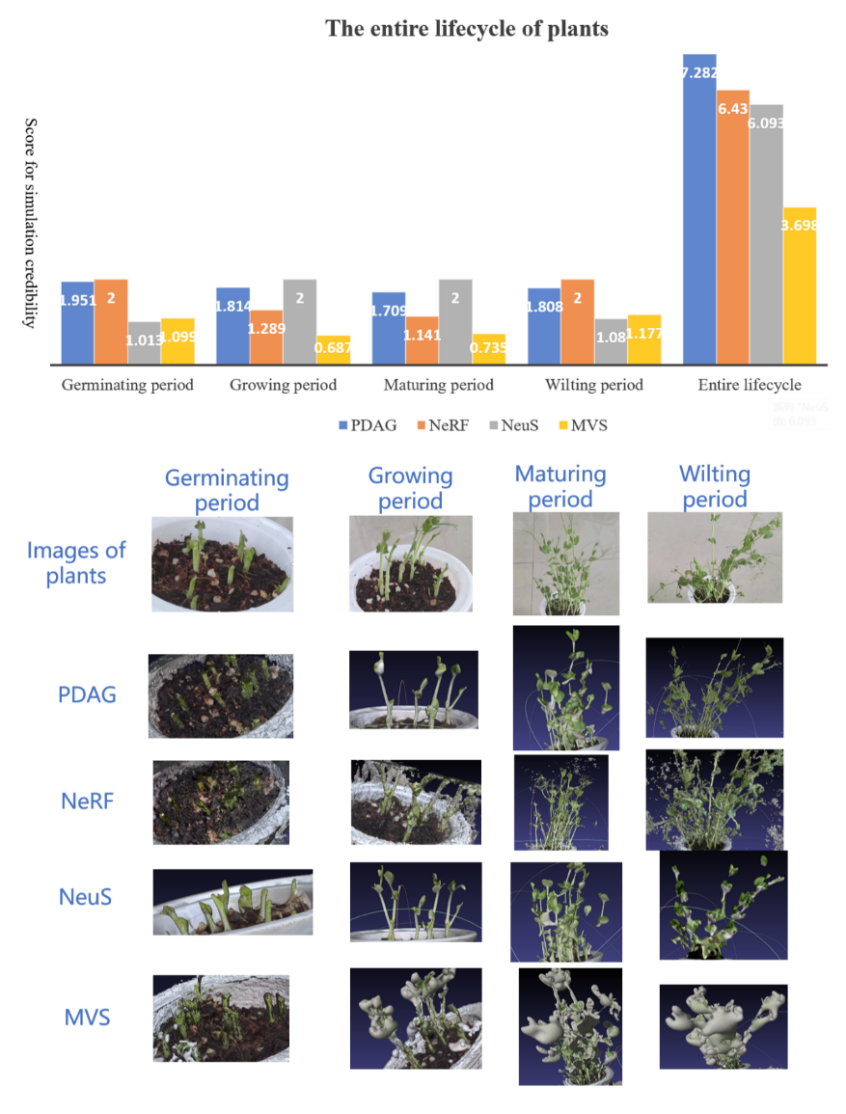
Figure 2. DTMs constructed with different generation methods
5. Conclusion
We presented a new method called PDAG for constructing digital twin models of plants. Firstly, image data of plants were captured, screened and used to develop a dataset. Then, NeuS or NeRF algorithms were selected based on the characteristics of plants at different growth periods to generate models. Finally, the parameter settings of the training network of the selected algorithms were adjusted, and the DTM of the plant at different growth periods was generated and rendered. The proposed method achieved the highest score of 1.951 in terms of the simulation credibility of the generated plant model, which was 71% higher than NeRF and 92.6% higher than NeuS. The highest score of model construction effect reached 1.778, which was 6.1% higher than NeRF and 34.3% higher than NeuS. Experimental results shown that this method can effectively reduce the computational resources consumption while ensuring a certain level of simulation credibility in the generated DTM, thereby improving the model construction effect.
In conclusion, researchers can apply PDAG in the transformation of agricultural cultivation using digital twin technology. This not only allows for the continuous visualization of plant growth in the virtual world but also reduces the enormous time and effort required for generating plant models. Consequently, this will benefit researchers in understanding the changing trends of plants throughout their entire growth cycle in a short period of time, enabling them to efficiently identify critical feature changes at key growth periods and then will implement necessary protective measures to enhance crop survival rates.
However, there are some limitations in this study. Firstly, the experiments were conducted using pea seedlings, and the differences in the construction effect of DTM for other plant species generated by PDAG have not been compared. Secondly, the simulation credibility and computational resources consumption of DTM generated by other reconstruction algorithms still require further investigation.
References
[1]. Michael W, Grieves.: Product lifecycle management: the new paradigm for enterprises[J]. Int. J. of Product Development,2022.
[2]. Berg, L.P., Vance, J.M. Industry use of virtual reality in product design and manufacturing: a survey. Virtual Reality 21, 1–17 (2017). https://doi.org/10.1007/s10055-016-0293-9.
[3]. Ben Mildenhall, Pratul P. Srinivasan, Matthew Tancik, Jonathan T. Barron, Ravi Ramamoorthi, and Ren Ng. 2021. NeRF: representing scenes as neural radiance fields for view synthesis. Commun. ACM 65, 1 (January 2022), 99–106. https://doi.org/10.1145/3503250.
[4]. M. Oechsle, S. Peng and A. Geiger, “UNISURF: Unifying Neural Implicit Surfaces and Radiance Fields for Multi-View Reconstruction,” 2021 IEEE/CVF International Conference on Computer Vision (ICCV), Montreal, QC, Canada, 2021, pp. 5569-5579, doi: 10.1109/ICCV48922.2021.00554.
[5]. J. Lu, Z. Li, J. Bai and Q. Yu, “Oriented and Directional Chamfer Distance Losses for 3D Object Reconstruction From a Single Image,” in IEEE Access, vol. 10, pp. 61631-61638, 2022, doi: 10.1109/ACCESS.2022.3179109.
[6]. Wei, L.; Zhao, L.; Peng, J. Reduced Reference Quality Assessment for Image Retargeting by Earth Mover’s Distance. Appl. Sci. 2021, 11, 9776. https://doi.org/10.3390/app11209776.
[7]. W. -L. Zhao, H. Wang and C. -W. Ngo, “Approximate k-NN Graph Construction: A Generic Online Approach,” in IEEE Transactions on Multimedia, vol. 24, pp. 1909-1921, 2022, doi: 10.1109/TMM.2021.3073811.
[8]. S. Choi, S. Kim, K. park and K. Sohn, “Learning Descriptor, Confidence, and Depth Estimation in Multi-view Stereo,” 2018 IEEE/CVF Conference on Computer Vision and Pattern Recognition Workshops (CVPRW), Salt Lake City, UT, USA, 2018, pp. 389-3896, doi: 10.1109/CVPRW.2018.00065.
Cite this article
Lin,Y.;Zhao,X.;Zhang,C. (2024). A method for generating the digital twin models of plants. Theoretical and Natural Science,34,207-212.
Data availability
The datasets used and/or analyzed during the current study will be available from the authors upon reasonable request.
Disclaimer/Publisher's Note
The statements, opinions and data contained in all publications are solely those of the individual author(s) and contributor(s) and not of EWA Publishing and/or the editor(s). EWA Publishing and/or the editor(s) disclaim responsibility for any injury to people or property resulting from any ideas, methods, instructions or products referred to in the content.
About volume
Volume title: Proceedings of the 3rd International Conference on Computing Innovation and Applied Physics
© 2024 by the author(s). Licensee EWA Publishing, Oxford, UK. This article is an open access article distributed under the terms and
conditions of the Creative Commons Attribution (CC BY) license. Authors who
publish this series agree to the following terms:
1. Authors retain copyright and grant the series right of first publication with the work simultaneously licensed under a Creative Commons
Attribution License that allows others to share the work with an acknowledgment of the work's authorship and initial publication in this
series.
2. Authors are able to enter into separate, additional contractual arrangements for the non-exclusive distribution of the series's published
version of the work (e.g., post it to an institutional repository or publish it in a book), with an acknowledgment of its initial
publication in this series.
3. Authors are permitted and encouraged to post their work online (e.g., in institutional repositories or on their website) prior to and
during the submission process, as it can lead to productive exchanges, as well as earlier and greater citation of published work (See
Open access policy for details).
References
[1]. Michael W, Grieves.: Product lifecycle management: the new paradigm for enterprises[J]. Int. J. of Product Development,2022.
[2]. Berg, L.P., Vance, J.M. Industry use of virtual reality in product design and manufacturing: a survey. Virtual Reality 21, 1–17 (2017). https://doi.org/10.1007/s10055-016-0293-9.
[3]. Ben Mildenhall, Pratul P. Srinivasan, Matthew Tancik, Jonathan T. Barron, Ravi Ramamoorthi, and Ren Ng. 2021. NeRF: representing scenes as neural radiance fields for view synthesis. Commun. ACM 65, 1 (January 2022), 99–106. https://doi.org/10.1145/3503250.
[4]. M. Oechsle, S. Peng and A. Geiger, “UNISURF: Unifying Neural Implicit Surfaces and Radiance Fields for Multi-View Reconstruction,” 2021 IEEE/CVF International Conference on Computer Vision (ICCV), Montreal, QC, Canada, 2021, pp. 5569-5579, doi: 10.1109/ICCV48922.2021.00554.
[5]. J. Lu, Z. Li, J. Bai and Q. Yu, “Oriented and Directional Chamfer Distance Losses for 3D Object Reconstruction From a Single Image,” in IEEE Access, vol. 10, pp. 61631-61638, 2022, doi: 10.1109/ACCESS.2022.3179109.
[6]. Wei, L.; Zhao, L.; Peng, J. Reduced Reference Quality Assessment for Image Retargeting by Earth Mover’s Distance. Appl. Sci. 2021, 11, 9776. https://doi.org/10.3390/app11209776.
[7]. W. -L. Zhao, H. Wang and C. -W. Ngo, “Approximate k-NN Graph Construction: A Generic Online Approach,” in IEEE Transactions on Multimedia, vol. 24, pp. 1909-1921, 2022, doi: 10.1109/TMM.2021.3073811.
[8]. S. Choi, S. Kim, K. park and K. Sohn, “Learning Descriptor, Confidence, and Depth Estimation in Multi-view Stereo,” 2018 IEEE/CVF Conference on Computer Vision and Pattern Recognition Workshops (CVPRW), Salt Lake City, UT, USA, 2018, pp. 389-3896, doi: 10.1109/CVPRW.2018.00065.