


1. Introduction
The stock market is a highly complex and volatile system. Stock prices are affected by many factors, including the company's financial condition, macroeconomic factors, market sentiment, etc. Therefore, accurately predicting stock prices has always been an important task in the field of financial analysis and investment. With the rapid development of artificial intelligence and the continuous improvement of financial derivatives, quantitative investment strategies have developed rapidly in China [1]. Scholars use machine learning and other tools to study the rise and fall of stocks and their rise and fall ranges. Wang et al. used logistic regression to predict the rise and fall trend of stocks and made a case analysis of the historical stock price trend of Guiyang Bank and achieved good results [2]. Ma et al. used random forest and XGboost algorithm to study the trend change of stocks in agriculture, forestry, animal husbandry, and fishery industries, and the results showed that the accuracy rate of the model to predict the trend of stocks in agriculture, forestry, animal husbandry, and fishery industries was as high as 91.55% [3]. Zhang et al. used the method of linear regression to predict the stock trend and designed and implemented the popular stock analysis and recommendation system based on linear regression [4].
Although the existing research methods have achieved varying degrees of success in stock price prediction, there are still many challenges. First, stock market volatility is affected by many factors, and a single historical stock price data often fails to fully capture the complexity of the market. Second, traditional forecasting models, such as linear regression, may not be able to fully capture the deep rules in the stock market when faced with non-linear relationships and high-frequency data. Thirdly, the overfitting problem of the model is still a major difficulty in stock price forecasting, especially when the training data is too complex or the sample size is insufficient, the forecasting ability of the model may decline significantly. In addition, factors such as market sentiment and unexpected events often cannot be effectively predicted through historical data, which also limits the accuracy of existing methods.
This article will use a linear regression model to forecast the historical stock price data of Samsung Electronics (005930.KS).
The goal of this study is to use a linear regression model to predict the future closing price based on historical stock price data such as the opening price, the highest price, the lowest price, etc. Through this process, this paper explores the applicability of linear regression in stock price forecasting, as well as its advantages and disadvantages.
2. Data source and preprocessing
The data set used in this study was from Samsung Electronics Stock Historical Price (005930.KS) on Kaggle. The dataset contains historical trading data for Samsung Electronics stock. As the world's leading technology enterprise, Samsung Electronics shares have attracted great attention and influence in the global market, and its stock price fluctuations are closely related to the global economy, technological innovation, and industrial development, so it has strong research value. By analyzing the stock price of Samsung Electronics, we can reveal the influence of different market factors on the stock price fluctuations, and then provide a reference for the design and optimization of the stock price prediction model.
The dataset contains daily trading data of Samsung Electronics stock from 2019 to 2024, providing rich historical information suitable for time series analysis. The data needs to be cleaned and processed before it can be analyzed. The main steps of data cleaning include:
Missing value processing: First check whether there are missing values in the data, and fill or delete them according to the situation.
Feature selection: To predict the closing price, the opening price, the highest price, the lowest price, and the trading volume are selected as the feature variables because these variables have a strong correlation with the trend of the stock.
Read the data and draw a time series diagram of the closing price as shown in Figure 1, where the horizontal coordinate represents the date and the vertical coordinate represents the closing price of the stock on that date.
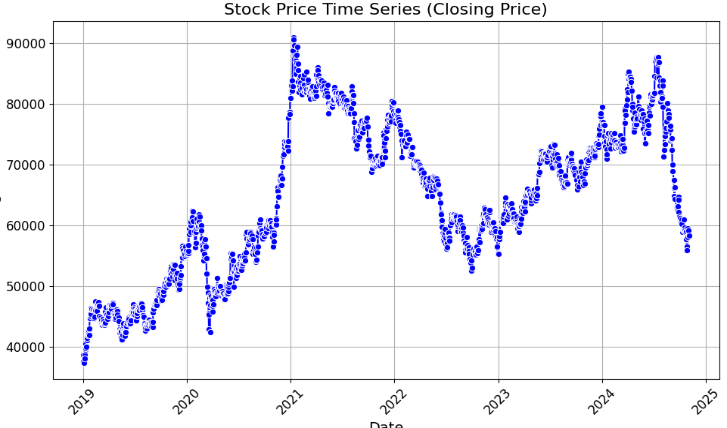
Figure 1: Timing diagram of closing prices (Photo/Picture credit: Original).
3. Model construction and training
3.1. Linear regression model
Linear regression is a basic regression analysis method, that predicts the target variable by fitting the linear relationship, establishes the linear mathematical model, and makes the evaluation prediction to deal with the linear regression relationship between the dependent variable and the independent variable [5]. Linear regression models attempt to make predictions by finding the best linear relationship between the characteristic and target variables (the closing price). In this study, the model aims to predict the closing price through characteristic variables such as the opening, high, and low price.
The mathematical expression of the model is as follows:
\( \hat{y}={β_{0}}+{β_{1}}{x_{1}}+{β_{2}}{x_{2}}+{β_{3}}{x_{3}} \) (1)
Where: \( \hat{y} \) is the predicted closing price; \( {x_{1}}, {x_{2}}, {x_{3}} \) Are the opening price, the highest price and the lowest price; \( {β_{0}}, {β_{1}},{β_{2}}, {β_{3}} \) is regression coefficient.
The regression coefficient is optimized by minimizing the loss function (mean square error). During training, the model gradually adjusts these coefficients to minimize the difference between the predicted results and the actual results.
3.2. Data segmentation
To evaluate the generalization ability of the model, the data set was randomly divided into a training set and a test set. The training set is used for the training of the model, while the test set is used to evaluate the model's predictive performance on unseen data. The ratio between the training set and the test set is 80:20%.
3.3. Training process
The regression coefficient is solved by the gradient descent method. The training process adjusts the model's parameters iteratively until the loss function converges. The regression coefficients obtained by the model are shown in Table 1, in which the first column represents the feature and the second column represents the coefficient corresponding to the feature.
Table 1: Regression coefficient
Feature | Coefficient |
Open | -0.624194 |
High | 0.749498 |
Low | 0.873528 |
Then draw a line chart comparing the actual stock price with the forecast stock price. As shown in Figure 2, the horizontal coordinate represents the number of the test data set, the vertical coordinate represents the stock price, the blue line represents the real value of the stock price, and the red line represents the predicted value given by the model. As can be seen from the figure, the two lines almost coincide, indicating a good-fitting effect.
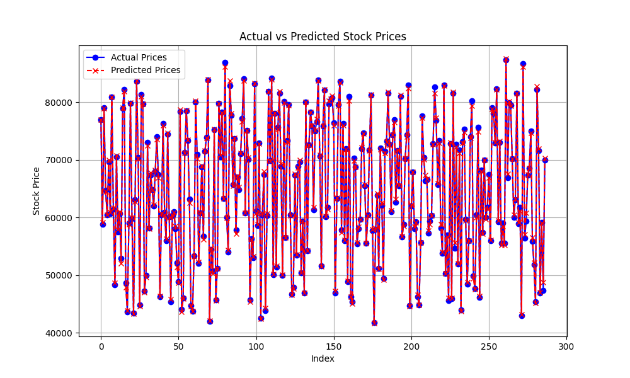
Figure 2: The actual share price compared with the forecast share price (Photo/Picture credit: Original).
3.4. Model evaluation
This paper evaluates the performance of the model by means of mean square error (MSE) and correlation coefficient () on the test set. \( {R^{2}} \) MSE is a commonly used metric for evaluating regression tasks and represents the average of the sum of squares of the difference between the predicted and actual values. A lower MSE indicates that the model is more predictive.
\( MSE=\frac{1}{n}\sum _{i=1}^{n}{({y_{i}}-\hat{{y_{i}}})^{2}} \) (2)
\( {R^{2}} \) The metric is a measure of how well the model fits the data. R2 ranges from 0 to 1, with closer to 1 indicating that the model is better able to explain the variance of the data, and closer to 0 indicating that the model is less able to explain the data [6].
\( {R^{2}}=1-\frac{\sum _{i=1}^{n}{({y_{i}}-\hat{{y_{i}}})^{2}}}{\sum _{i=1}^{n}{({y_{i}}-\bar{y})^{2}}} \) (3)
The calculation results of MSE and are shown in Table 2: \( {R^{2}} \) .
Table 2: MSE with values \( {R^{2}} \)
Metric | Value |
MAP | 119653.378577 |
\( {R^{2}} \) | 0.999159 |
3.5. Results and analysis
In this paper, a linear regression model is used to make a stock price forecast for the historical data of Samsung Electronics stock. By cleaning, standardizing and feature engineering the data, the model can predict the trend of stock price to a certain extent. The model's predictive effect is relatively good, especially on days when the stock price is not volatile, and the prediction error is small. However, on days of high volatility, the prediction error was relatively large. On the test set, the mean square error (MSE) of the model is about 119,653. This is a relatively high value for stock market data, but it is still acceptable, especially if the stock market is volatile.
This result is consistent with Poon's research, in which he compared linear and nonlinear models for stock return forecasting, and found that although linear models were able to capture the basic trend of the stock market, they had lower prediction accuracy when the stock market fluctuated sharply [7]. This is consistent with the larger error of the model in this paper when the stock market fluctuates greatly.
Tsai's research points out that stock market forecasting is often affected by big data and non-linear factors, and it is often difficult to capture the complexity of the market by relying solely on linear regression models [8]. Although linear regression models have some explanation and conciseness, they may not perform well in capturing the non-linear characteristics of the stock market. The results of this paper show that the prediction error of linear regression is larger in the case of high stock price volatility, indicating that more non-linear methods need to be combined to optimize the forecast.
Zhang proposed a hybrid model that combines linear regression with a long short-term memory network (LSTM) to improve the accuracy of stock market prediction [9]. The study shows that a single linear regression model may not be enough to capture long-term dependencies in stock market data, and deep learning models such as LSTM are able to make up for this deficiency to a large extent. Therefore, future research may consider combining linear regression with more complex machine learning or deep learning methods to improve the accuracy and stability of predictions.
Gupta's research emphasizes the feasibility of using linear regression for stock price prediction in a multi-feature environment [10]. They point out that using more features (such as technical indicators, financial data, etc.) can improve forecasting accuracy. Although the model in this paper uses basic stock price data, it can still optimize the forecasting effect by adding more market-related features.
Huang made a stock market trend prediction based on the multiple linear regression model and proved that the multiple regression model can effectively capture the basic trend of the stock market, but its effect is still limited under extreme market conditions [11]. The results of this paper are consistent with this study, indicating that the model's prediction effect is relatively poor when the market fluctuates abnormally.
Sharma's article pointed out that although machine learning methods have made significant progress in stock market prediction, linear regression is still a benchmark model, especially when the data volume is small or the features are simple [12]. Through the analysis of historical data, this paper verifies the effectiveness of the linear regression model under certain conditions, but also shows its limitations in dealing with complex stock market fluctuations.
To sum up, although the linear regression model shows some effect on stock price prediction, especially when the market is stable, the prediction error is larger when the stock market fluctuates violently. This shows that the linear regression model has certain limitations, and more complex models and more features can be combined in the future to further improve the accuracy and reliability of the forecast.
4. Conclusion
This paper uses a linear regression model to forecast the stock price of Samsung Electronics (005930.KS) based on its historical data. Through data cleaning, standardization, and feature engineering processing, a regression model based on historical trading data (such as opening price, high price, low price, etc.) is constructed. The experimental results show that the linear regression model can predict the stock price trend to a certain extent, especially when the stock market is less volatile, and the prediction error is small. However, the model shows a large prediction error when the stock market fluctuates sharply, especially in periods of sudden market events or large mood fluctuations, which shows the limitations of the linear regression model.
Through comparison with relevant literature, this paper finds that although the linear regression model has a certain application value in stock price prediction, its prediction accuracy is limited when facing nonlinear complex relations. Therefore, future studies can explore more complex models, such as deep learning models (such as LSTM, GRU, etc.), combining time series data with other auxiliary features (such as market sentiment, company financial status, etc.) to improve the accuracy of stock price prediction.
In addition, this study only used historical stock price data as a feature. In the future, multi-dimensional features such as macroeconomic indicators and industry data can be further added to optimize feature selection and further improve the forecasting ability of the model. At the same time, considering the uncertainty and external interference factors of the stock market, combining multiple forecasting methods and integrated learning may provide more robust and accurate forecasting results in a more complex market environment.
In general, although the linear regression model has some limitations in stock market forecasting, this study provides a basic framework for exploring the field of stock price forecasting and provides useful enlightenment for the design and improvement of diversified and in-depth stock market forecasting models in the future.
References
[1]. Li, X., & Xia, J. (2023). Research on stock price regression prediction based on machine learning algorithm. Science and Technology Information, 21(14), 227-231.
[2]. Wang, L., He, Y., & Jiao, D. (2023). Prediction of stock price fluctuation trend based on logistic regression model: A case study of Bank of Guiyang. China Management Information Technology, 26(4), 156-158.
[3]. Ma, G., & Tang, Y. (2023). Prediction of stock trend in the agriculture, forestry, animal husbandry, and fishery industry based on machine learning. Investment and Cooperation, (6), 47-49.
[4]. Zhang, X., & Chen, L. (2022). Design and implementation of hot stock analysis and recommendation system based on linear regression. Modern Information Technology, 6(22), 16-21.
[5]. Zhao, Y., Tang, Y., & Jiang, Z. (2023). Study on the change of human body weight step length based on linear regression method. Journal of Liaoning Police University, 25(4), 57-62.
[6]. He, X., & Duan, F. (2022). Case analysis of linear regression based on Python. Microcomputer Applications, 38(11), 35-37.
[7]. Poon, S. H., & Chan, K. C. (2008). Forecasting stock returns: A comparison of linear and non-linear models. Journal of Financial and Quantitative Analysis, 43(3), 673-698.
[8]. Tsai, C. F., & Chen, M. Y. (2015). A survey of stock market prediction with big data. Proceedings of the 10th International Conference on Machine Learning and Computing, 125-130.
[9]. Zhang, Y., & Zhou, W. (2017). Stock market prediction using linear regression and LSTM: A hybrid model. Proceedings of the 2017 International Conference on Computational Intelligence and Applications, 85-92.
[10]. Gupta, A., & Gupta, V. (2020). Stock price prediction using linear regression model with multiple features. International Journal of Computer Applications, 175(4), 23-29.
[11]. Huang, S., & Chen, M. (2016). Predicting stock market trends using multiple linear regression models. Expert Systems with Applications, 46, 50-58.
Cite this article
Zhao,Y. (2025). Stock Price Prediction Based on Linear Regression. Theoretical and Natural Science,84,85-90.
Data availability
The datasets used and/or analyzed during the current study will be available from the authors upon reasonable request.
Disclaimer/Publisher's Note
The statements, opinions and data contained in all publications are solely those of the individual author(s) and contributor(s) and not of EWA Publishing and/or the editor(s). EWA Publishing and/or the editor(s) disclaim responsibility for any injury to people or property resulting from any ideas, methods, instructions or products referred to in the content.
About volume
Volume title: Proceedings of the 4th International Conference on Computing Innovation and Applied Physics
© 2024 by the author(s). Licensee EWA Publishing, Oxford, UK. This article is an open access article distributed under the terms and
conditions of the Creative Commons Attribution (CC BY) license. Authors who
publish this series agree to the following terms:
1. Authors retain copyright and grant the series right of first publication with the work simultaneously licensed under a Creative Commons
Attribution License that allows others to share the work with an acknowledgment of the work's authorship and initial publication in this
series.
2. Authors are able to enter into separate, additional contractual arrangements for the non-exclusive distribution of the series's published
version of the work (e.g., post it to an institutional repository or publish it in a book), with an acknowledgment of its initial
publication in this series.
3. Authors are permitted and encouraged to post their work online (e.g., in institutional repositories or on their website) prior to and
during the submission process, as it can lead to productive exchanges, as well as earlier and greater citation of published work (See
Open access policy for details).
References
[1]. Li, X., & Xia, J. (2023). Research on stock price regression prediction based on machine learning algorithm. Science and Technology Information, 21(14), 227-231.
[2]. Wang, L., He, Y., & Jiao, D. (2023). Prediction of stock price fluctuation trend based on logistic regression model: A case study of Bank of Guiyang. China Management Information Technology, 26(4), 156-158.
[3]. Ma, G., & Tang, Y. (2023). Prediction of stock trend in the agriculture, forestry, animal husbandry, and fishery industry based on machine learning. Investment and Cooperation, (6), 47-49.
[4]. Zhang, X., & Chen, L. (2022). Design and implementation of hot stock analysis and recommendation system based on linear regression. Modern Information Technology, 6(22), 16-21.
[5]. Zhao, Y., Tang, Y., & Jiang, Z. (2023). Study on the change of human body weight step length based on linear regression method. Journal of Liaoning Police University, 25(4), 57-62.
[6]. He, X., & Duan, F. (2022). Case analysis of linear regression based on Python. Microcomputer Applications, 38(11), 35-37.
[7]. Poon, S. H., & Chan, K. C. (2008). Forecasting stock returns: A comparison of linear and non-linear models. Journal of Financial and Quantitative Analysis, 43(3), 673-698.
[8]. Tsai, C. F., & Chen, M. Y. (2015). A survey of stock market prediction with big data. Proceedings of the 10th International Conference on Machine Learning and Computing, 125-130.
[9]. Zhang, Y., & Zhou, W. (2017). Stock market prediction using linear regression and LSTM: A hybrid model. Proceedings of the 2017 International Conference on Computational Intelligence and Applications, 85-92.
[10]. Gupta, A., & Gupta, V. (2020). Stock price prediction using linear regression model with multiple features. International Journal of Computer Applications, 175(4), 23-29.
[11]. Huang, S., & Chen, M. (2016). Predicting stock market trends using multiple linear regression models. Expert Systems with Applications, 46, 50-58.