


1. Introduction
Weather-forecasting has been a main goal and pursuit of human society after the emerging boost of technologies. Weather forecasting technology is of great significance to the development of human civilization. From the agricultural perspective, the ability to foretell weather information provides chances for farmers to avoid potential damage to the crops and reasonably plan their farming calendar. In disaster management, extreme weather such as typhoons and heatwaves can cause tremendous losses of economics and human lives. According to CBS News [1], 480,000 people were killed by extreme weather in the last 20 years globally. With the recently proposed idea of “Sustainable Development Goals”[2] (SDGs), the UN agreed that climate action is the greatest opportunity to drive the world forward towards these goals in the 21st century. Therefore, investigating weather-forecasting skills would be important to achieve a better measurement and understanding of climate, so as to provide a guiding role for future climate solvencies.
In modern societies, the Atmospheric model high-resolution (HRES) is generally considered to be the most precise NWP (Numerical Weather Prediction)-based weather model in the world. In recent years, with the integration of artificial intelligence and other techniques, people started to rapidly approach precise weather forecasting and predictions of future environmental status. Especially, large-scale foundation models in weather and atmosphere [3] are now being developed based on multiple decades of real-world weather observation and analysis data, which excels the previous small-scale deep learning models and traditional methods by a large-margin. A few large-scale models have now even achieved better forecasting results than the traditional NWP [4]. GraphCast is so far one of the leading weather-forecasting algorithms among the existing deep learning benchmarks, which uses machine learning and graph neural networks (GNN) over a uniform mesh around the Earth's surface to process historical weather data in order to make quick predictions. GraphCast has hundreds of millions of parameters in its model. Research by Remi Lam and his team had suggested [5] that GraphCast has equivalent or better performance than HRES across all categories. Essentially, it’s undoubtful to say that GraphCast was recognized as the world’s most accurate 10-day global weather forecasting system, continues Silvia Conti [6].
However, in the history of the development of weather forecasting, there is a uniform question in the face of all algorithms, that is, how are they going to predict extreme weather? As common sense for people, extreme weather always comes immediately and barely follows any trackable logic. They are generally more devastating and terrifying than general climate shifts or changes in weather. When dealing with natural disasters, the model’s ability to accurately capture and predict extreme weather is far more important than obtaining a good performance on average for spacetime across the globe. Yet, the ability to predict extreme weather would still be a great challenge for machine-learning algorithms, since the AI models, such as GraphCast, are not trained to specifically tackle extreme weather.
GraphCast uses data from the ECMWF (European Centre for Medium-Range Weather Forecasts), and to enhance the ability of the algorithm, the code for GraphCast as well as the data are all open-sourced. This allows the general public to gain access and investigate, or even test and modify it to solve issues coping with various datasets and real-life situations. Our motivation in this paper is threefold: 1) first, identify the regions and weather variables that GraphCast failed to predict well, and verify whether they align with the extreme weather conditions; 2) second, modify the model architecture to better cope with the extreme weather forecasting task; 3) last, fine-tune the modified GraphCast model on extreme weather data so that the model will be upgraded to a version that could tackle extreme weathers much better.
Through experiments, we find that GraphCast has significant errors in predicting the temperature for the African continent and the mean sea-level pressure for African, Arabic, and Tibetan areas on the earth. We are motivated by these extreme weather cases to investigate solutions to make AI models more accurate across different regions. Specifically, we analyze the drawback of the optimization of GraphCast: it is driven by the MLE objective to minimize the mean error across the data, while the extreme weather in certain regions may be harder to predict than the normal weather in other regions due to scarcity in the database. Some previous works such as [7] have proposed to adjust training loss to pay more attention to extreme weather cases in history, however, these works cannot capture the inherent uncertainty in the atmosphere. There are no guarantees that the very few extreme weather cases in the historical data are representative to reflect all possible extreme cases in the future. For example, identical initial conditions may lead to different outcomes and certain extreme cases only appear with very low probabilities. Ideally, we can benefit better from a model with uncertainty estimation modules.
Luckily, there are abundant statistical methods that could approximately tell us which of the data samples are harder to learn for the AI model. Bayesian learning that can specify the uncertainty in prediction is one of the methods, which can estimate the variance of prediction by Monte Carlo Dropout on the GraphCast model. We hypothesize that the more uncertain a model is about a certain region, the more likely it has a higher prediction error. Following this paradigm, we first perform an uncertainty estimation and calculate the weights for different data samples, and then fine-tune the GraphCast model dynamically according to the weights.
In experiments, we find that the uncertainty aligns well with the prediction error, and the forecasts after fine-tuning the GraphCast model have a more even error distribution, instead of performing especially badly in extreme weather as in the case of the African continent. Moreover, in the literature, people still do not know whether fine-tuning a weather foundation model could improve the performance in specific areas. We find that, after fine-tuning, the overall error is also going down, which well demonstrates the effectiveness of fine-tuning. To make it easier for future followers, we build a pipeline that incorporates every step needed for fine-tuning a GraphCast, from the data downloading API to model training and evaluation.
2. Related Works
In the realm of meteorological prediction, the advancement of data-driven models has significantly enhanced forecasting capabilities, particularly when trained on comprehensive datasets like ERA5 provided by the European Centre for Medium-Range Weather Forecasts (ECMWF). Traditional forecasting techniques have been bolstered by physics-based models such as ECMWF’s Integrated Forecast System (IFS), which offers both high-resolution deterministic forecasts and probabilistic ensemble forecasts (IFS ENS). Complementary to these classical approaches, machine learning (ML) methodologies have emerged as a strong force in meteorology recently. Models such as Pangu-Weather [8] by Huawei and GraphCast by Google DeepMind utilize machine learning to generate deterministic forecasts, operating at resolutions ranging from 0.25° to 1°. Independently developed by Ryan Keisler [9], another ML-based model also contributes to the forecasting ecosystem. FuXi [10], a creation of Fudan University, and SphericalCNN by Google Research [11] further diversify the ML landscape, each offering unique insights into predictive analytics.
Innovations in model design have led to the development of hybrid systems that integrate physical laws with machine learning algorithms, exemplified by the NeuralGCM series from Google Research [12]. These models aim to improve forecast accuracy by leveraging the strengths of both physics-based understanding and data-driven prediction techniques. Integration of machine learning (ML) models into the domain of extreme weather prediction has opened new avenues for improving forecast accuracy, yet it remains a field with significant uncharted territory. Existing methodologies often focus on regional predictions or are constrained by low-resolution outputs, thereby limiting their applicability to global-scale, high-resolution forecasting.
Zhao et al. pioneered an approach using wavelet transform, a technique that enables the analysis of varying-frequency information within time series data, to anticipate extreme weather events [13]. However, this method only predicts the likelihood of occurrence without providing precise values. Porto et al. advanced this work by integrating multiple models to better understand and predict diverse patterns of extreme weather, albeit at a higher computational cost [14]. In contrast, Annau et al. focused on enhancing the representation of high-frequency components in the data through convolutional operations, aiming to improve the prediction of extreme values [15]. Despite these advancements, challenges persist in effectively highlighting the extreme weather events in the model training stage.
Bias correction techniques have also been explored to refine predictions of extreme weather phenomena. Morozov et al. applied quantile regression to adjust for biases in extreme value predictions, although this approach is limited by its reliance on a fixed number of quantiles, which might not fully represent the underlying data distribution [16]. Additionally, some studies have experimented with modifying loss functions to emphasize the learning of extreme values. For instance, Lopez-Gomez et al. introduced an exponential-based loss function to increase the weight of extreme values during training [17]. This strategy, however, can lead to numerical instability in practice (Wang et al.) [18]. Ni suggested leveraging Generative Adversarial Network (GAN) loss to enhance model performance in predicting extremes [19], but noted optimization challenges associated with GANs (Berard et al.) [20]. Currently, there lacks a method that is both stable and low-cost to correct data biases and emphasize the extreme weathers in the model optimization. This motivates us to innovate and propose new methods to address the issues unsolved yet by the previous works.
3. Methods
3.1. GraphCast modeling
GraphCast is a global weather forecasting algorithm that takes in two most recent states of Earth’s weather—the current time and six hours earlier—and predicts the next state of the weather six hours ahead. It is an autoregressive model in that its own prediction can be used as input to predict future steps in a rollout way. To predict the next state, GraphCast first employs an encoder that maps weather states in an area into a latent space. Then, it uses a processor to aggregate the latent information from adjacent regions with message-passing neural networks on multiple meshes. Afterward, a decoder uses the adjacent latent space to predict the next weather state. The figure from GraphCast [5] illustrates the modeling.
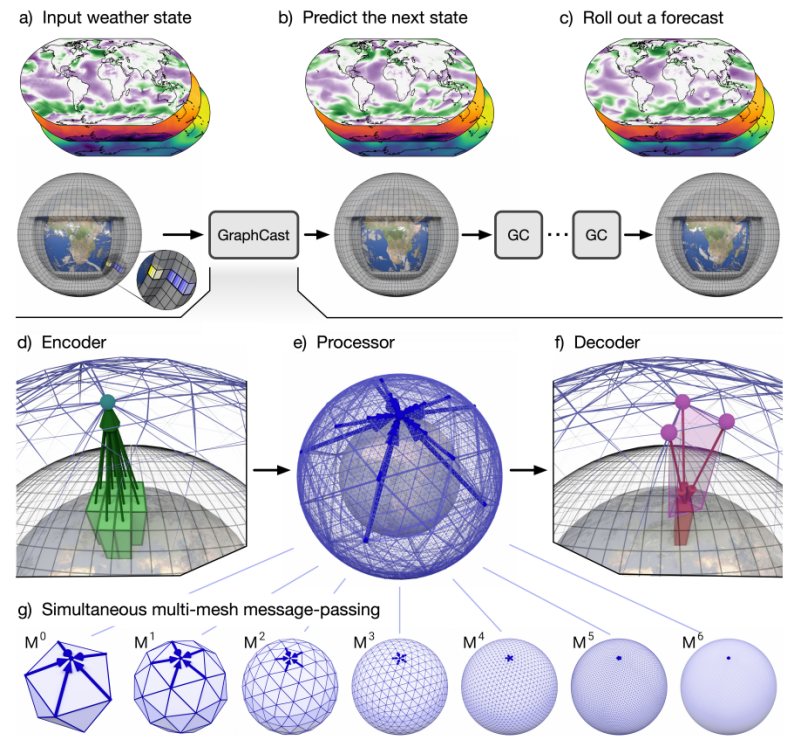
Figure 1: The diagram of GraphCast [5] that illustrates its modeling process.
3.2. Theoretical analysis of the weakness of GraphCast
The optimization of GraphCast is based on the Mean Square Error (MSE) loss function, which originates from the Maximum Likelihood Estimation (MLE) principle.
\( {L_{MSE}}(θ)=\frac{1}{N}\sum _{i=1}^{N}\sum _{j=1}^{m}\sum _{k=1}^{h}{({\hat{y}_{i,j,k}}-{\hat{y}_{i,j,k}}(θ))^{2}} \)
where N is the number of samples (data points), m is the number of spatial grids, h is the number of weather variables, \( {y_{i,j,k}} \) is the true value for the k-th weather variable at the j-th spatial grid for the i-th sample, and \( {\hat{y}_{i,j,k}} \) is the predicted value from the model.
In statistical inference, the likelihood function measures the fitness of a statistical model to data samples (X, Y) of the model parameters θ. Here, X denotes historical weather variables, Y denotes future weather variables. The estimation function \( L(θ|X,Y) \) is used to choose the value of θ that maximizes the probability of observing (X, Y), which is expressed as follows:
\( L(θ|X,Y)=f(X,Y|θ)=\prod _{i=1}{p_{model}}({y_{i}}|{x_{i}};θ) \)
Hereby, by maximizing the likelihood function, we obtain
\( \begin{matrix}{θ^{MLE}} & =arg {max_{θ}}\prod _{i=1}^{n}{p_{model}}({y_{i}}|{x_{i}};θ) \\ & =arg {max_{θ}}log{\prod _{i=1}^{n}{p_{model}}({y_{i}}|{x_{i}};θ)} \\ & =arg {max_{θ}}\sum _{i=1}^{n}log{{p_{model}}({y_{i}}|{x_{i}};θ)} \\ \end{matrix} \)
Assuming that the target label is \( {y_{i}}∈{R^{n×m×h}} \) , where \( n×m \) is the spatial grids around the globe, \( h \) is the number of weather variables. It obeys the Gaussian distribution \( N({ω^{⊤}}{x_{i }}, {σ^{2 }}) \) , we set the optimization goal to maximize the probabilistic density, which is equivalent to maximizing the sum of log-likelihood
\( \begin{matrix}{θ^{MLE}} & =arg {max_{θ}}\sum _{i=1}^{n}log{(\frac{1}{σ\sqrt[]{2π}}{e^{-\frac{{({y_{i}}-{\hat{y}_{l}})^{2}}}{2{σ^{2}}}}})} \\ & =arg {max_{θ}}\sum _{i=1}^{n}(-\frac{{({y_{i}}-{\hat{y}_{l}})^{2}}}{2{σ^{2}}}-log{(σ\sqrt[]{2π})}) \\ & =arg {min_{θ}}\sum _{i=1}^{n}\frac{{({y_{i}}-{\hat{y}_{l}})^{2}}}{2{σ^{2}}} \\ & =arg {min_{θ}}\sum _{i=1}^{n}{({y_{i}}-{\hat{y}_{l}})^{2}}, if σ is fixed. \\ \end{matrix} \)
According to the MLE, GraphCast optimizes via the overall MSE loss, which is a sum of all the prediction times of all the variables across the globe. Each data point is treated equally. Thus, the model cannot distinguish between normal weather data, which is easier to learn, and extreme weather data which could be harder to learn, due to the scarcity of the data.
3.3. Our improved modeling upon GraphCast
To address the drawback in GraphCast optimization and improve the modeling of extreme weather, we first propose an uncertainty estimation module with ensemble methods, which uses Monte Carlo Dropout, a Bayesian approach, to estimate the predictive uncertainty of the model. The schematic diagram for this method is visualized in Figure 2. By running multiple forward passes through the model with different dropout masks in the ensemble, we can obtain a distribution of predictions for each data point. With this, we then up-weight the loss associated with high-uncertainty predictions, forcing the model to pay more attention to data points that are hard to learn. We hypothesize that these predictions with high uncertainty are more likely related to extreme weather events, according to our empirical data visualization and analysis results. The overall model framework is shown in Figure 3.
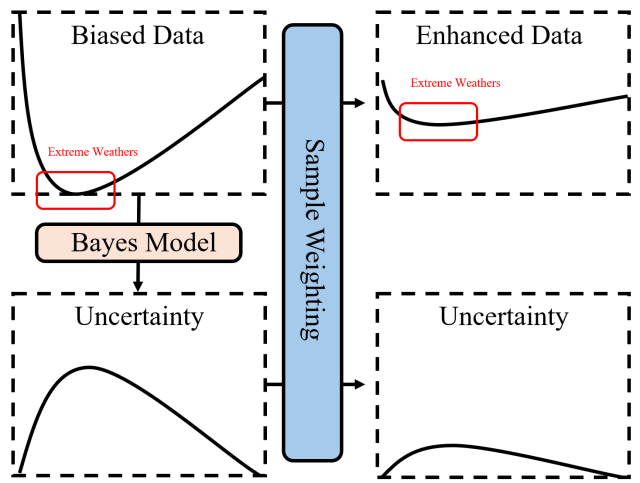
Figure 2: The schematic diagram for our algorithm. Extreme weathers represent rare cases in the global weather database, therefore, it forms a biased dataset for the training of machine learning models. In our method, we use Bayes method to estimate the uncertainty of each data sample, and use that to generate a sampling weight for it. After sample weighting, the rare cases will be enhanced and the uncertainty of data samples will be more even. This strategy helps improve the performance of foundational machine learning models on extreme weathers.
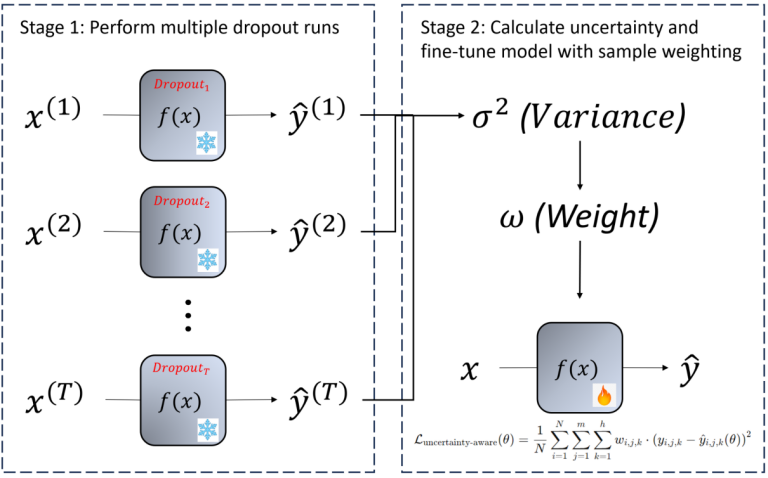
Figure 3: The workflow for our model. First, we perform multiple runs under different random dropout of the last layer of the original weather prediction model \( f() \) . We use the same model for all the runs, and we freeze all the model parameters at the first stage, which ensures that our method does not require additional training efforts and excessive computational resources other than the fine-tuning. Then, after calculating the sample weights for data samples, we use the weighted loss function to optimize the model. At this stage, the model is finally being fine-tuned, which costs most of the computational resources. In general, our carefully designed framework is very efficient and easy to deploy.
With Monte Carlo Dropout enabled, we perform multiple stochastic forward passes through the model, yielding a set of predictions \( \lbrace {\hat{y}_{i,j,k}}(1), ..., {\hat{y}_{i,j,k}}(T)\rbrace \) , where T is the number of stochastic passes, i and j denote the latitude and longitude of the data sample, k denotes the index of the variable list to predict. Each prediction \( {\hat{y}_{i,j,k}}=f({x_{i,j,k}}) \) , where \( f() \) is the large-scale weather prediction model that processes the historical weather events \( {x_{i,j,k}} \) to predict future events \( {\hat{y}_{i,j,k}} \) . The mean prediction can be calculated as follows:
\( {\hat{y}_{i,j,k}}=\frac{1}{T}\sum _{t=1}^{T}\hat{y}_{i,j,k}^{(t)} \)
The predictive variance can be calculated as follows:
\( σ_{i,j,k}^{2}=\frac{1}{T}\sum _{t=1}^{T}{(\hat{y}_{i,j,k}^{(t)}-{\bar{y}_{i,j,k}})^{2}} \)
We modify the MSE loss to include an uncertainty-aware weighting. The intuition is to upweight the loss for cases with higher uncertainty, making the model pay more attention to these difficult-to-predict extreme cases. The modified loss function can be written as:
\( {L_{uncertainty-aware}}(θ)=\frac{1}{N}\sum _{i=1}^{N}\sum _{j=1}^{m}\sum _{k=1}^{h}{{w_{i,j,k}}∙({y_{i,j,k}}-{\hat{y}_{i,j,k}}(θ))^{2}} \)
where \( {ω_{i,j,k}} \) is the uncertainty-based weighting factor for each prediction, calculated as
\( {w_{i,j,k}}=1+λ∙σ_{i,j,k}^{2} \)
where \( λ \) is a hyperparameter that controls the influence of the uncertainty on the loss function. In this paper, we simply set \( λ=1 \) , as a proof of concept to implement our idea.
In addition, given the computational demands of training a large-scale model like GraphCast, especially when incorporating additional modules such as uncertainty estimation, it is crucial to optimize the training process for feasibility and efficiency. To achieve this, we implement a technique called fine-tuning. We directly take the pre-trained GraphCast and further train the model using the ERA5 data in the year 2023 with the proposed uncertainty estimation module. This step ensures that the model becomes adept at handling rare events, which are underrepresented in the pre-training dataset. To improve efficiency, we propose to freeze most layers of the pre-trained model during fine-tuning and update only the decoder. The rationale behind it is that the encoder has been pre-trained by Google well to represent the weather data, while the decoder is task-specific and is relevant for generating predictions. This strategy of fine-tuning is also commonly used in other large-scale models, such as large language models [21], where tuning the decoder or the final few layers is standard practice.
4. Experiments
The experiments are designed for verifying the effectiveness of our proposed method. The experiment mainly consists of two parts, i.e., the development of a large model fine-tuning framework and the evaluation as well as comparison of model performance. We will build a pipeline to finetune GraphCast and compare the original GraphCast with our proposed model.
4.1. Data Preparation
At first, denoted that according previously to Lam’s research [5], datasets from GraphCast were “from a subset of ECMWF’s ERA5 archive, which is a large corpus of data that represents the global weather from 1959 to 2017, at 0.25° latitude/longitude resolution, and 1-hour increments.” Within the experiment, in order to make a fair comparison to the original GraphCast model, we will use the same ERA5 archive as the training dataset, but we use the first days of all the 12 months data in 2023 as the test dataset.
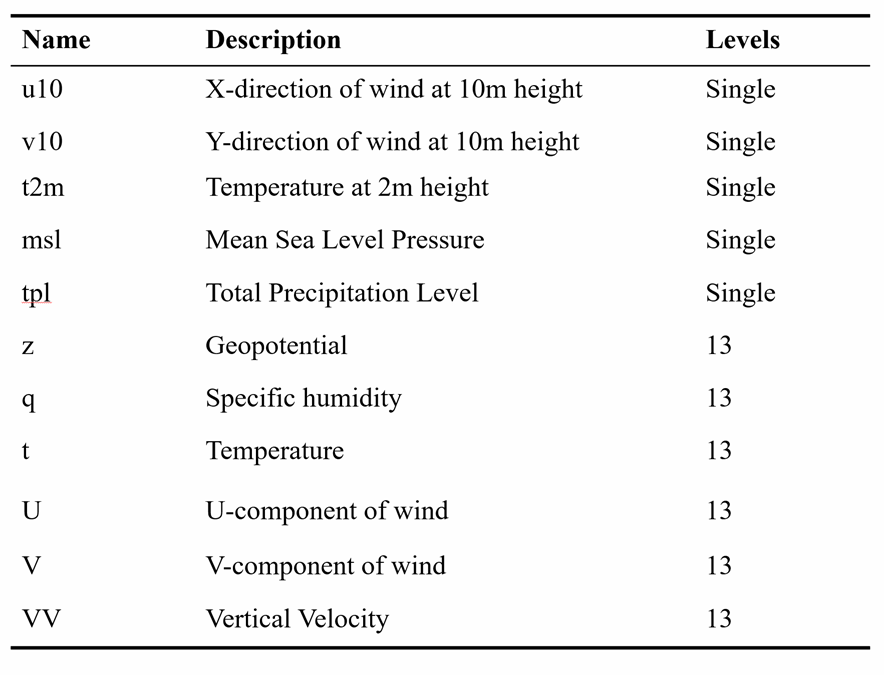
Figure 4: The different data variables used in the ERA5 database for training GraphCast.
GraphCast contains 14 different data variables as listed in Figure 4, such as temperature, wind, and humidity. GraphCast uses an autoregressive training strategy, which continues to take the predicted weather as ground truth input to further predict data of the next time event. This optimization objective for GraphCast is to minimize the errors between the predicted state and the actual state, using Mean Square Error (MSE).
4.2. Fine-tuning framework
In the literature, there has been no tool or research that implements the fine-tuning of a large weather model like GraphCast. To fine-tune GraphCast, we build an experimental pipeline to fine-tune GraphCast based on our method. The schematic diagram is shown in Figure 5 below. With the whole process being pipelined, we provide a clear process for future users. For example, future users can focus on the extreme weather in certain regions, seasons, or weather variables, etc. The improved modeling will then apply to the selected attention of the extreme weather pattern of interest. Since the ERA5 data could be in the GRIB format and does not fit the training of GraphCast directly, we also provide a comprehensive codebase to convert GRIB into the readable format for GraphCast and then adapt to the ‘xarray’ format for fine-tuning GraphCast.
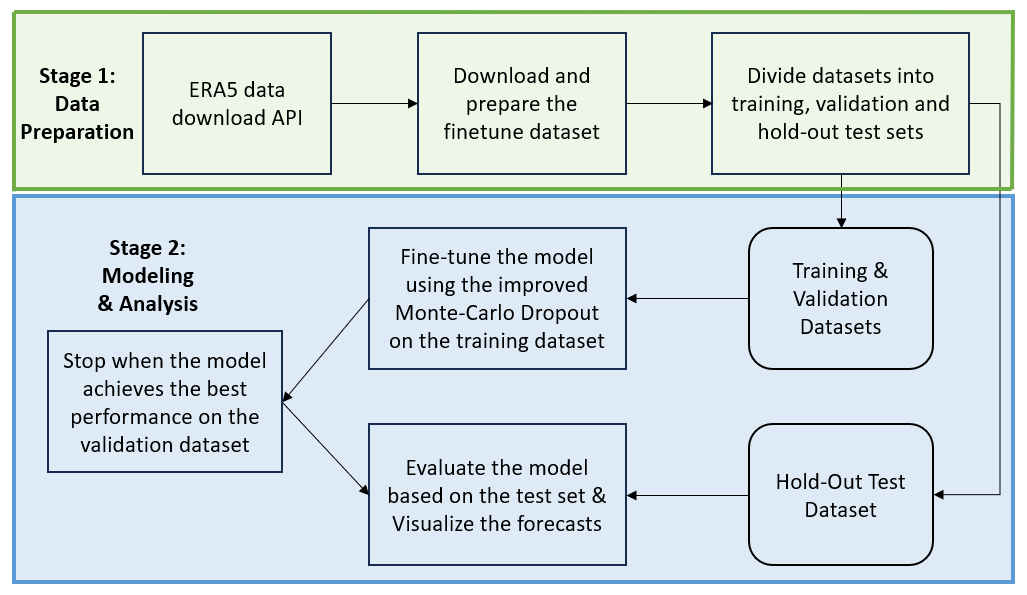
Figure 5: The fine-tuning pipeline of this paper. First, we download data from ERA5 and fine-tune the improved GraphCast model using the training dataset. Then, we evaluate the model based on the test dataset.
4.3. Data Analysis and Anomaly Discovery
We use a remote server with sufficient GPU resources and memories to store the datasets and perform the calculation. To know how well extreme weathers are predicted in GraphCast, we randomly select and visualize a few cases where the predictions of temperature and mean sea-level pressure in certain areas at a given time are significantly inaccurate. As shown in Figure 6, the model prediction errors in temperature are high in the African continent, where the true (target) temperature is extremely high, but GraphCast predicts a lower temperature. Similarly, in Figure 7, the true (target) mean sea-level pressure in Tibet is extremely high, but GraphCast predicts an even higher pressure, which makes the prediction highly inaccurate. Moreover, the predictions in the East African, Arabic, and Tibetan areas are inaccurate, and these areas are known to have extreme height and/or temperatures. These two cases lead us to a further investigation of whether GraphCast can handle a precise prediction of areas with extreme weathers.
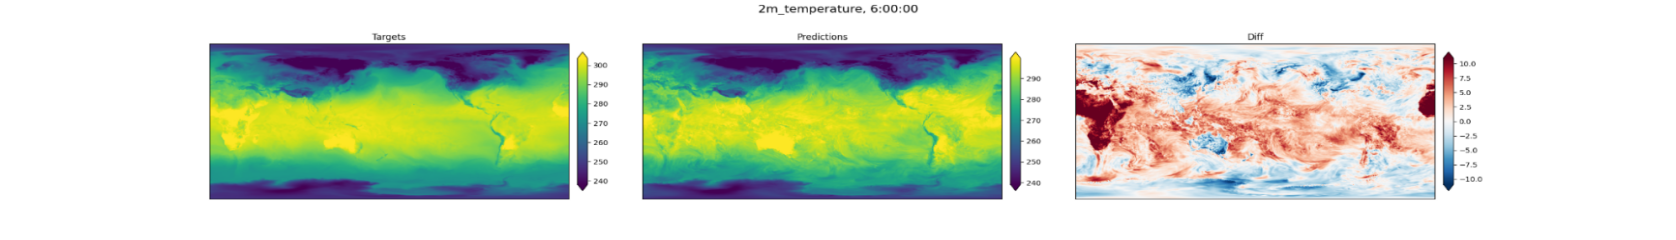
Figure 6: The left subfigure shows the actual temperature distribution in the world at a given time point. The middle subfigure shows the predicted temperature distribution. In both figures, a lighter color denotes a higher temperature. The right subfigure shows the differences between the actual and predicted temperature, where the red color denotes the underestimation of the actual temperature while the blue color denotes the overestimation.
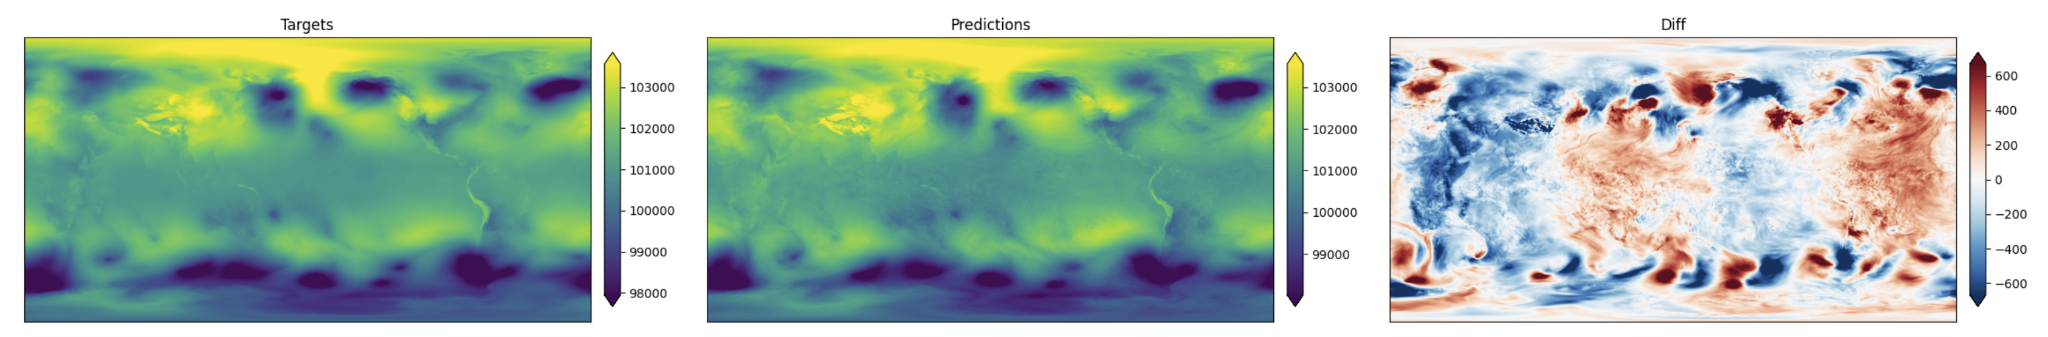
Figure 7: The left subfigure shows the actual mean sea-level pressure distribution in the world at a given time point. The middle subfigure shows the predicted pressure. In both figures, In both figures, a lighter color denotes a higher pressure. The right subfigure shows the differences between the actual and predicted pressure, where the red color denotes the underestimation of the actual pressure while the blue color denotes the overestimation.
We use the student T-test to identify time and location in the dataset where GraphCast has the statistically significant prediction errors. These represent the cases where the current model is not doing well enough. We calculate the absolute error between predicted and actual values of temperature, and then we compute the standard deviation, which is 2.698. Regions, where the error exceeds the significant threshold (more than 2 standard deviations above the mean, which is ±5.396), would be flagged as having statistically significant errors. It is clear that GraphCast is specifically performing less satisfactory on the African continent, in terms of 2m temperature forecasting at 500 pressure level. GraphCast has an error that is way above +5.396 here, as shown in Figure 6. This anomaly occurs in the GraphCast model using the setting of single-step prediction with mesh size 4, GNN message passing size 4, and latent size 32.
4.4. Results and Discussion
To demonstrate that our improved uncertainty modeling upon GraphCast can mitigate the model predictions with extreme weather, especially, the anomalies of the weather prediction on the African continent, we fine-tune the GraphCast model with the setting of single-step prediction with mesh size 4, GNN message passing size 4, and latent size 32.
The goal of fine-tuning in this paper is achieved by first calculating the statistical uncertainty of different spatial regions and then weighing different samples based on uncertainty factors, focusing on regions with high prediction uncertainty for the 2m temperature weather variable. First, we find in Figure 8 that the sample weights are larger in the African continent than in the other places. The sample weights in different regions represent the degree of uncertainty of the GraphCast model calculated by our Monte Carlo modeling. Note that the Monte Carlo estimation of sample weights is dynamically updated per epoch throughout the fine-tuning. Thus, our calculation of sample weights happens before the next round of training. The result shows that the modeling with uncertainty can be a good indicator of where the errors could be high for the GraphCast model before actually training the GraphCast model.
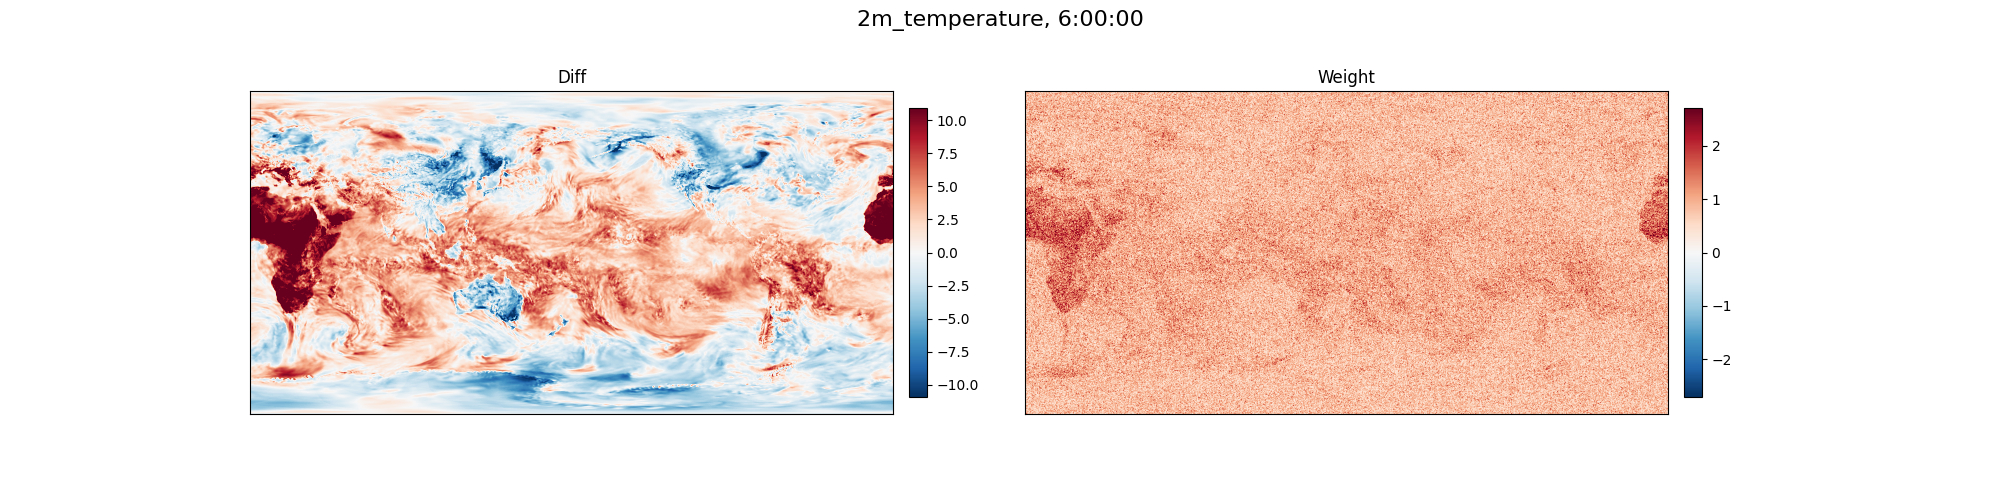
Figure 8: The left subfigure shows the differences between the actual and predicted temperature by the original GraphCast model. The right subfigure shows the sample weight calculated by our uncertainty-based Monte Carlo dropout modeling. We find that the weight highly aligns with the high errors in the African continent.
We are even more pleased to find that after the fine-tuning, the GraphCast model seems well positioned and does not have a biased prediction error on the African continent anymore. As Figure 9 shows, after fine-tuning, the error magnitude decreases and the errors are distributed more evenly across different regions on Earth. It shows that our improved modeling mitigates the errors in extreme weather areas successfully.

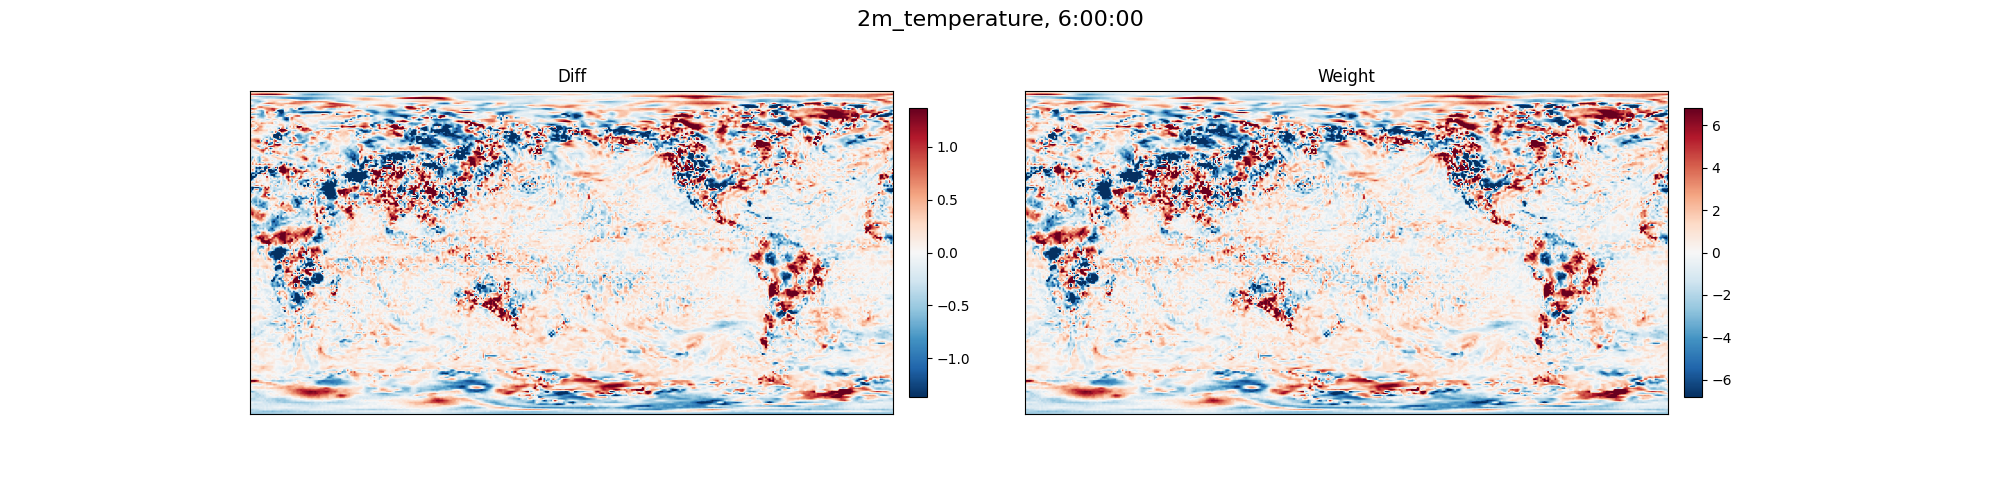
Figure 9: The left subfigure shows the differences between the actual and predicted temperature by the original GraphCast model. The right subfigure shows the effect of differences by the improved GraphCast model with an additional 30 epochs of fine-tuning under uncertainty with the ERA5 data in 2023. The improved modeling clearly removes the anomaly in the African continent, making the prediction more even and fair across areas.
We are even more pleased to find that after the fine-tuning, the GraphCast model seems well positioned and does not have a biased prediction error on the African continent anymore. As both Figure 9 and Figure 10 show, after fine-tuning the original GraphCast model using our framework, the error magnitude decreases and the errors are distributed more evenly across different regions on Earth. These findings demonstrate that our improved modeling mitigates the errors in extreme weather areas successfully.

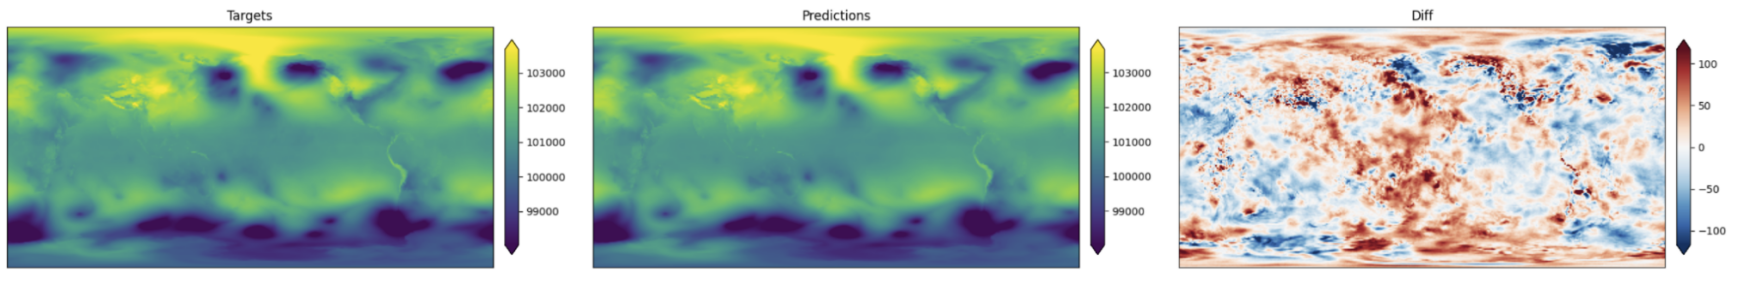
Figure 10: The left subfigure shows the differences between the actual and predicted mean sea-level pressure by the original GraphCast model. The right subfigure shows the effect of differences by the improved GraphCast model with an additional 30 epochs of fine-tuning under uncertainty with the ERA5 data in 2023. The improved modeling clearly makes the prediction more even and fair across areas, without high errors in certain areas.
5. Limitations and Future Works
Throughout the experiment, there are still a few non-negligible limitations on fine-tuning. In the methodology, despite Monte Carlo dropout being a sufficient way to complete fine-tuning, one main restraint is still on the computational resources. An overall fine-tuning of data requires a heavy workload for the computer, therefore it’s difficult to directly fine-tune with an overly large dataset. As a result, there is also a limitation on the amount of data that we can use, which may potentially restrain the scope of our results. In comparison, it’s obviously better to use a full ERA5 dataset across all years to train the model, since it provides more detailed perspectives which may all serve as a critical point where the experiment can dive deeper. The investigation of extreme weather is also tied closely with the data, the results of this experiment may provide further insight into more objectives for further improving the predictions of these situations. Moreover, there must have been much more extreme weather cases we can test, such as areas with high wind speed, etc. Due to the scope of the study, we prioritize the demonstration of temperature of the African continent as an example. There are a variety of future opportunities for exploring the AI forecasts of more extreme weather cases. Furthermore, for further application, changes can be made to create a web-based interface to replace the code-based pipeline made in the experiment, such that additional fine-tunings can be made more conveniently for users who may not be proficient in coding and machine learning.
6. Conclusion
The purpose of this experiment is to foreshadow the effect of fine-tuning through the lens of solving abnormal predictions on the African continent as a proof of concept for future applications. The effort serves as the foundation for future fine-tuning when more applicable computing resources are allowed. Finally, this experiment anticipates to serve as a supplementary material for potential guidance on future upcoming modification of the algorithm. The construction of the pipeline would to the greatest extent relieve some effort and provide conveniences for future studies.
References
[1]. https://www.cbsnews.com/news/climate-change-extreme-weather-events-deaths/
[2]. United Nations. “Climate Action and Synergies | Department of Economic and Social Affairs.” Sdgs.un.org, 2023, sdgs.un.org/topics/climate-action-synergies.
[3]. https://www.microsoft.com/en-us/research/blog/introducing-aurora-the-first-large-scale-foundation-model-of-the-atmosphere/?msockid=151aa37cc04a60e0180bb207c130615e
[4]. Rasp, S., Dueben, P. D., Scher, S., Weyn, J. A., Mouatadid, S., & Thuerey, N. (2020). WeatherBench: a benchmark data set for data‐driven weather forecasting. Journal of Advances in Modeling Earth Systems, 12(11), e2020MS002203.
[5]. Lam, R., Sanchez-Gonzalez, A., Willson, M., Wirnsberger, P., Fortunato, M., Alet, F., ... & Battaglia, P. (2023). Learning skillful medium-range global weather forecasting. Science, 382(6677), 1416-1421.
[6]. Conti, S. (2024). Artificial intelligence for weather forecasting. Nature Reviews Electrical Engineering, 1(1), 8-8.
[7]. Lopez-Gomez, I., McGovern, A., Agrawal, S., & Hickey, J. (2023). Global extreme heat forecasting using neural weather models. Artificial Intelligence for the Earth Systems, 2(1).
[8]. Bi, K., Xie, L., Zhang, H., Chen, X., Gu, X., & Tian, Q. (2023). Accurate medium-range global weather forecasting with 3D neural networks. Nature, 619(7970), 533-538.
[9]. Keisler, R. (2022). Forecasting global weather with graph neural networks. arXiv preprint arXiv:2202.07575.
[10]. Zhong, X., Chen, L., Liu, J., Lin, C., Qi, Y., & Li, H. (2024). FuXi-Extreme: Improving extreme rainfall and wind forecasts with diffusion model. Science China Earth Sciences, 1-13.
[11]. Cohen, T. S., Geiger, M., Köhler, J., & Welling, M. (2018, February). Spherical CNNs. In International Conference on Learning Representations.
[12]. Kochkov, D., Yuval, J., Langmore, I., Norgaard, P., Smith, J., Mooers, G., ... & Hoyer, S. (2024). Neural general circulation models for weather and climate. Nature, 632(8027), 1060-1066.
[13]. Zhao, J., Lu, C. T., & Kou, Y. (2003, November). Detecting region outliers in meteorological data. In Proceedings of the 11th ACM international symposium on Advances in geographic information systems (pp. 49-55).
[14]. Porto, F., Ferro, M., Ogasawara, E., Moeda, T., de Barros, C. D. T., Silva, A. C., ... & Bezerra, E. (2022). Machine learning approaches to extreme weather events forecast in urban areas: Challenges and initial results. Supercomputing Frontiers and Innovations, 9(1), 49-73.
[15]. Annau, N. J.; Cannon, A. J.; and Monahan, A. H. 2023. Algorithmic hallucinations of near-surface winds: Statistical downscaling with generative adversarial networks to convection permitting scales. Artificial Intelligence for the Earth Systems, 2(4): e230015.
[16]. Morozov, V.; Galliamov, A.; Lukashevich, A.; Kurdukova, A.; and Maximov, Y. 2023. CMIP X-MOS: Improving Climate Models with Extreme Model Output Statistics. arXiv preprint arXiv:2311.03370.
[17]. Lopez-Gomez, I.; McGovern, A.; Agrawal, S.; and Hickey, J. 2023. Global extreme heat forecasting using neural weather models. Artificial Intelligence for the Earth Systems, 2(1): e220035.
[18]. Wang, H.-W.; Peng, Z.-R.; Wang, D.; Meng, Y.; Wu, T.; Sun, W.; and Lu, Q.-C. 2020. Evaluation and prediction of transportation resilience under extreme weather events: A diffusion graph convolutional approach. Transportation research part C: emerging technologies, 115: 102619.
[19]. Ni, Z. 2023. Kunyu: A High-Performing Global Weather Model Beyond Regression Losses. arXiv preprint arXiv:2312.08264.
[20]. Berard, H.; Gidel, G.; Almahairi, A.; Vincent, P.; and LacosteJulien, S. 2019. A closer look at the optimization landscapes of generative adversarial networks. arXiv preprint arXiv:1906.04848.
[21]. Ding, N., Qin, Y., Yang, G., Wei, F., Yang, Z., Su, Y., ... & Sun, M. (2023). Parameter-efficient fine-tuning of large-scale pre-trained language models. Nature Machine Intelligence, 5(3), 220-235.
Cite this article
Zhan,H. (2025). Boosting Extreme Weather Prediction by Fine-tuning a Pre-Trained Large Model: A Study on GraphCast. Theoretical and Natural Science,100,83-94.
Data availability
The datasets used and/or analyzed during the current study will be available from the authors upon reasonable request.
Disclaimer/Publisher's Note
The statements, opinions and data contained in all publications are solely those of the individual author(s) and contributor(s) and not of EWA Publishing and/or the editor(s). EWA Publishing and/or the editor(s) disclaim responsibility for any injury to people or property resulting from any ideas, methods, instructions or products referred to in the content.
About volume
Volume title: Proceedings of the 3rd International Conference on Mathematical Physics and Computational Simulation
© 2024 by the author(s). Licensee EWA Publishing, Oxford, UK. This article is an open access article distributed under the terms and
conditions of the Creative Commons Attribution (CC BY) license. Authors who
publish this series agree to the following terms:
1. Authors retain copyright and grant the series right of first publication with the work simultaneously licensed under a Creative Commons
Attribution License that allows others to share the work with an acknowledgment of the work's authorship and initial publication in this
series.
2. Authors are able to enter into separate, additional contractual arrangements for the non-exclusive distribution of the series's published
version of the work (e.g., post it to an institutional repository or publish it in a book), with an acknowledgment of its initial
publication in this series.
3. Authors are permitted and encouraged to post their work online (e.g., in institutional repositories or on their website) prior to and
during the submission process, as it can lead to productive exchanges, as well as earlier and greater citation of published work (See
Open access policy for details).
References
[1]. https://www.cbsnews.com/news/climate-change-extreme-weather-events-deaths/
[2]. United Nations. “Climate Action and Synergies | Department of Economic and Social Affairs.” Sdgs.un.org, 2023, sdgs.un.org/topics/climate-action-synergies.
[3]. https://www.microsoft.com/en-us/research/blog/introducing-aurora-the-first-large-scale-foundation-model-of-the-atmosphere/?msockid=151aa37cc04a60e0180bb207c130615e
[4]. Rasp, S., Dueben, P. D., Scher, S., Weyn, J. A., Mouatadid, S., & Thuerey, N. (2020). WeatherBench: a benchmark data set for data‐driven weather forecasting. Journal of Advances in Modeling Earth Systems, 12(11), e2020MS002203.
[5]. Lam, R., Sanchez-Gonzalez, A., Willson, M., Wirnsberger, P., Fortunato, M., Alet, F., ... & Battaglia, P. (2023). Learning skillful medium-range global weather forecasting. Science, 382(6677), 1416-1421.
[6]. Conti, S. (2024). Artificial intelligence for weather forecasting. Nature Reviews Electrical Engineering, 1(1), 8-8.
[7]. Lopez-Gomez, I., McGovern, A., Agrawal, S., & Hickey, J. (2023). Global extreme heat forecasting using neural weather models. Artificial Intelligence for the Earth Systems, 2(1).
[8]. Bi, K., Xie, L., Zhang, H., Chen, X., Gu, X., & Tian, Q. (2023). Accurate medium-range global weather forecasting with 3D neural networks. Nature, 619(7970), 533-538.
[9]. Keisler, R. (2022). Forecasting global weather with graph neural networks. arXiv preprint arXiv:2202.07575.
[10]. Zhong, X., Chen, L., Liu, J., Lin, C., Qi, Y., & Li, H. (2024). FuXi-Extreme: Improving extreme rainfall and wind forecasts with diffusion model. Science China Earth Sciences, 1-13.
[11]. Cohen, T. S., Geiger, M., Köhler, J., & Welling, M. (2018, February). Spherical CNNs. In International Conference on Learning Representations.
[12]. Kochkov, D., Yuval, J., Langmore, I., Norgaard, P., Smith, J., Mooers, G., ... & Hoyer, S. (2024). Neural general circulation models for weather and climate. Nature, 632(8027), 1060-1066.
[13]. Zhao, J., Lu, C. T., & Kou, Y. (2003, November). Detecting region outliers in meteorological data. In Proceedings of the 11th ACM international symposium on Advances in geographic information systems (pp. 49-55).
[14]. Porto, F., Ferro, M., Ogasawara, E., Moeda, T., de Barros, C. D. T., Silva, A. C., ... & Bezerra, E. (2022). Machine learning approaches to extreme weather events forecast in urban areas: Challenges and initial results. Supercomputing Frontiers and Innovations, 9(1), 49-73.
[15]. Annau, N. J.; Cannon, A. J.; and Monahan, A. H. 2023. Algorithmic hallucinations of near-surface winds: Statistical downscaling with generative adversarial networks to convection permitting scales. Artificial Intelligence for the Earth Systems, 2(4): e230015.
[16]. Morozov, V.; Galliamov, A.; Lukashevich, A.; Kurdukova, A.; and Maximov, Y. 2023. CMIP X-MOS: Improving Climate Models with Extreme Model Output Statistics. arXiv preprint arXiv:2311.03370.
[17]. Lopez-Gomez, I.; McGovern, A.; Agrawal, S.; and Hickey, J. 2023. Global extreme heat forecasting using neural weather models. Artificial Intelligence for the Earth Systems, 2(1): e220035.
[18]. Wang, H.-W.; Peng, Z.-R.; Wang, D.; Meng, Y.; Wu, T.; Sun, W.; and Lu, Q.-C. 2020. Evaluation and prediction of transportation resilience under extreme weather events: A diffusion graph convolutional approach. Transportation research part C: emerging technologies, 115: 102619.
[19]. Ni, Z. 2023. Kunyu: A High-Performing Global Weather Model Beyond Regression Losses. arXiv preprint arXiv:2312.08264.
[20]. Berard, H.; Gidel, G.; Almahairi, A.; Vincent, P.; and LacosteJulien, S. 2019. A closer look at the optimization landscapes of generative adversarial networks. arXiv preprint arXiv:1906.04848.
[21]. Ding, N., Qin, Y., Yang, G., Wei, F., Yang, Z., Su, Y., ... & Sun, M. (2023). Parameter-efficient fine-tuning of large-scale pre-trained language models. Nature Machine Intelligence, 5(3), 220-235.