


1. Introduction
A Markov chain is a mathematical model of random variables that transit through states, where the future state depends only on the current state and not on the previous state. This “memoryless” property makes Markov chains particularly useful in modelling dynamic systems with randomness and uncertainty. For example, the field of transportation. It has a complex combination of many different types of traffic systems, including road users, modes of transport, traffic flows, signal control, etc. In recent years, urban transportation demand has increased rapidly with the development of the economy, urbanization, and the automobile industry. Considering the growing need for efficient traffic management, Markov chains offer a practical way of understanding and optimizing traffic systems.
Hitherto, the application of Markov chains in transportation has been widely explored. Traffic flow prediction is one of the most significant uses. For instance, Markov chain Monte Carlo algorithms have been used to estimate traffic flow using a Gauss model, which has increased the speed of traffic flow prediction [1]. In particular, some studies concentrated on short time traffic flow prediction [2], whereas others have focused on long term traffic flow prediction [3]. Another notable application is in traffic signal control. Ni et al. developed a Grey Markov chain (GM-Markov) method to optimize traffic signal control. They adjust the signal lights at intersections based on traffic and pedestrian flow to improve traffic efficiency [4]. Markov chains have also been applied to public transportation systems. By combining Markov chains and Queueing Theory, researchers have developed models of bus delay at bays [5]. Similarly, Gong and Luo constructed a Markov-based queueing model for the average queue length at bus stops and used VISSIM simulation software to validate the feasibility and rationality of the model [6]. Moreover, Markov chains have been instrumental in traffic accident prediction. An improved GM-Markov was applied to forecast the future trend of traffic accidents [7]. In another study, pedestrian accident likelihood was assessed based on historical data, helping to identify high-risk areas for targeted preventive measures [8]. It is also worth noting that Markov chains have been applied in tourism transportation. Tang et al. utilized a Markov chain model to predict tourism traffic demand [9]. At the same time, Dong, Wang and Lei developed a passenger flow allocation model for tourism rail transit based on Markov chains [10].
It can be concluded from the previous research that Markov chains have played an essential part in the field of transportation. In this regard, this paper will mainly focus on three Markov-based models and the applications of them.
2. Methodology
This section provides the methodological framework used in this paper, focusing on three models, including the homogeneous Markov chains model, the Grey Markov chains model (GM-Markov), and the Markov-based queueing model.
2.1. Homogeneous Markov Chains Model
A Markov chain is a stochastic process \( X=\lbrace {X_{t}}, t∈{Z^{+}}\rbrace \) that transitions between a finite number of states \( S=\lbrace {s_{0}}, {s_{1}}, …, {s_{n}}\rbrace \) , where the future state of the system depends only on the current state and not on the past states. Mathematically, this can be expressed as:
\( P({X_{t+1}}={s_{j }}|{X_{t}}={s_{i}}, {X_{t-1}}={s_{k}}, …, {X_{0}}={s_{0}})=P({X_{t+1}}={s_{j }}| {X_{t}}={s_{i}})\ \ \ (1) \)
where \( P({X_{t+1}}={s_{j }}| {X_{t}}={s_{i}}) \) represents the probability of transitioning from state \( { s_{i}} \) to state \( { s_{j}} \) in one step. The transitions between states are described by a transition matrix \( P \) , which is defined as:
\( P=(\begin{matrix}{P_{11}} & ⋯ & {P_{1n}} \\ ⋮ & ⋱ & ⋮ \\ {P_{n1}} & ⋯ & {P_{nn}} \\ \end{matrix})\ \ \ (2) \)
where each \( {P_{ij}} \) represents the probability of moving from state \( { s_{i}} \) to state \( { s_{j}} \) . The matrix satisfies the condition that for each row: \( \sum _{j=1}^{n}{P_{ij}}=1 \) .
A homogeneous Markov chain is a special case where the transition probabilities remain constant over time. Mathematically, this can be expressed as:
\( P({X_{t+1}}={s_{j }}| {X_{t}}={s_{i}})=P({X_{t+k}}={s_{j }}| {X_{t}}={s_{i}})\ \ \ (3) \)
which means the probability distribution at any time step \( t \) is given by: \( p(t+1)=P×p(t) \) .
If the Markov chain reaches a steady-state distribution, then as \( t→∞ \) , the system satisfies: \( π×P=π \) . Solving this equation yields the stationary distribution \( π \) , which represents the long-term probabilities of the system being in each state. The uniqueness of \( π \) is ensured if the transition matrix \( P \) is irreducible and aperiodic.
2.2. Grey Markov Chains Model
The GM-Markov combines the Grey System Theory with Markov chains, enabling improved forecasting when data is incomplete or highly uncertain. In transportation research, this model is particularly suitable for the forecast of urban rail passenger flow, where the passenger flow exhibits both deterministic and stochastic properties.
The forecasting process begins with the application of the Grey Model (GM (1,1)), which constructs a trend-based prediction by transforming an initial data sequence \( {X^{(0)}} \) into an accumulated sequence \( {X^{(1)}} \) , defined as:
\( {x^{(1)}}(k)=\sum _{i=1}^{k}{x^{(0)}}(i), k=1, 2, …, n\ \ \ (4) \)
The core differential equation of the \( GM(1,1) \) model is expressed as:
\( \frac{d{X^{(1)}}}{dt}+a{X^{(1)}}=b\ \ \ (5) \)
where a is the development coefficient and b is the control variable.
2.3. Markov-based Queueing Model
A Markov-based queueing model describes a system where arrivals and services follow a Markov process. The arrivals are modeled by a Poisson distribution with rate \( λ \) , whereas the service times follow an exponential distribution with rate \( μ \) .
The state transitions satisfy the following probabilities:
\( {P_{i, i+1}}=λ, {P_{i, i-1}}=μ, {P_{i, i}}=1-(λ+μ)\ \ \ (6) \)
The average queue length is:
\( {L_{q}}=\frac{{λ^{2}}}{μ(μ-λ)} (λ \lt μ)\ \ \ (7) \)
The number of entities in the system is:
\( L={L_{q}}+\frac{λ}{μ}\ \ \ (8) \)
3. Application
This section looks at three important applications, including pedestrian crashes prediction [8], urban rail passenger flow forecasting [11], and bus stop zone length optimization [6]. These applications illustrate how different Markov-based methodologies can benefit the modern transportation systems.
3.1. Pedestrian Crashes Prediction
Pedestrian safety remains a significant concern in urban environments, because road crashes with pedestrians in them often cause the highest death rate. Naturally, finding a way to predict and prevent this kind of accident is essential. Traditional statistical methods, such as regression analysis, often fail to represent the dynamic accident risks. Luckily, homogeneous Markov chains offer a better approach to modeling the accident risks. As a result, authorities can predict future accident rates based on historical data, and also optimize the use of available resources [8].
Data on road crashes with pedestrians in them were collected from the reports of Badajoz in Spain. Using the Markov chain model, it is possible to determine the probability that a system will go from state \( i \) to state \( j \) in time \( t \) . State will be replaced by level in this study. Therefore, the system that evolves in time \( (t=0, 1, …) \) is in level \( {i_{t}} \) at instant \( t \) , and in level \( {i_{t-1}} \) at instant \( t-1 \) :
\( P({X_{t}}={i_{t}}|{X_{0}}={i_{0}}, …, {X_{t-1}}={i_{t-1}})=P({X_{t}}={i_{t}}|{X_{t-1}}={i_{t-1}})={p_{{i_{t-1}}, {i_{t}}}}\ \ \ (9) \)
In the case of a homogeneous chain, those in which no term \( {p_{ij}}(t) \) depends on \( t \) and satisfies equation:
\( p(t)={A^{t}}p(0) where A(t)=(\begin{matrix}{p_{11}}(t) & ⋯ & {p_{1n}}(t) \\ ⋮ & ⋱ & ⋮ \\ {p_{n1}}(t) & ⋯ & {p_{nn}}(t) \\ \end{matrix})\ \ \ (10) \)
where the number of times the system changes from level \( i \) to level \( j \) at time \( t (1 \lt i, j \lt n) \) is represented by the transition matrix A(t).
This equation should also be met if matrix A exhibits the irreducible and primitive property: \( \underset{t→∞}{lim}{p(t)}=\underset{t→∞}{lim}{{A^{t}}p(0)}=\frac{1}{\sum {v_{i}}}(\begin{matrix}{v_{1}} \\ ⋮ \\ {v_{n}} \\ \end{matrix})=EVE of EVA 1, normalized\ \ \ (11) \)
where EVE is the eigenvector of the matrix and EVA is the eigenvalue 1 of the matrix.
In this approach, pedestrian accident risk is classified into five levels according to the monthly number of pedestrian crashes.
It is possible to obtain the probability matrix and the transition matrix based on the historical data that is currently accessible. Accordingly, one can thus obtain the values of EVAs and EVEs, the diagonal and the stationary matrices, and the characteristic polynomial. To simplify, this paper will only show the circumstance of one sector into which the city is divided. The results are shown in Table 1.
Table 1: Results of the prediction model for sector 1 in the city of Badajoz, including the transition matrix and probability matrix [8].
Transition Matrix | Probability Matrix | |
\( (\begin{matrix}1 & 10 & 5 & 1 & 0 \\ 9 & 8 & 10 & 2 & 1 \\ 5 & 11 & 20 & 2 & 2 \\ 1 & 0 & 4 & 0 & 0 \\ 0 & 1 & 2 & 0 & 0 \\ \end{matrix}) \) | \( (\begin{matrix}0.0625 & 0.3333 & 0.1220 & 0.2000 & 0 \\ 0.5625 & 0.2667 & 0.2439 & 0.4000 & 0.3333 \\ 0.3125 & 0.3667 & 0.4878 & 0.4000 & 0.6667 \\ 0.0625 & 0 & 0.0976 & 0 & 0 \\ 0 & 0.0333 & 0.0488 & 0 & 0 \\ \end{matrix}) \) | |
Diagonal matrix | Stationary matrix | |
\( (\begin{matrix}1 & 0 & 0 & 0 & 0 \\ 0 & -0.2870 & 0 & 0 & 0 \\ 0 & 0 & 0.1981 & 0 & 0 \\ 0 & 0 & 0 & 0.0133 & 0 \\ 0 & 0 & 0 & 0 & -0.1074 \\ \end{matrix}) \) | \( (\begin{matrix}0.1790 & 0.1790 & 0.1790 & 0.1790 & 0.1790 \\ 0.3191 & 0.3191 & 0.3191 & 0.3191 & 0.3191 \\ 0.4187 & 0.4187 & 0.4187 & 0.4187 & 0.4187 \\ 0.0520 & 0.0520 & 0.0520 & 0.0520 & 0.0520 \\ 0.0311 & 0.0311 & 0.0311 & 0.0311 & 0.0311 \\ \end{matrix}) \) | |
EVA | EVE | characteristic polynomial |
\( [\begin{matrix}1 \\ -0.2870 \\ 0.1981 \\ 0.0133 \\ -0.1074 \\ \end{matrix}] \) | \( [\begin{matrix}0.1790 \\ 0.3191 \\ 0.4187 \\ 0.0520 \\ 0.0311 \\ \end{matrix}] \) | \( {λ^{5}}-\frac{8039}{9840}{λ^{4}}-\frac{6877}{29520}{λ^{3}}+\frac{729}{16400}{λ^{2}}+\frac{821}{147600}λ-\frac{1}{12300} \) |
By analyzing the results obtained in Table 1, it can be seen that the values of the diagonal matrix coincide with the corresponding EVA values, which also correspond to the roots of the fifth-degree characteristic polynomial. Furthermore, the stationary distribution matrix representing road crash evolution over time shows equal column values, matching the EVE values of EVA 1, consistent with the equations shown above. Following the trend predicted by Markov chains, multiplying these values by 100 gives the probability percentages of each sector being at a certain risk level. The results are shown in Figure 1.
This study proves the validity of Markov chains model in pedestrian traffic accident prediction, which can provide dynamic risk assessment and scientific basis for urban traffic management departments. Future research can further combine machine learning technology to optimize the state division and improve the model's prediction accuracy.
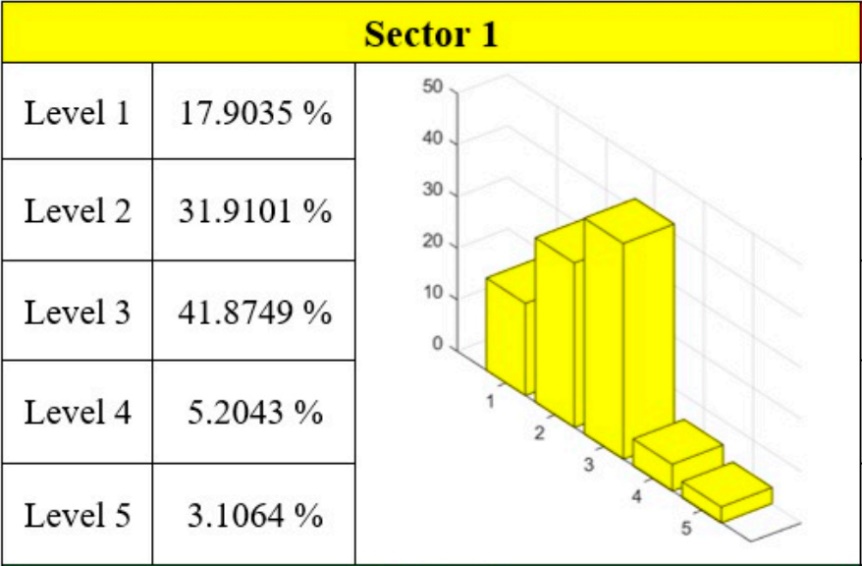
Figure 1: Findings from the Markov model analysis for Badajoz's first sector expressed as a percentage (%) [8].
3.2. Urban Rail Passenger Flow Forecasting
With the acceleration of urbanization, urban rail has become a crucial way to relieve the pressure of urban traffic. Passenger flow forecast is very important for subway scheduling and improving passenger service quality. Traditional passenger flow forecasting methods (such as ARIMA, neural network, etc.) have limitations in dealing with short-term passenger flow fluctuations, thus this study proposes a new prediction method based on a GM-Markov. The long-term trend analysis ability of the GM (1,1) and the short-term state transition correction ability of Markov chains are combined to improve the prediction accuracy [11]. The passenger flow prediction process of urban rail transit using GM (1,1) is shown in Figure 2.
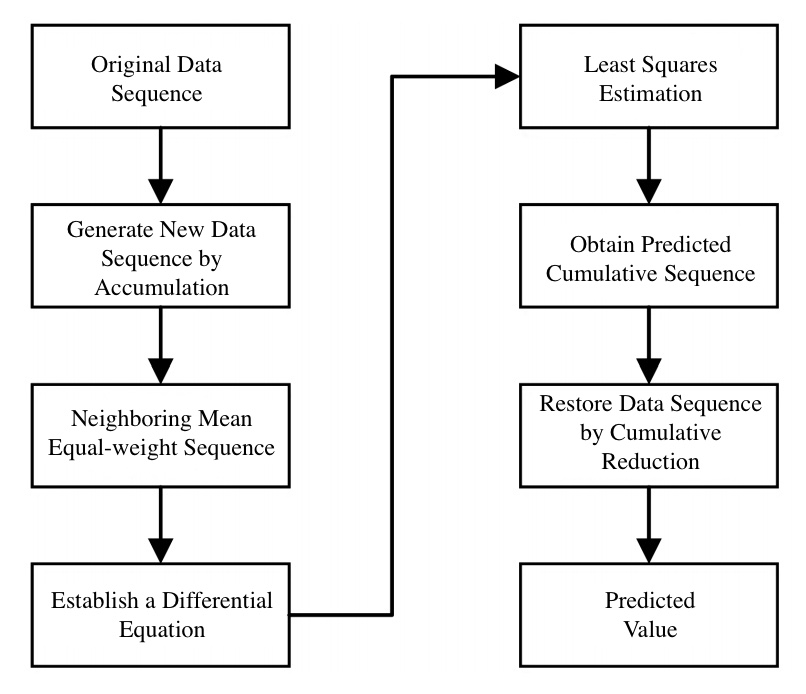
Figure 2: GM (1,1) Urban Rail Transit Passenger Flow Prediction Process [11].
After obtaining the predicted value, it is essential to ensure that they satisfy the Markov property, also known as the memoryless property, for the model to be considered valid. This implies that the future state of passenger flow should depend solely on the current state and not on the sequence of past states. In the case study, the model was applied to forecast passenger flow data on Zhengzhou Metro Line 2 during commuting hours. The results are shown in Figure 3.
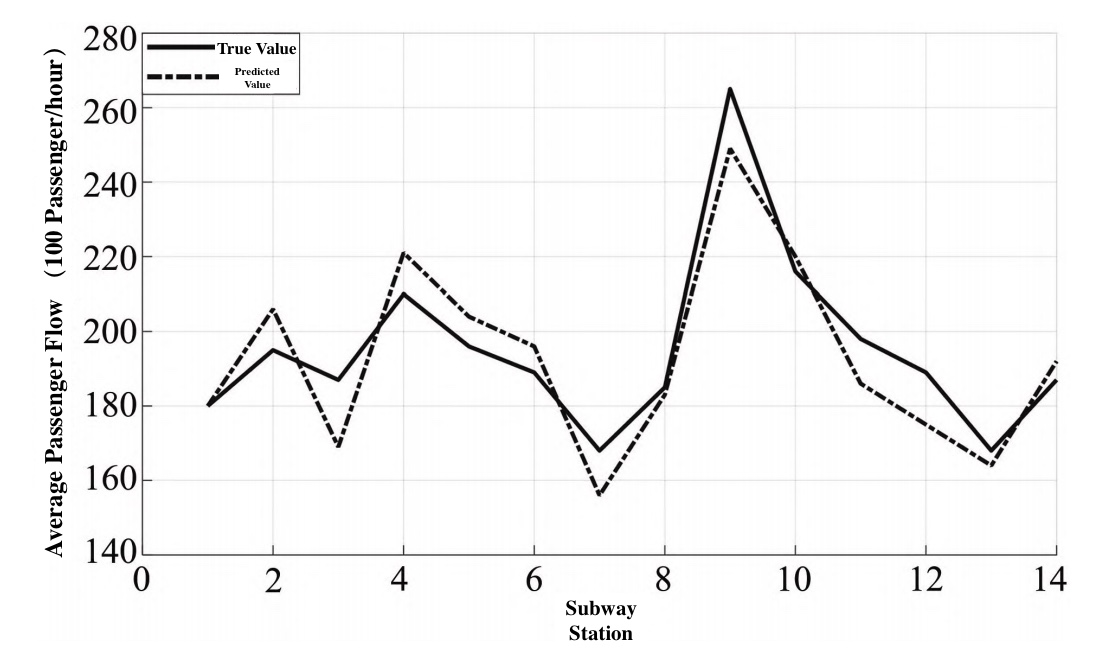
Figure 3: Passenger Flow of Commuting Hours [11].
In order to better evaluate the results of passenger flow prediction, root mean square error \( {E_{ms}} \) and average relative error \( {E_{m}} \) are measured. The formula for calculating \( {E_{ms}} \) and \( {E_{m}} \) is:
\( {E_{ms}}=\sqrt[]{\sum _{i=1}^{n}{({y_{i}}-{ŷ_{i}})^{2}}}, {E_{m}}=\frac{1}{n}\sum _{i=1}^{n}\frac{|{y_{i}}-{ŷ_{i}}|}{{y_{i}}}\ \ \ (12) \)
where \( y=[{y_{1}}, {y_{2}}, …, {y_{n}}] \) is the passenger flow of the subway station, \( {ŷ_{i}}=[{ŷ_{i}}, {ŷ_{i}}, …, {ŷ_{i}}] \) is the predicted passenger flow of the subway station. It is calculated that the \( {E_{m}} \) is less than 10%, implying a relatively high prediction accuracy. The Grey-Markov significantly enhances the short-term forecast accuracy, making it suitable for dynamic scheduling adjustments.
3.3. Bus Stop Zone Length Optimization
The bus stop zone length is an important index to measure the capacity of a bus stop. If the bus stop zone is too short, buses will queue outside the stop, increasing passenger waiting time and reducing the traffic efficiency of intersections and other vehicles. Conversely, if the zone is too long, it may lead to disordered bus docking, thus also reducing efficiency, wasting space, and increasing costs. Therefore, optimizing bus stop zone length is essential for balancing service efficiency and traffic flow. A Markov-based queueing model provides a feasible approach for analyzing bus arrival rates, dwell times, and congestion levels to design an optimal stop zone length [6].
This research assumed that the bus arrival process obeys Poisson distribution. Then Markov chains were used to help determine the berths. It was tested by the VISSIM that the model was useful. As a result, a modification scheme could be proposed.
This model improves bus stop efficiency by preventing excessive queuing and service delays. Future research can integrate real-time GPS tracking, allowing the model to adjust the bus stop zone length based on different demand patterns.
4. Conclusion
This paper introduced how Markov chains can be applied to the field of transportation, focusing on three key models: homogeneous Markov chains, Grey Markov chains (GM-Markov), and Markov-based queueing models. Homogeneous Markov chains effectively predict pedestrian crash risks by identifying high-risk areas and providing targeted solutions. GM-Markov improved short-term forecasting accuracy for urban rail passenger flow, making it easier for the government to manage. Markov-based queueing model helped optimize the bus stop zone length, improving service efficiency. These findings demonstrate that Markov chains are very effective in modelling and improving the transportation system. However, some limitations remain. The accuracy of Markov chain models depends on the quality of the data, which can be hard to collect in real-world scenarios. Future research may consider combining machine learning with Markov chains to improve prediction accuracy and better adapt to the ever-changing conditions. On the other hand, due to time and resource constraints, no new methods or models were proposed in this paper. Still, it provides a strong foundation for future research and practical improvements in transportation management.
References
[1]. Hu, J., Li, L., Li, Z., Yao, D., Zhang, Y. and Wang, S. (2016). Markov chain Monte Carlo algorithm based traffic flow deficiency data estimating method, involves calculating deficiency data value, and calculating traffic flow deficiency rate value according to gauss model (CN105206039A). China National Intellectual Property Administration.
[2]. Cao, Y., Shen, Q., Wang, Y., Huang, Y. and Liu, H. (2019). Markov-based gray Verhulst short time traffic flow prediction method, involves obtaining initial prediction value, and correcting residual of initial predicted value by using Markov chain to obtain final predicted value (CN109637128B). China National Intellectual Property Administration.
[3]. Xie, K.B. (2017). Long-term Prediction of Traffic Volume Based on Combined Model of Markov Chains (Master’s thesis). Beijing JiaoTong University.
[4]. Ni, X., Guo, P., Fang, Z., Song, Z., Liu, P. and Rao, L. (2023). Method for controlling signal lamp of cross port relating to technical field of traffic such as low-flow intersection based on grey Markov chain, involves adjusting traffic light duration data of vehicle traffic signal lamp according to corrected prediction result (CN116110237B). China National Intellectual Property Administration.
[5]. Sun, F., Sun, L., Sun, S.W. and Wang, D.H. (2015). Study on the Calculation Models of Bus Delay at Bays Using Queueing Theory and Markov Chain. Computational Intelligence and Neuroscience, 2015, Article 750304.
[6]. Gong, K. and Luo, D. (2018). Study on Length Optimization of Bus Stop Zone. Automobile Applied Technology, 2018(07), 187-191.
[7]. Chen, K.M., Xie, L.F. and Xiang, W.S. (2012). Traffic Accidents Prediction Using Improved Grey-Markov Model. Applied Materials and Electronics Engineering, PTS 1-2, 378-379, 222-.
[8]. Moreno-Sanfélix, A., Gragera-Peña, F.C. and Jaramilo-Morán, M.A. (2024). Predictive Model of Pedestrian Crashes Using Markov Chains in the City of Badajoz, Sustainability, 16(22), Article 10115.
[9]. Tang, X., Lv, Y., Luo, T., Guo, X. and Lin, T. (2021). Method for predicting travel traffic demand based on Markov chain for roaming traffic in tourist area, involves determining state value of Markov chain prediction model for next time period according to initial state matrix and tourism traffic transition matrix to predict tourism traffic demand (CN113449932A). China National Intellectual Property Administration.
[10]. Dong, H., Wang, H.F. and Lei, J.Q. (2022). Passenger Flow Assignment Model of Tourist Rail Transit Based on Markov Chain, Urban Mass Transit, 2022, 25(09), 38-44.
[11]. Wu, M. (2023). Research on Ridership Prediction of Urban Rail Transit based on Markov chain, Journal of Chengdu Technological University, 26 (1), 62-65.
Cite this article
Li,X. (2025). Study on the Application of Markov Chains in Transportation. Theoretical and Natural Science,100,171-178.
Data availability
The datasets used and/or analyzed during the current study will be available from the authors upon reasonable request.
Disclaimer/Publisher's Note
The statements, opinions and data contained in all publications are solely those of the individual author(s) and contributor(s) and not of EWA Publishing and/or the editor(s). EWA Publishing and/or the editor(s) disclaim responsibility for any injury to people or property resulting from any ideas, methods, instructions or products referred to in the content.
About volume
Volume title: Proceedings of the 3rd International Conference on Mathematical Physics and Computational Simulation
© 2024 by the author(s). Licensee EWA Publishing, Oxford, UK. This article is an open access article distributed under the terms and
conditions of the Creative Commons Attribution (CC BY) license. Authors who
publish this series agree to the following terms:
1. Authors retain copyright and grant the series right of first publication with the work simultaneously licensed under a Creative Commons
Attribution License that allows others to share the work with an acknowledgment of the work's authorship and initial publication in this
series.
2. Authors are able to enter into separate, additional contractual arrangements for the non-exclusive distribution of the series's published
version of the work (e.g., post it to an institutional repository or publish it in a book), with an acknowledgment of its initial
publication in this series.
3. Authors are permitted and encouraged to post their work online (e.g., in institutional repositories or on their website) prior to and
during the submission process, as it can lead to productive exchanges, as well as earlier and greater citation of published work (See
Open access policy for details).
References
[1]. Hu, J., Li, L., Li, Z., Yao, D., Zhang, Y. and Wang, S. (2016). Markov chain Monte Carlo algorithm based traffic flow deficiency data estimating method, involves calculating deficiency data value, and calculating traffic flow deficiency rate value according to gauss model (CN105206039A). China National Intellectual Property Administration.
[2]. Cao, Y., Shen, Q., Wang, Y., Huang, Y. and Liu, H. (2019). Markov-based gray Verhulst short time traffic flow prediction method, involves obtaining initial prediction value, and correcting residual of initial predicted value by using Markov chain to obtain final predicted value (CN109637128B). China National Intellectual Property Administration.
[3]. Xie, K.B. (2017). Long-term Prediction of Traffic Volume Based on Combined Model of Markov Chains (Master’s thesis). Beijing JiaoTong University.
[4]. Ni, X., Guo, P., Fang, Z., Song, Z., Liu, P. and Rao, L. (2023). Method for controlling signal lamp of cross port relating to technical field of traffic such as low-flow intersection based on grey Markov chain, involves adjusting traffic light duration data of vehicle traffic signal lamp according to corrected prediction result (CN116110237B). China National Intellectual Property Administration.
[5]. Sun, F., Sun, L., Sun, S.W. and Wang, D.H. (2015). Study on the Calculation Models of Bus Delay at Bays Using Queueing Theory and Markov Chain. Computational Intelligence and Neuroscience, 2015, Article 750304.
[6]. Gong, K. and Luo, D. (2018). Study on Length Optimization of Bus Stop Zone. Automobile Applied Technology, 2018(07), 187-191.
[7]. Chen, K.M., Xie, L.F. and Xiang, W.S. (2012). Traffic Accidents Prediction Using Improved Grey-Markov Model. Applied Materials and Electronics Engineering, PTS 1-2, 378-379, 222-.
[8]. Moreno-Sanfélix, A., Gragera-Peña, F.C. and Jaramilo-Morán, M.A. (2024). Predictive Model of Pedestrian Crashes Using Markov Chains in the City of Badajoz, Sustainability, 16(22), Article 10115.
[9]. Tang, X., Lv, Y., Luo, T., Guo, X. and Lin, T. (2021). Method for predicting travel traffic demand based on Markov chain for roaming traffic in tourist area, involves determining state value of Markov chain prediction model for next time period according to initial state matrix and tourism traffic transition matrix to predict tourism traffic demand (CN113449932A). China National Intellectual Property Administration.
[10]. Dong, H., Wang, H.F. and Lei, J.Q. (2022). Passenger Flow Assignment Model of Tourist Rail Transit Based on Markov Chain, Urban Mass Transit, 2022, 25(09), 38-44.
[11]. Wu, M. (2023). Research on Ridership Prediction of Urban Rail Transit based on Markov chain, Journal of Chengdu Technological University, 26 (1), 62-65.