1. Introduction
Sleep doesn’t happen all at once—it passes through a series of stages that cycle across the night. These include the non-REM stages (N1 to N3), as well as REM sleep, when the brain becomes more active and dreaming usually occurs. Being able to tell these stages apart is important for diagnosing a range of disorders, like sleep apnea and narcolepsy [1].
EEG, or electroencephalography, is often used to monitor brain signals while people sleep. These signals shift depending on the stage, and sleep technicians usually interpret them using standardized rules like those from the AASM [2-3]. But even with guidelines, manual scoring takes time and can vary between scorers.
That’s why automatic classification methods have become a major area of research. Some of the most accurate results come from deep learning models [4], though they need large datasets and lots of computing power. In clinics or with portable devices, this can be a problem.
One alternative is to look at the frequency components of EEG data. The Fourier Transform helps break a signal down into bands like delta, theta, alpha, and beta—all of which relate to different sleep stages [5]. These features are relatively easy to compute and interpret, but most studies include them as just part of a larger pipeline.
In this work, we wanted to test how far those basic features could go on their own. We used spectral power from each band and applied two straightforward classifiers—SVM and KNN [6]. These are easy to use, don’t need GPUs, and are more transparent than neural networks. We ran the tests on the full Sleep-EDF Expanded dataset (153 recordings from OpenDataLab) to see whether simple frequency information and light models can still produce meaningful results in sleep staging.
2. Literature review
Understanding sleep stages matters for both research and medical work. The AASM splits sleep into five main stages: Wake, N1, N2, N3, and REM. These are not just labels—each shows up differently in EEG recordings. For example, light sleep (N1) tends to have low and mixed frequencies. As sleep deepens into N2 and N3, patterns change: N2 includes spindles and K-complexes, while N3 is mostly slow-wave delta activity. REM, on the other hand, looks more like being awake—low amplitude, fast, and mixed.
Traditionally, people score these stages by eye. It works, but it’s slow and not always consistent [7]. That’s probably why automated systems became more popular over time. In the early years, some methods used if-then rules or hand-picked features. These were efficient but couldn’t easily adapt to new data.
Later came deep learning. Neural networks like CNNs and RNNs got good at learning EEG patterns directly [8-9]. Still, the downside is clear: they need lots of data, long training time, and strong hardware. For everyday or clinical use, that’s a big hurdle.
Fourier-based analysis is another route. It breaks EEG down into frequency bands like delta, theta, alpha, and beta [10]. These are often used as inputs to models, especially deep or ensemble systems. But in many cases, they aren’t evaluated on their own. For example, [11] and [12] both used them, but mostly as part of something bigger.
There’s still a gap: not many people have tested how well these features work with just basic models. One example, [13], looked at time vs. frequency inputs—but their study stayed within deep learning. [14] also used neural nets without diving into how the spectral features behaved.
That’s where this paper steps in. We keep it simple: frequency-band features plus two classic classifiers, SVM and KNN. No deep nets, no ensembles. Just a full EEG dataset and a direct question—can this basic setup still classify sleep stages in a useful way?
3. Methodology
3.1. Dataset and subject selection
This study uses the Sleep-EDF Expanded dataset made available through OpenDataLab, which replicates the original resource from PhysioNet. The dataset includes full-night polysomnographic (PSG) recordings from healthy adults, all collected in a controlled lab environment. Each recording is stored in EDF format and comes with an accompanying hypnogram file that labels sleep stages throughout the night.
From the full archive, we selected only complete PSG-hypnogram pairs. This filtering resulted in 153 valid recordings for analysis. Each subject’s data included two files: one for the EEG and other physiological signals, and one for the stage annotations. All files were processed locally after download.
The PSG signals include EEG, EOG, and EMG channels. While multiple signals can improve stage classification [15], we limited focus to EEG, specifically the Fpz-Cz channel. When that was missing, alternatives like Pz-Oz or C4-A1 were used instead. EEG recordings were sampled at 100 Hz, and sleep stages were annotated in 30-second segments, following AASM standards.
We mapped the annotated sleep stages into five categories: Wake (W), N1, N2, N3 (combining stages 3 and 4), and REM. These labels were later matched to corresponding EEG epochs to be used as targets for the classification models.)
3.2. Signal processing
We processed each EEG recording using a standardized pipeline built with MNE-Python. All 153 PSG-hypnogram pairs went through this process individually.
One EEG channel was selected for each subject. Fpz-Cz was the first choice when available, as it is frequently used in sleep studies. If that wasn’t present, we used other EEG channels like Pz-Oz or C4-A1 depending on what was recorded.
To clean the signal, we applied a bandpass filter between 0.5 and 30 Hz. This helped eliminate slow drifts and fast noise, while keeping the main sleep-related frequency bands intact—delta, theta, alpha, and beta.
We then loaded the sleep stage labels from the hypnogram file. These labels appear every 30 seconds and were converted into numeric codes: 1 for Wake, 2 for N1, 3 for N2, 4 for N3 (combining stages 3 and 4), and 5 for REM. The EEG was split into non-overlapping 30-second chunks to match the labels. Any segment with poor signal quality or missing data was excluded automatically.
All scripts were written in Python (version 3.11) and run in batch mode so that every file was handled the same way. The clean segments were saved for use in the next step: spectral analysis.
3.3. Spectral feature extraction
After preprocessing, we analyzed each EEG segment in the frequency domain. Instead of using the standard FFT, we chose Welch’s method to estimate spectral power. It works by dividing the signal into overlapping windows and averaging their spectra, which makes the output more stable and less sensitive to noise.
The EEG was sampled at 100 Hz. For each 30-second segment, we applied Welch’s method using a window of 256 samples and 50% overlap. This gave us a clear view of the power distribution across the signal without losing time resolution.
We focused on four frequency bands that are relevant to sleep:
• Delta (0.5–4 Hz): often seen in deep sleep,
• Theta (4–8 Hz): linked to light sleep and REM,
• Alpha (8–13 Hz): common during relaxed wakefulness,
• Beta (13–30 Hz): more active during REM and alert states.
For every segment, we calculated how much power was present in each of these bands. That gave us a simple four-number summary of the signal. These summaries were then matched with the sleep stage label from the hypnogram.
When this process was done for all recordings, we had a full dataset of labeled segments. Each one had a spectral profile and a known sleep stage. We saved everything as a CSV file, which was later used to train the classifiers.
3.4. Machine learning classification
To test how well the spectral features could classify sleep stages, we trained two standard machine learning models: K-Nearest Neighbors (KNN) and Support Vector Machine (SVM). These algorithms are simple, easy to interpret, and don’t require much computing power, which makes them practical for real-world use.
3.4.1. Feature standardization and data splitting
Each 30-second EEG segment was represented by four numbers--one for the power in each of the delta, theta, alpha, and beta bands. These were paired with sleep stage labels (Wake, N1, N2, N3, REM) to form a multi-class classification problem.
Before training the models, we normalized the features using z-score scaling so that each column had a mean of zero and a standard deviation of one. This helped prevent any one feature from dominating due to differences in scale. We then split the data into training and testing sets, with 80% used for training and 20% for testing. The split was stratified so that all sleep stages remained balanced across the two sets.
3.4.2. K-Nearest Neighbors (KNN) classifier
We used a KNN model with k=5, where each test point was classified based on the majority vote of its five closest neighbors in the training data. Euclidean distance was used to measure similarity. KNN doesn’t rely on a learned model structure, which makes it flexible but also sensitive to how the data is distributed.
3.4.3. Support Vector Machine (SVM) classifier
We also trained an SVM classifier using a radial basis function (RBF) kernel. This setup allows the model to draw nonlinear boundaries between sleep stages. The regularization parameter was left at the default value C=1.0, and the kernel coefficient was set to 'scale'. SVM tends to work well even when the feature space is small, as in our case.
3.4.4. Evaluation metrics
We tested both models on the same test set and used several metrics to compare their performance:
• Accuracy: percentage of correctly predicted stages.
• Precision, Recall, F1-score: calculated for each stage to understand performance on specific classes.
• Confusion Matrix: to visualize how the predictions were distributed across stages.
The results for both models are shown in the next section, where we compare their strengths and weaknesses in more detail.
4. Results
4.1. Spectral feature distribution
We looked at how the power in each EEG frequency band varied across the five sleep stages, using boxplots to compare them. The differences weren’t perfectly clean, but some clear patterns did emerge.
4.1.1. Delta power
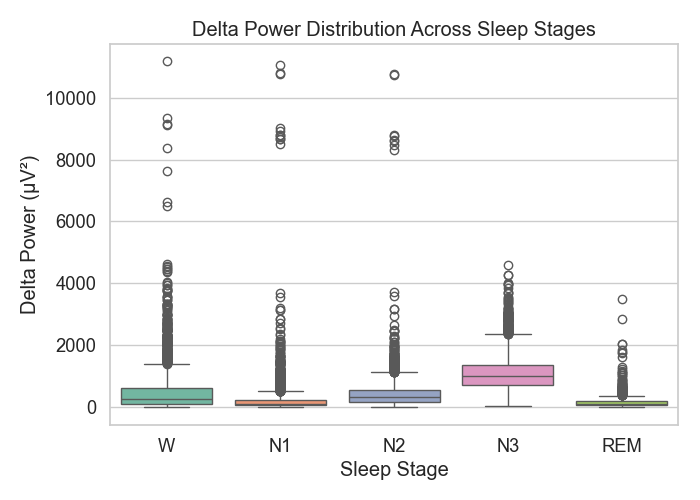
Figure 1: Delta power distribution
Delta power (see Figure 1) was strongest during N3, which matches what we know about slow-wave activity in deep sleep. Wake and REM stages had much less delta energy.
4.1.2. Theta power
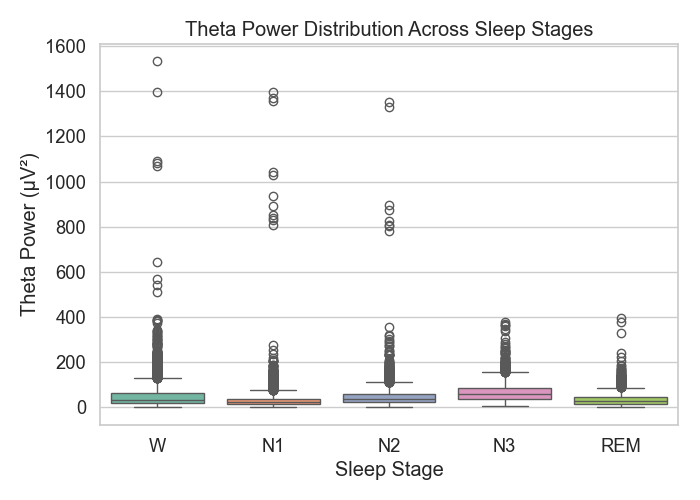
Figure 2: Theta power distribution
In Figure 2, theta power appeared across all stages but tended to rise a bit in N1 and REM—these lines up with prior work that connects theta with light sleep and dreaming.
4.1.3. Alpha power
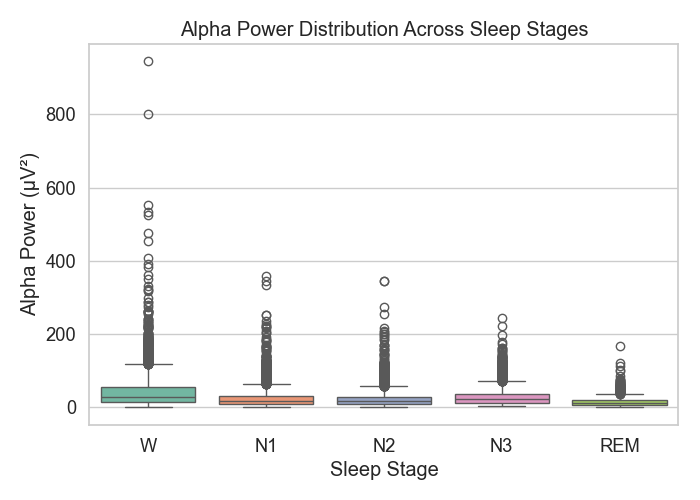
Figure 3: Alpha power distribution
Figure 3 shows that alpha power peaked during the Wake stage. This makes sense, since alpha is common when someone is awake but relaxed. As sleep deepened, alpha power dropped off quickly.
4.1.4. Beta power
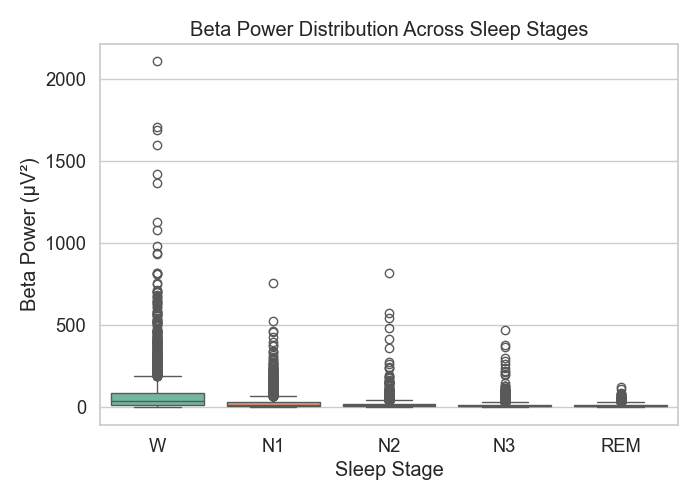
Figure 4: Beta power distribution
In Figure 4, beta power showed up the most during REM and wakefulness, but there was considerable overlap with other stages too, which suggests beta isn’t as reliable on its own.
Overall, these frequency bands capture meaningful stage-related differences, but there’s still a lot of overlap—especially between N1, N2, and REM. That’s likely why combining multiple bands through machine learning works better than relying on a single metric.
4.2. Sleep stage classification
To evaluate the model performance, we ran both KNN and SVM classifiers using the power values from the four EEG frequency bands. The goal was to see how well simple spectral features could distinguish sleep stages.
Table 1: KNN classification report
Sleep Stage | Precision | Recall | F1-score | Support |
W | 0.497 | 0.505 | 0.501 | 739 |
N1 | 0.457 | 0.508 | 0.481 | 1189 |
N2 | 0.510 | 0.512 | 0.511 | 1276 |
N3 | 0.748 | 0.775 | 0.761 | 911 |
REM | 0.383 | 0.157 | 0.223 | 312 |
Accuracy | 0.539 | 4427 | ||
Macro avg | 0.519 | 0.491 | 0.495 | 4427 |
Weighted avg | 0.533 | 0.539 | 0.532 | 4427 |
The KNN model, shown in Table 1, reached an overall accuracy of 53.9%. Not surprisingly, it performed best on N3 sleep, with an F1-score of 0.761. N3 tends to stand out due to its strong delta power, so this result was expected. For N2, the score was moderate (F1 = 0.511), while performance dropped sharply on REM, with an F1-score of just 0.223. I suspect this is related to the smaller number of REM samples and possibly more overlap with nearby stages like N1.
Table 2: SVM classification report
Sleep Stage | Precision | Recall | F1-score | Support |
W | 0.679 | 0.395 | 0.500 | 739 |
N1 | 0.492 | 0.666 | 0.566 | 1189 |
N2 | 0.523 | 0.569 | 0.545 | 1276 |
N3 | 0.742 | 0.814 | 0.777 | 911 |
REM | 0.000 | 0.000 | 0.000 | 312 |
Accuracy | 0.576 | 4427 | ||
Macro avg | 0.487 | 0.489 | 0.477 | 4427 |
Weighted avg | 0.549 | 0.576 | 0.552 | 4427 |
The SVM model, summarized in Table 2, did slightly better overall with 57.6% accuracy. It showed a similar strength in identifying N3 (F1 = 0.777), and its results for N2 and N1 were a bit stronger than KNN’s. Interestingly, it also improved Wake stage prediction slightly. However, just like KNN, it failed to pick up REM—precision and recall were both very low for that class.
Looking at the macro and weighted F1-scores (0.477 and 0.552), SVM seemed to handle the class imbalance more gracefully, though it still struggled with underrepresented stages. This suggests that while spectral power works well for certain stages—especially deep sleep—it may not be enough on its own. Future improvements might come from rebalancing the dataset or using features that better capture time-dependent changes.
4.3. Confusion matrix analysis
To better understand where the models performed well—or didn’t—we examined the confusion matrices from both KNN and SVM (Figures 5 and 6). These visuals helped identify which stages were often mixed up.
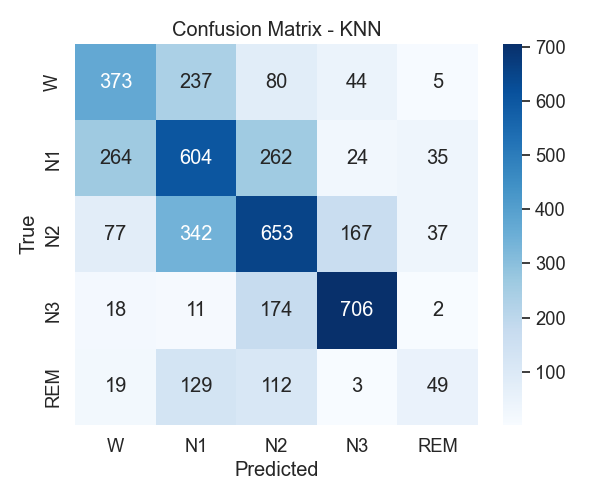
Figure 5: KNN confusion matrix
With KNN, the first thing that stood out was how well N3 was classified. Most N3 samples were correctly identified, which makes sense given how distinct its spectral signature is. But when it came to N1, there was a lot more confusion. Many of those samples ended up labeled as Wake or N2. That wasn’t too surprising, since light sleep and wakefulness tend to have overlapping features.
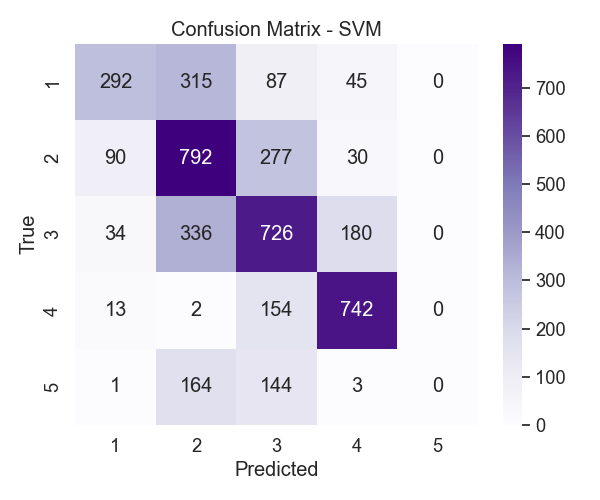
Figure 6: SVM confusion matrix
The SVM matrix in Figure 6 told a similar story. It also handled N3 well and did a slightly better job distinguishing between N1 and N2 compared to KNN. That said, REM remained a big issue. None of the REM samples were correctly predicted, which gave it a recall of zero. That might have to do with how few REM examples were available—or maybe its features aren’t different enough to stand out.
Overall, the confusion matrices highlighted a familiar pattern: deep sleep is relatively easy to spot, but lighter and transitional stages like N1 or REM are much harder. These results suggest that relying only on frequency band power has limits. Other studies using single-channel EEG have noted the same challenge with REM detection [16], so future work might need to look at different features or balance the dataset better.
5. Conclusion
5.1. Comparison with prior studies
Our models didn’t reach the same accuracy levels as deep learning methods, but that was expected—and not the main goal. Instead of aiming for top-line performance, we focused on transparency and simplicity, which are often more practical in real-world applications.
For context, [4] and [8] both used deep neural networks on the same dataset and reported accuracies above 80%. In comparison, our SVM model reached 57.6%. That’s a significant gap, but one that comes with important trade-offs. Unlike complex models, our approach doesn’t require GPUs, massive training data, or long processing times. In clinical or wearable-device contexts, those practical benefits can matter more than a few extra percentage points of accuracy.
When it comes to deep sleep (N3), our models performed surprisingly well. With F1-scores above 0.76 for both classifiers, our results align with earlier studies that highlighted delta power as a strong indicator of this stage. This supports the idea that for clearly defined stages like N3, simple frequency features can be just as effective as more advanced techniques.
However, the results weren’t as strong for lighter or transitional stages. Many N1 samples were misclassified as Wake or N2, likely because the frequency bands for those stages overlap. This shows the limitations of using just static spectral features: they don’t always capture the subtle shifts in brain activity that define transitions between sleep states.
5.2. Practical implications
The fact that this system uses basic features and straightforward classifiers makes it easier to deploy in environments where resources are limited. For example, wearable sleep trackers or bedside devices could benefit from models that run quickly and don’t rely on massive, labeled datasets [17].
Also, the use of defined frequency bands means clinicians can trace predictions back to known physiological patterns. Instead of black-box decisions, the output can be explained, which is especially useful for clinical interpretation and trust [18].
5.3. Limitations
There are a few important limitations to consider. First, we only used single-channel EEG data. That means we lost spatial information, which may be one reason the models struggled to recognize REM sleep. Prior work has shown that including more channels—or adding EOG and EMG—can improve performance, especially for complex stages like REM [19].
Second, the dataset had a clear class imbalance. REM and N1 stages were underrepresented, and that likely skewed the models toward the majority classes. It also didn’t help that REM and N1 share some frequency similarities with nearby stages [16], making them harder to isolate with power-based features alone.
Finally, our features came from Fourier analysis, which assumes the signal is stationary. But EEG signals during sleep are often dynamic. Using a stationary method may have limited our ability to pick up quick transitions or brief events—something future work could address.
5.4. Future work
There are several directions this project could take. First, using multiple EEG channels—or bringing in other signals like EOG and EMG—would likely help, especially with REM classification. Second, applying time-frequency methods like wavelets or short-time Fourier transform could let us capture transient changes, not just average power.
Also, the imbalance in the data could be addressed with sampling techniques or class weighting during training. And finally, it might be worth exploring lightweight hybrid models—ones that combine frequency features with simple sequential layers like RNNs—to improve performance without giving up transparency or speed.
6. Conclusion
In this study, we looked at whether simple frequency features—taken from EEG using Fourier analysis—could support sleep stage classification when paired with basic models like KNN and SVM. While the results weren’t outstanding in overall accuracy (53.9% for KNN, 57.6% for SVM), both models handled deep sleep (N3) quite well, with F1-scores above 0.76.
The classifiers struggled more with N1 and REM, which wasn’t too surprising. These stages are both less represented in the dataset and have overlapping spectral content, so distinguishing them using just bandpower features is difficult. Still, the models’ simplicity and speed make them appealing for practical settings—like wearable sleep trackers or clinical tools where explainability matters.
There’s room for improvement. Adding more EEG channels, or signals like EMG and EOG, could help. So could switching to time-frequency features, which might better capture transitions [20]. More diverse datasets would also help test generalizability.
In short, this pipeline doesn’t aim to replace deep neural networks—but it shows that lightweight, interpretable methods still have a place in EEG-based sleep research, especially where clarity, speed, and simplicity are priorities.
References
[1]. Iber, C., Ancoli-Israel, S., Chesson, A. L., & Quan, S. F. (2007). The AASM manual for the scoring of sleep and associated events: Rules, terminology and technical specifications. American Academy of Sleep Medicine.
[2]. Steriade, M. (2006). Grouping of brain rhythms in corticothalamic systems. Neuroscience, 137(4), 1087–1106.
[3]. Dankar, F. K., & El Emam, K. (2013). Practicing differential privacy in health care: A review. Transactions on Data Privacy, 6(1), 35–67.
[4]. Phan, H., Andreotti, F., Cooray, N., Chén, O. Y., & De Vos, M. (2019). SeqSleepNet: End-to-end hierarchical recurrent neural network for sequence-to-sequence automatic sleep staging. IEEE Transactions on Neural Systems and Rehabilitation Engineering, 27(3), 400–410.
[5]. Hassan, A. R., & Bhuiyan, M. I. H. (2016). Automatic sleep stage classification using single-channel EEG: Feature extraction, selection and classification. Computer Methods and Programs in Biomedicine, 140, 165–175.
[6]. Khalighi, S., Sousa, T., Pires, G., & Nunes, U. (2013). Automatic sleep staging: A computer assisted approach for optimal combination of features and polysomnographic channels. Expert Systems with Applications, 40(17), 7046–7059.
[7]. Rechtschaffen, A., & Kales, A. (1968). A manual of standardized terminology, techniques and scoring system for sleep stages of human subjects. U.S. National Institutes of Health.
[8]. Supratak, A., Dong, H., Wu, C., & Guo, Y. (2017). DeepSleepNet: A model for automatic sleep stage scoring based on raw single-channel EEG. IEEE Transactions on Neural Systems and Rehabilitation Engineering, 25(11), 1998–2008.
[9]. Mousavi, S. R., Afghah, F., & Rios-Gutierrez, F. (2019). Time-frequency analysis of EEG signals for automatic sleep stage classification using short-time Fourier transform and neural networks. 2019 IEEE EMBS International Conference on Biomedical & Health Informatics (BHI), 1-4.
[10]. Alickovic, E., Kevric, J., & Subasi, A. (2018). Performance evaluation of empirical mode decomposition, discrete wavelet transform, and wavelet packet decomposition for automated epileptic seizure detection and prediction. Journal of Neuroscience Methods, 261, 29–37.
[11]. Aboalayon, K. A. I., Faezipour, M., Almuhammadi, W. S., & Moslehpour, S. (2016). Sleep stage classification using EEG signal analysis: A comprehensive survey and new investigation. Entropy, 18(9), 272.
[12]. Yildirim, O., Baloglu, U. B., & Acharya, U. R. (2019). A deep learning model for automated sleep stages classification using PSG signals. International Journal of Environmental Research and Public Health, 16(4), 599.
[13]. Li, K., Zheng, C., & Tao, D. (2021). Interpretable EEG classification for sleep stage analysis via attention-based CNN. Information Sciences, 580, 387–399.
[14]. Sharma, M., Acharya, U. R., & Garaniya, N. (2018). Automated sleep stage scoring using deep neural networks: Study on complex healthy participants. Journal of Medical Systems, 42(5), 88
[15]. Morokuma, S., Hayashi, T., Kanegae, M., Mizukami, Y., Asano, S., Kimura, I., Tateizumi, Y., Ueno, H., Ikeda, S., & Niizeki, K. (2023). Deep learning-based sleep stage classification with cardiorespiratory and body movement activities in individuals with suspected sleep disorders. Scientific Reports, 13, 17730.
[16]. Seo, H., Back, S., Lee, S., Park, D., Kim, T., & Lee, K. (2020). IITNet: Intro- and inter-epoch temporal context network for automatic sleep scoring on raw single-channel EEG. Biomedical Signal Processing and Control, 61, 102036.
[17]. Michalak, P., & Kotas, M. (2022). Lightweight EEG-based deep learning system for real-time sleep stage classification. Biomedical Signal Processing and Control, 71, 102795.
[18]. Yeh, P.-L., Ozgoren, M., Chen, H.-L., Chiang, Y.-H., Lee, J.-L., Chiang, Y.-C., & Chiang, R. P.-Y. (2024). Automatic wake and deep-sleep stage classification based on Wigner–Ville distribution using a single electroencephalogram signal. Diagnostics, 14(6), 580.
[19]. Michielli, N., Acharya, U. R., & Molinari, F. (2019). Cascaded LSTM recurrent neural network for automated sleep stage classification using single-channel EEG signals. Computers in Biology and Medicine, 106, 71–81.
[20]. Jirakittayakorn, N., Wongsawat, Y., & Mitrirattanakul, S. (2024). ZleepAnlystNet: A novel deep learning model for automatic sleep stage scoring based on single-channel raw EEG data using separating training. Scientific Reports, 14, 9859.
Cite this article
Cao,L. (2025). Fourier-Based Spectral Analysis of EEG Signals for Sleep Stage Classification. Theoretical and Natural Science,109,122-132.
Data availability
The datasets used and/or analyzed during the current study will be available from the authors upon reasonable request.
Disclaimer/Publisher's Note
The statements, opinions and data contained in all publications are solely those of the individual author(s) and contributor(s) and not of EWA Publishing and/or the editor(s). EWA Publishing and/or the editor(s) disclaim responsibility for any injury to people or property resulting from any ideas, methods, instructions or products referred to in the content.
About volume
Volume title: Proceedings of CONF-MPCS 2025 Symposium: Leveraging EVs and Machine Learning for Sustainable Energy Demand Management
© 2024 by the author(s). Licensee EWA Publishing, Oxford, UK. This article is an open access article distributed under the terms and
conditions of the Creative Commons Attribution (CC BY) license. Authors who
publish this series agree to the following terms:
1. Authors retain copyright and grant the series right of first publication with the work simultaneously licensed under a Creative Commons
Attribution License that allows others to share the work with an acknowledgment of the work's authorship and initial publication in this
series.
2. Authors are able to enter into separate, additional contractual arrangements for the non-exclusive distribution of the series's published
version of the work (e.g., post it to an institutional repository or publish it in a book), with an acknowledgment of its initial
publication in this series.
3. Authors are permitted and encouraged to post their work online (e.g., in institutional repositories or on their website) prior to and
during the submission process, as it can lead to productive exchanges, as well as earlier and greater citation of published work (See
Open access policy for details).
References
[1]. Iber, C., Ancoli-Israel, S., Chesson, A. L., & Quan, S. F. (2007). The AASM manual for the scoring of sleep and associated events: Rules, terminology and technical specifications. American Academy of Sleep Medicine.
[2]. Steriade, M. (2006). Grouping of brain rhythms in corticothalamic systems. Neuroscience, 137(4), 1087–1106.
[3]. Dankar, F. K., & El Emam, K. (2013). Practicing differential privacy in health care: A review. Transactions on Data Privacy, 6(1), 35–67.
[4]. Phan, H., Andreotti, F., Cooray, N., Chén, O. Y., & De Vos, M. (2019). SeqSleepNet: End-to-end hierarchical recurrent neural network for sequence-to-sequence automatic sleep staging. IEEE Transactions on Neural Systems and Rehabilitation Engineering, 27(3), 400–410.
[5]. Hassan, A. R., & Bhuiyan, M. I. H. (2016). Automatic sleep stage classification using single-channel EEG: Feature extraction, selection and classification. Computer Methods and Programs in Biomedicine, 140, 165–175.
[6]. Khalighi, S., Sousa, T., Pires, G., & Nunes, U. (2013). Automatic sleep staging: A computer assisted approach for optimal combination of features and polysomnographic channels. Expert Systems with Applications, 40(17), 7046–7059.
[7]. Rechtschaffen, A., & Kales, A. (1968). A manual of standardized terminology, techniques and scoring system for sleep stages of human subjects. U.S. National Institutes of Health.
[8]. Supratak, A., Dong, H., Wu, C., & Guo, Y. (2017). DeepSleepNet: A model for automatic sleep stage scoring based on raw single-channel EEG. IEEE Transactions on Neural Systems and Rehabilitation Engineering, 25(11), 1998–2008.
[9]. Mousavi, S. R., Afghah, F., & Rios-Gutierrez, F. (2019). Time-frequency analysis of EEG signals for automatic sleep stage classification using short-time Fourier transform and neural networks. 2019 IEEE EMBS International Conference on Biomedical & Health Informatics (BHI), 1-4.
[10]. Alickovic, E., Kevric, J., & Subasi, A. (2018). Performance evaluation of empirical mode decomposition, discrete wavelet transform, and wavelet packet decomposition for automated epileptic seizure detection and prediction. Journal of Neuroscience Methods, 261, 29–37.
[11]. Aboalayon, K. A. I., Faezipour, M., Almuhammadi, W. S., & Moslehpour, S. (2016). Sleep stage classification using EEG signal analysis: A comprehensive survey and new investigation. Entropy, 18(9), 272.
[12]. Yildirim, O., Baloglu, U. B., & Acharya, U. R. (2019). A deep learning model for automated sleep stages classification using PSG signals. International Journal of Environmental Research and Public Health, 16(4), 599.
[13]. Li, K., Zheng, C., & Tao, D. (2021). Interpretable EEG classification for sleep stage analysis via attention-based CNN. Information Sciences, 580, 387–399.
[14]. Sharma, M., Acharya, U. R., & Garaniya, N. (2018). Automated sleep stage scoring using deep neural networks: Study on complex healthy participants. Journal of Medical Systems, 42(5), 88
[15]. Morokuma, S., Hayashi, T., Kanegae, M., Mizukami, Y., Asano, S., Kimura, I., Tateizumi, Y., Ueno, H., Ikeda, S., & Niizeki, K. (2023). Deep learning-based sleep stage classification with cardiorespiratory and body movement activities in individuals with suspected sleep disorders. Scientific Reports, 13, 17730.
[16]. Seo, H., Back, S., Lee, S., Park, D., Kim, T., & Lee, K. (2020). IITNet: Intro- and inter-epoch temporal context network for automatic sleep scoring on raw single-channel EEG. Biomedical Signal Processing and Control, 61, 102036.
[17]. Michalak, P., & Kotas, M. (2022). Lightweight EEG-based deep learning system for real-time sleep stage classification. Biomedical Signal Processing and Control, 71, 102795.
[18]. Yeh, P.-L., Ozgoren, M., Chen, H.-L., Chiang, Y.-H., Lee, J.-L., Chiang, Y.-C., & Chiang, R. P.-Y. (2024). Automatic wake and deep-sleep stage classification based on Wigner–Ville distribution using a single electroencephalogram signal. Diagnostics, 14(6), 580.
[19]. Michielli, N., Acharya, U. R., & Molinari, F. (2019). Cascaded LSTM recurrent neural network for automated sleep stage classification using single-channel EEG signals. Computers in Biology and Medicine, 106, 71–81.
[20]. Jirakittayakorn, N., Wongsawat, Y., & Mitrirattanakul, S. (2024). ZleepAnlystNet: A novel deep learning model for automatic sleep stage scoring based on single-channel raw EEG data using separating training. Scientific Reports, 14, 9859.


