


1. Introduction
Confusion is an emotion associated with knowledge that usually arises in a learning environment. According to Mandler's interruption theory, when new information conflicts with an individual's existing knowledge, or the existing knowledge structure cannot absorb the new information, cognitive imbalance will occur, which will lead to confusion [1]. It was further pointed out that confusion is the emotional manifestation of cognitive imbalance [2]. Confusion is often triggered by inconsistent or novel complex information, and if this incongruity cannot be resolved, confusion can turn into frustration [3]. Persistent confusion can lead to reduced use of deep learning strategies and planning strategies, lower student self-efficacy, and even lower academic performance and disengagement from learning [4, 5]. However, a moderate amount of confusion can also promote deep learning, especially if the student has a high level of cognitive ability and motivation [6]. The resolution of the confusion, whether complete or partial, can improve learning outcomes [7, 8]. The resolution of the confusion does not mean directly addressing the confusion itself, but rather addressing the cognitive imbalance that causes the confusion [9]. Learners are required to have certain knowledge and skills, or to solve confusion through external scaffolding (such as instructional support) [10, 11].
Electroencephalogram (EEG) signals are reflections of neural activity in the brain and can be measured on the surface of the scalp [12]. Rhythmic fluctuations in brain waves occur within specific frequency bands, and the level of activity in each band correlates with different states of the brain, such as attention, mood, etc [5, 6]. Brain waves are generated by the electrical activity of millions of neurons in the brain, which are connected to each other through synapses to form neural networks [13]. When neurons are active, electrical currents are generated locally, forming brain waves [14]. Brain waves can be used to analyze human emotions and cognitive states [15]. Different brain wave bands, such as theta, alpha, beta, and gamma waves, are associated with different cognitive tasks and emotional states. For example, activation of the prefrontal and parietal regions is strongly associated with understanding, thinking, and rational discrimination [16]. EEG has been widely used in cognitive science research to measure cognitive functions such as alertness, mental fatigue, stress, attention, mental workload, and emotional state [17]. EEG is more acceptable than functional magnetic resonance imaging (fMRI) in certain populations such as children and sensory-sensitive individuals. In recent years, researchers have used EEG data to explore the neural mechanisms of cognitive modeling, memory recall, and mental computation. For example, Cheng et al. used EEG data to assess the cognitive state of construction workers, and Valentim et al. investigated changes in EEG signals during arithmetic subtraction tasks [18, 19].
In the present study, brainwave activity of students while they watched a MOOC video recorded with a single-channel EEG device, the NeuroSky MindSet, were analyzed, and machine learning algorithms were used to distinguish whether the students were in a confused state. The experimental results showed that EEG signals can be used to distinguish students' confused states. It was also found that gamma and beta bands played an important role in the confusion, further supporting the physiological basis for EEG signals to reflect confusion.
2. Materials and methods
2.1. Data and features
The data analyzed in the current study are retrieved from a public data source [20]. There are 12811 rows and 12 columns (namely Attention, Meditation, Raw, Delta, Theta, Alpha1, Alpha2, Beta1, Beta2, Gamma1, Gamma2, user-definedlabel) in the data set. There are 10 subjects. Each person watched the same 10 videos. Each row represents the brain waves of subjects when they were watching the videos.
2.2. Machine learning modeling
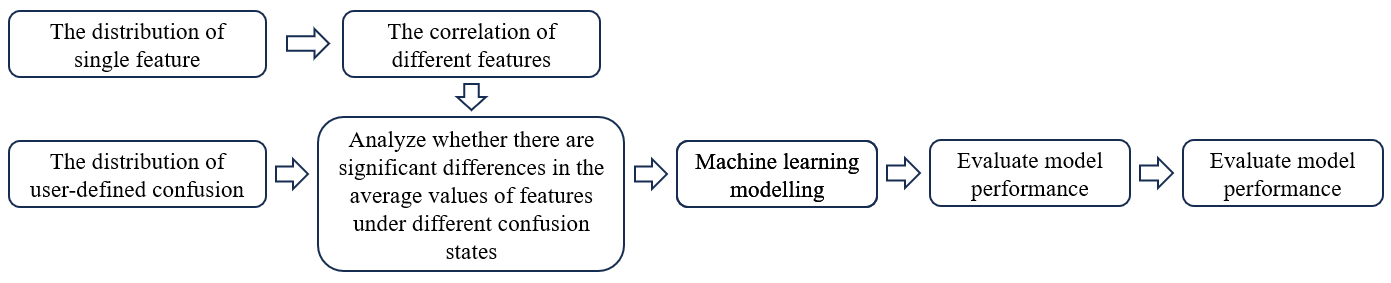
Exploratory data analysis and machine learning modeling were carried out as shown in Figure 1. Random Forest, XGBoost, and CatBoost models were used to model the confusion state (user-definedlabel) using brain oscillations as features. Pandas, NumPy, and Scipy were used for data processing and profiling. Seaborn and matplotlib were used for data visualization. Sklearn and PyCaret were used to implement the models.
2.3. Confusion matrix
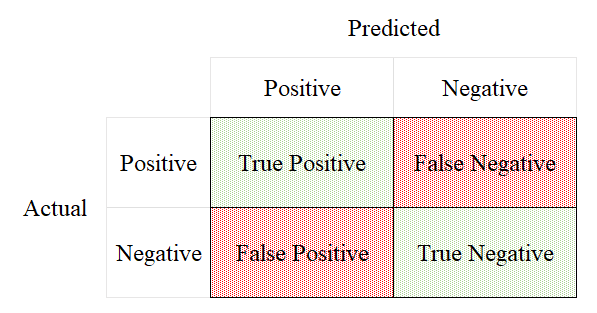
When the actual situation is positive, if the prediction is positive correctly, the prediction is defined as True Positive (TP), and if the prediction is negative, it is called False Positive (FP). When the actual situation is negative, if the prediction is negative correctly, the prediction is defined as True Negative (FN), and if the prediction is positive, it is called False Negative (TN) (Figure 2).
Various performance metrics of the classification model were also calculated.
Accuracy is defined as the ratio of correctly classified instances (true positive and true negative) to the total number of instances in the confusion matrix.
Precision is the ratio of true positives to all samples (the sum of predicted positives in the column) that are predicted to be positive.
Recall is the ratio of true positives to the total number of all actual positives (the sum of the rows of true positives).
The F1 score is a harmonic average of accuracy and recall, and when the data categories are uneven, the F1 score is more meaningful than the accuracy.
2.4. Receiver operating characteristic ROC curve
The x axis of the ROC curve is False Positive Rate (FPR), the proportion that is actually negative but incorrectly predicted to be positive, calculated as follows:
Its y axis is True Positive Rate (TPR), the proportion that is actually positive and correctly predicted to be positive, calculated by the formula:
By adjusting the classification threshold, TPR and FPR under different thresholds are calculated, and these points are connected to form the ROC curve.
Area under Curve (AUC) represents the area under the ROC curve, and its value ranges from 0 to 1. When AUC = 0.5, it indicates that the classification ability of the model is equivalent to random guessing. The closer the AUC value is to 1, the better the overall performance of the model.
3. Results
The number of different genders were 8 males and 2 females, and the number of different ethnicities were 8 Han Chinese and 1 English and 1 Bengali.
The distribution of Attention strength scores had a mean and standard deviation of 41.31±23.15 and a range of [1.00, 100.00] (Figure 3A). The distribution of Meditation strength scores had a mean and standard deviation of 47.18±22.66 and a range of [1.00, 100.00] (Figure 3B).
A B
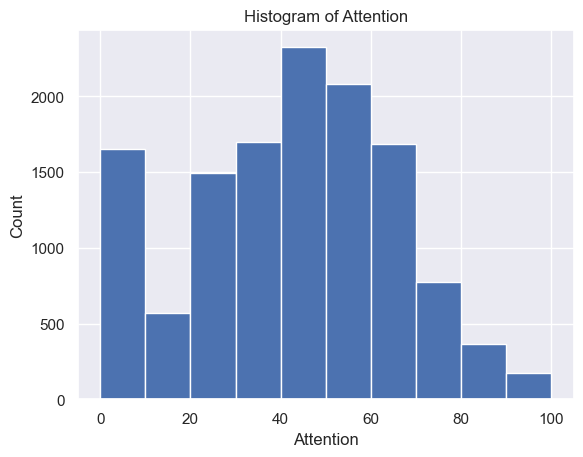
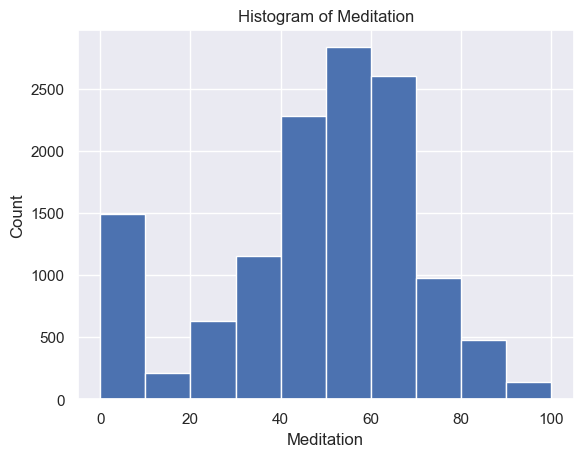
Figure 3. (A) Histogram of Attention (min = 0; max = 100; median = 43). (B) Histogram of Meditation (min = 0; max = 100; median = 51)
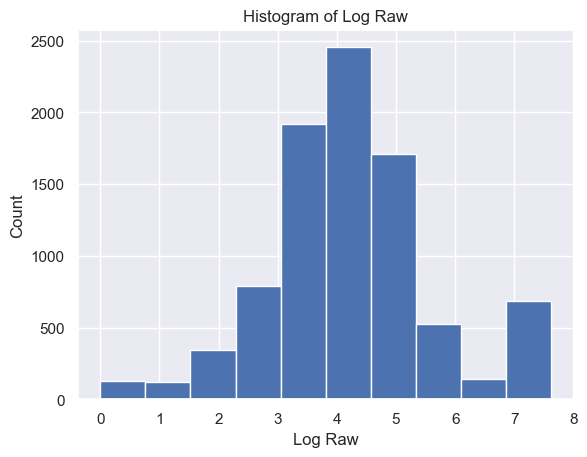
The distribution of Raw strength scores had a mean and standard deviation of 65.57±597.92 and a range of [-2048, 2047] (Figure 4)
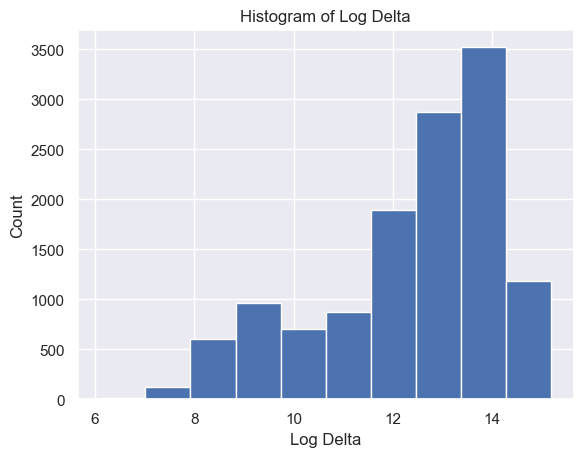
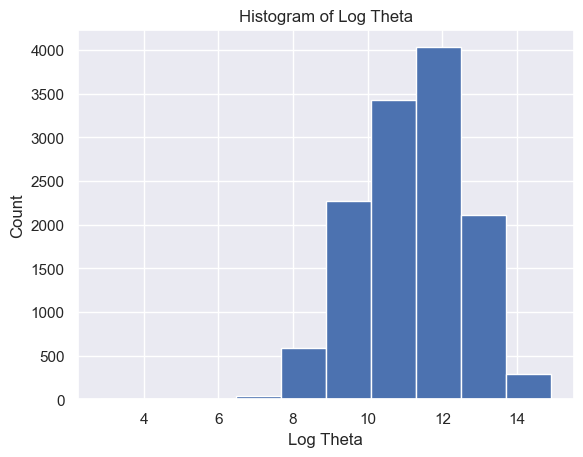
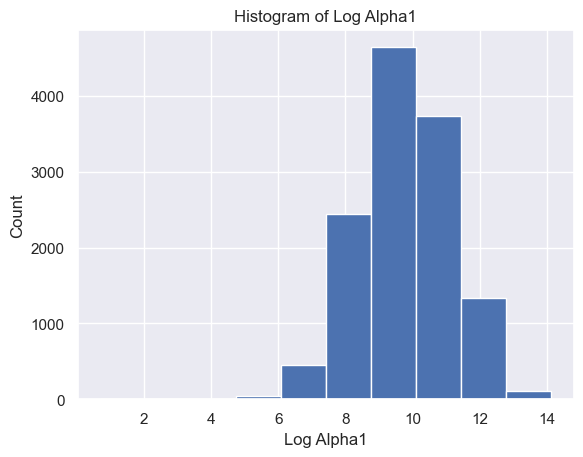
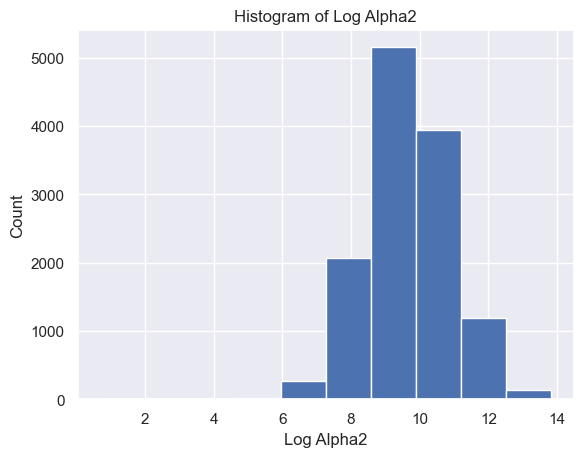
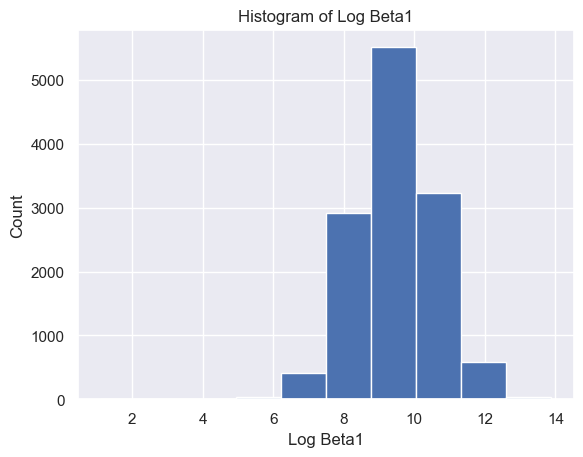
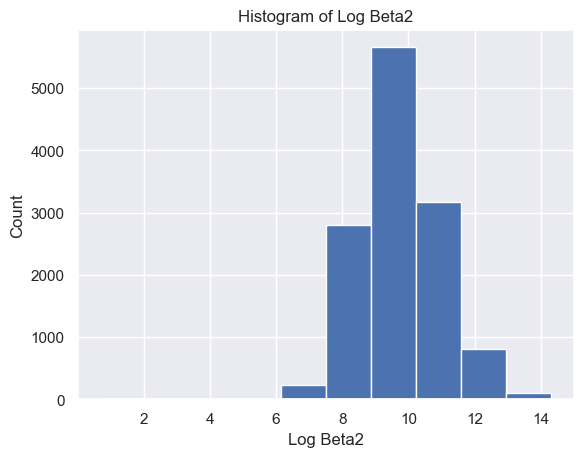
The distribution of Delta strength scores had a mean and standard deviation of mean ± std = 605785.26±637623.56 and a range of [448, 3969663] (Figure 5A). The distribution of Theta strength scores had a mean ± std = 168052.60±244134.57 and a range of [17, 3007802] (Figure 5B). The distribution of Alpha1 strength scores had a mean ± std = 41384.35±72430.82 and a range of [2, 1369955] (Figure 5C). The distribution of Alpha2 strength scores had a mean ± std = 33183.39±58314.10 and a range of [2, 1016913] (Figure 5D). The distribution of Beta1 strength scores had a mean ± std = 24318.37±38379.68 and a range of [3, 1067778] (Figure 5E). The distribution of Beta2 strength scores had a mean ± std = 38144.33±79066.06 and a range of [2, 1645369] (Figure 5F). The distribution of Gamma1 strength scores had a mean ± std = 29592.55±79826.37 and a range of [1, 1972506] (Figure 5G). The distribution of Gamma2 strength scores had a mean ± std = 14415.97±36035.23 and a range of [2, 1348117] (Figure 5H).
A B
C D
E F
G H
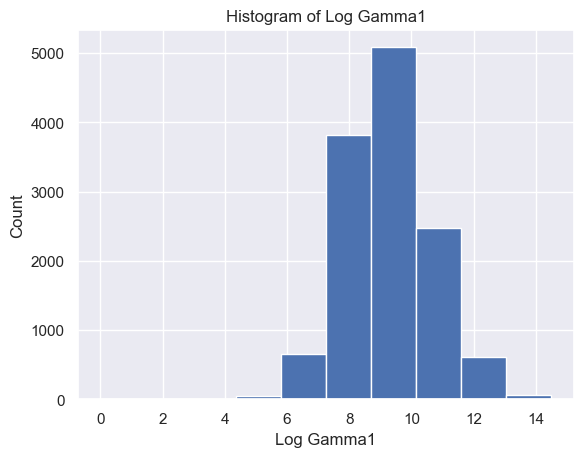
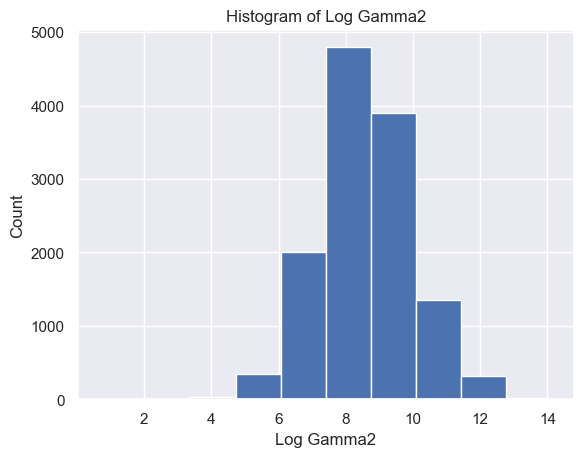
Figure 5. Histogram of specific brain waves
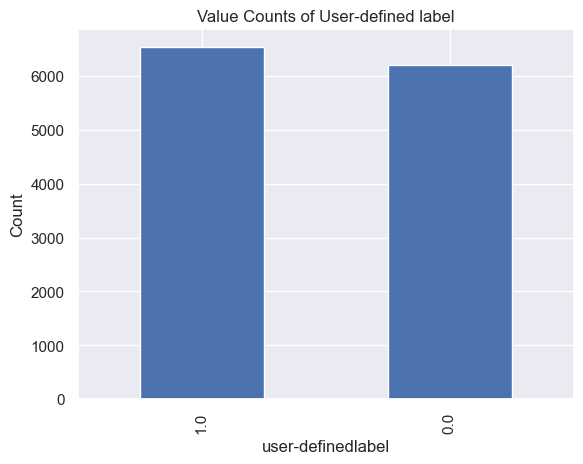
It was found that subjects felt confused at 6567 moments, and subjects did not feel confused at 6244 moments. (Figure 6).
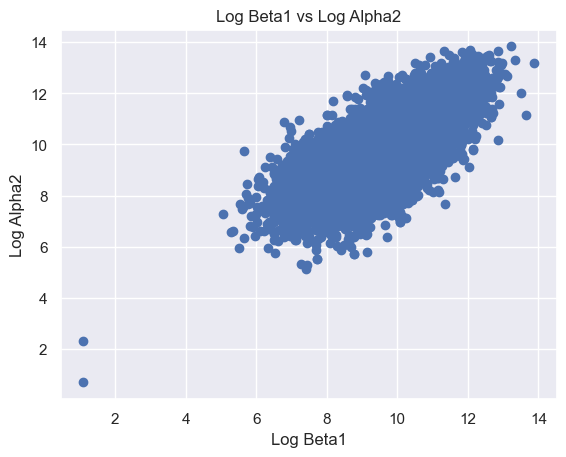
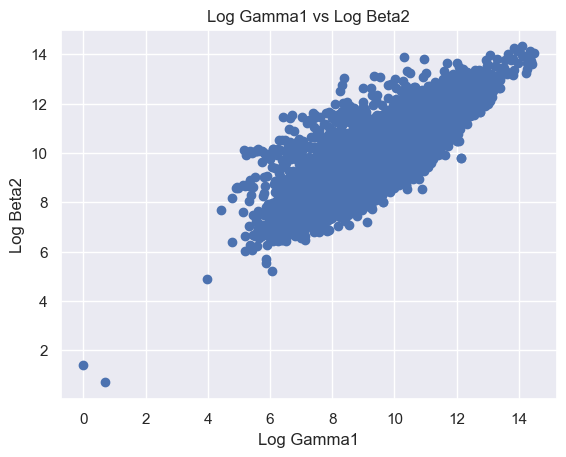
The correlation coefficients between numeric features were calculated , with Beta1 and Alpha2, Gamma1 and Beta2, Gamma2 and Beta2, Gamma1 and Gamma2 strongly correlated (Figure 7–8).
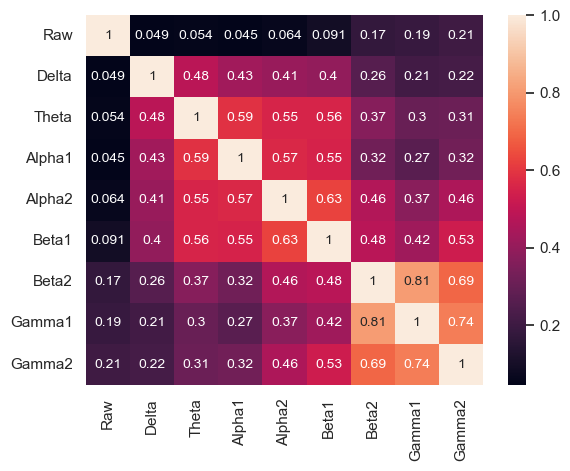
The following features are grouped in pairs and are strongly and positively correlated with each other. Log Beta1 and log Alpha2 (r = 0.63) (Figure 8A). Log Gamma1 and log Beta2 (r = 0.81) (Figure 8B). Log Gamma2 and log Beta2 (r = 0.69) (Figure 8C). Log Gamma1 and Gamma2 (r = 0.74) (Figure 8D).
A B
C D
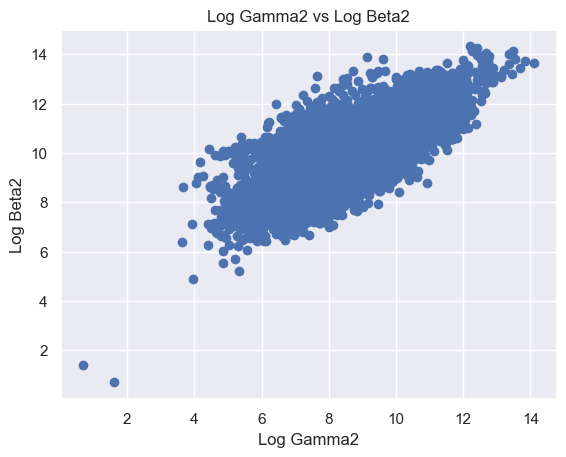
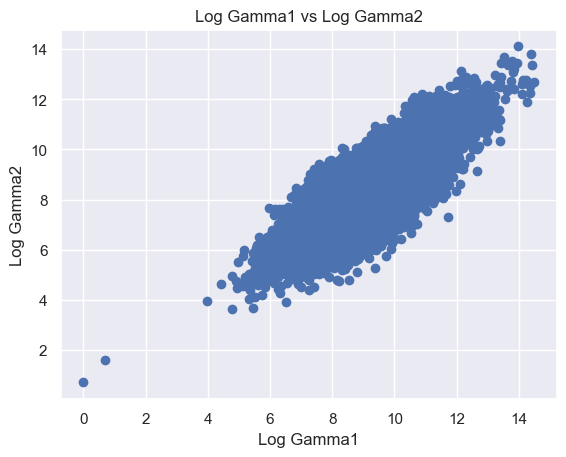
Figure 8. Scatter plot of logged features. (A) Log Beta1 against log Alpha2. (B) Log Gamma1 against log Beta2. (C) Log Gamma2 against log Beta2. (D) Log Gamma1 against log Gamma2
The mean meditation scores of the confusing group are statistically and significantly different from those of the not confusing group (Raw0: n = 6243, mean ± std = 66.47±627.19, Raw1: n = 6567, mean ± std = 64.72±568.74, stats = 0.17, p = 8.68×10⁻¹, paired t-test) (Figure 9).
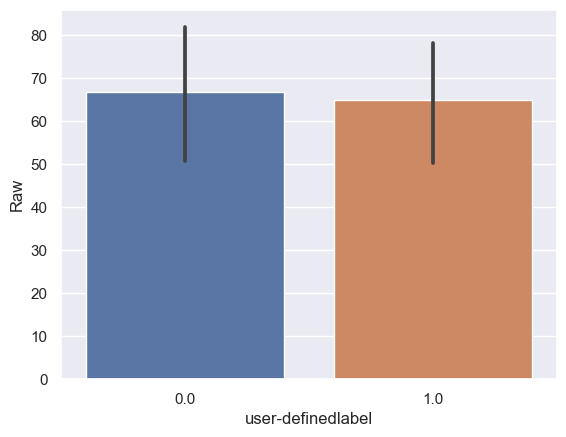
The mean meditation scores of the confusing group are statistically and significantly different from those of the not confusing group.
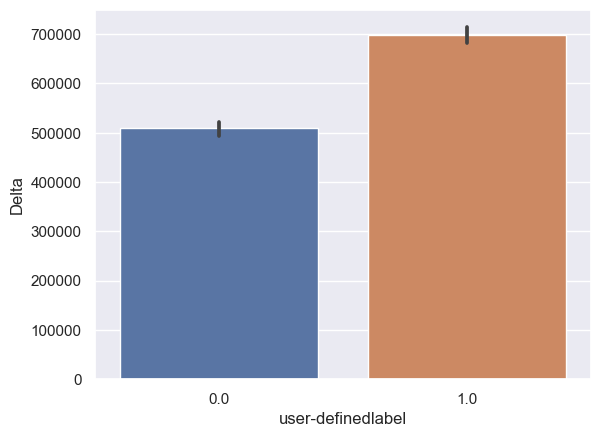
Delta: Delta_0: n = 6243, mean ± std = 5.08×10⁵±5.95×10⁵, Delta_1: n = 6567, mean ± std = 6.98×10⁵±6.62×10⁵, statistics = -17.01, p = 3.77×10-64(Figure 10A).
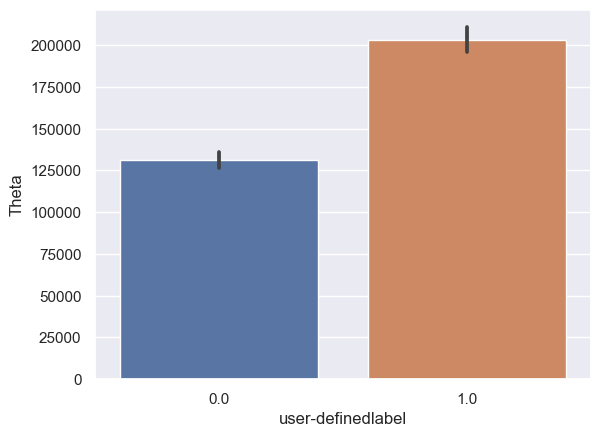
Theta: Theta_0: n = 6243, mean ± std = 1.31×10⁵±1.94×10⁵, Theta_1: n = 6567, mean ± std = 2.03×10⁵±2.78×10⁵, statistics = -16.88, p = 2.80×10-63 (Figure 10B).
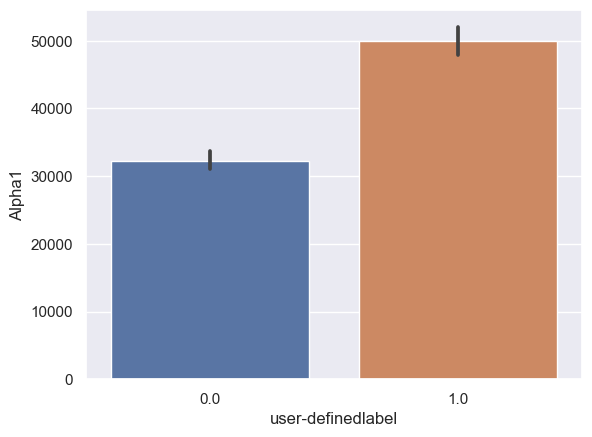
Alpha1: Alpha1_0: n = 6243, mean ± std = 3.23×10⁴±5.60×10⁴, Alpha1_1: n = 6567, mean ± std = 4.99×10⁴±8.42×10⁴, statistics = -13.88, p = 1.77×10-43 (Figure 10C).
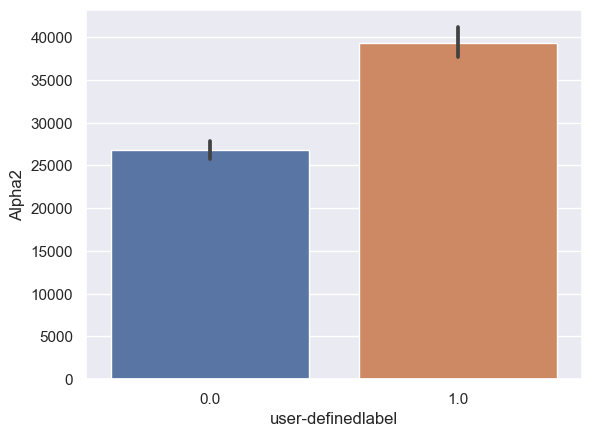
Alpha2: Alpha2_0: n = 6243, mean ± std = 2.67×10⁴±4.32×10⁴, Alpha2_1: n = 6567, mean ± std = 3.92×10⁴±6.91×10⁴, statistics = -12.21, p = 4.39×10⁻³⁴ (Figure 10D).
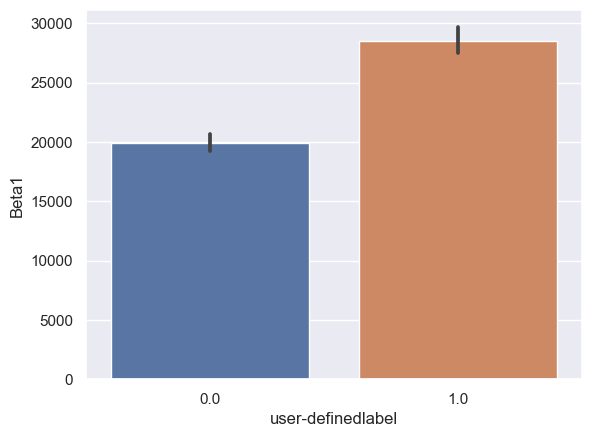
Beta1: Beta1_0: n = 6243, mean ± std = 1.99×10⁴±3.03×10⁴, Beta1_1: n = 6567, mean ± std = 2.84×10⁴±4.43×10⁴, statistics = -12.70, p = 1.03×10-36 (Figure 10E).
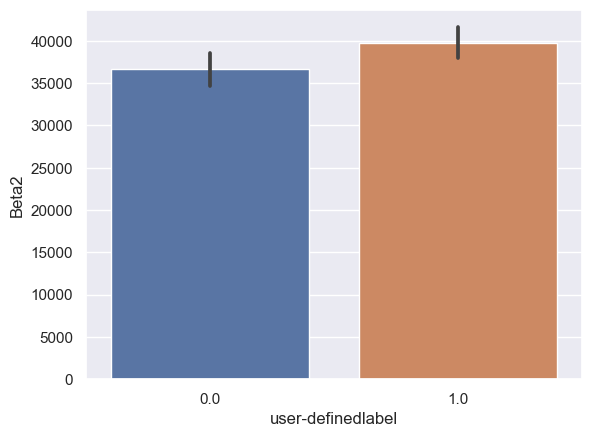
Beta2: Beta2_0: n = 6243, mean ± std = 3.65×10⁴±8.10×10⁴, Beta2_1: n = 6567, mean ± std = 3.96×10⁴±7.71×10⁴, statistics = -2.21, p = 2.69×10⁻² (Figure 10F).
Gamma1: Gamma1_0: n = 6243, mean ± std = 2.86×10⁴±8.65×10⁴, Gamma1_1: n = 6567, mean ± std = 3.04×10⁴±7.28×10⁴, statistics = -1.28, p = 2.00×10⁻¹ (Figure 10G).
Gamma2: Gamma2_0: n = 6243, mean ± std = 1.24×10⁴±3.39×10⁴, Gamma2_1: n = 6567, mean ± std = 1.62×10⁴±3.77×10⁴, statistics = -6.07, p = 1.34×10⁻⁹ (Figure 10H).
A B
C D
E F
G H
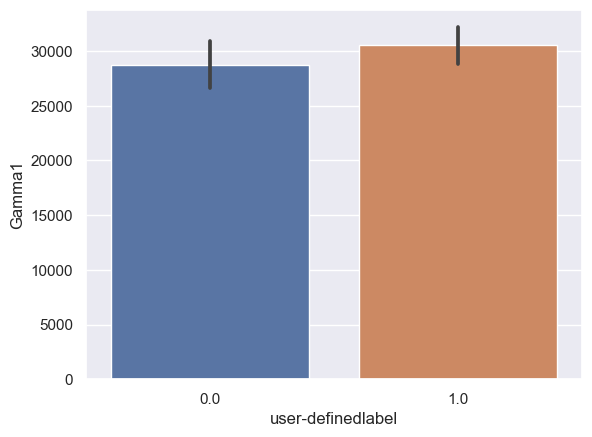
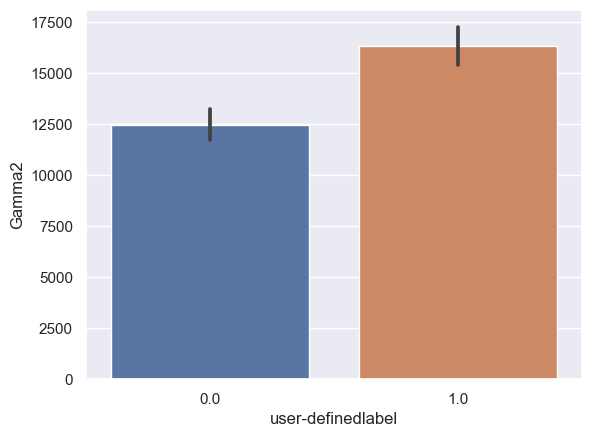
Figure 10. Bar plot of mean brain wave feature values in confused and non-confused groups with paired t-test. Error bar = standard error of mean. (A) Delta; ***, p < 0.001. (B) Theta; ***, p < 0.001. (C) Alpha1; ***, p < 0.001. (D) Alpha2; ***, p < 0.001. (E)Beta1; ***, p < 0.001. (F) Beta2; *, 0.01<p<0.05. (G) Gamma1; NS = not significant. (H) ; ***, p < 0.001
4. Machine learning modeling
Three machine learning models, namely Random Forest, CatBoost and XGBoost were used to model the confusion state using brain oscillation features. It was found that the Random Forest model showed the best performance in classification (AUC = 0.6741), followed by CatBoost (AUC = 0.6726) and XGBoost (AUC = 0.6465) (Table 1). Considering all metrics including AUC, accuracy, recall, precision and F1, CatBoost showed the best performance, followed by Random Forest and XGBoost (Table 2).
|
AUC |
Accuracy |
Recall |
Precision |
F1 |
|
|
Random Forest |
0.6741 |
0.6198 |
0.6413 |
0.6263 |
0.6335 |
|
CatBoost |
0.6726 |
0.6233 |
0.6550 |
0.6270 |
0.6406 |
|
XGBoost |
0.6465 |
0.5985 |
0.6197 |
0.6061 |
0.6127 |
|
AUC Rank |
Accuracy Rank |
Recall Rank |
Precision Rank |
F1 Rank |
Average Rank |
Overall Rank |
|
|
CatBoost |
2 |
1 |
1 |
1 |
1 |
1.2 |
1 |
|
Random Forest |
1 |
2 |
2 |
2 |
2 |
1.8 |
2 |
|
XGBoost |
3 |
3 |
3 |
3 |
3 |
3 |
3 |
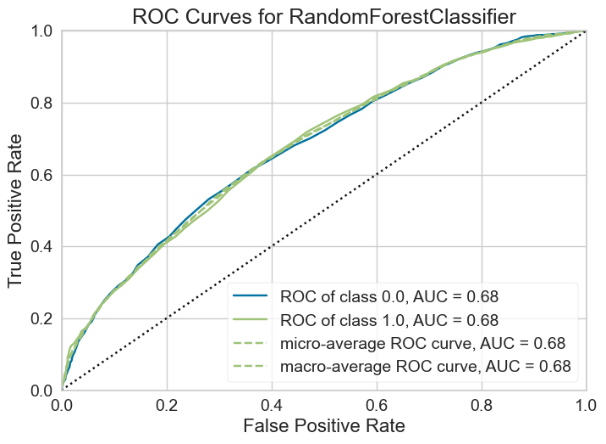
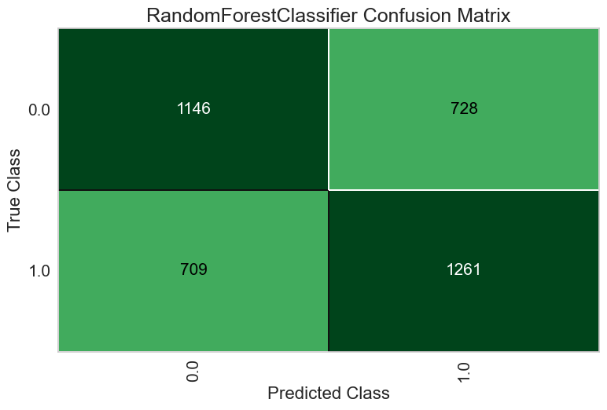
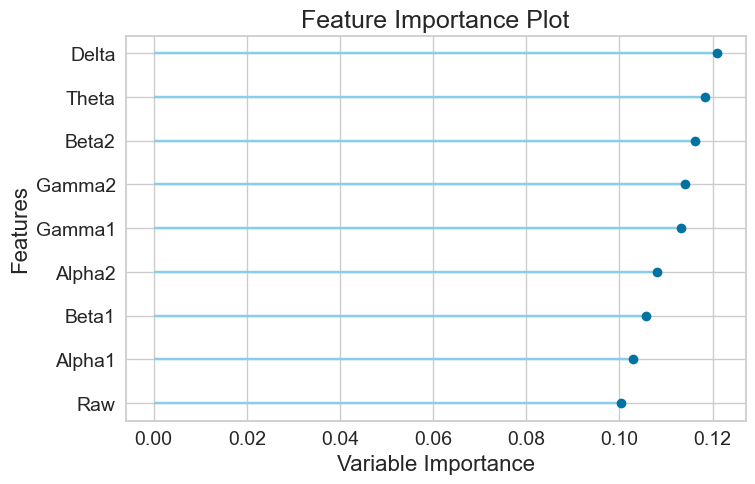
For the Random Forest model, the AUC-ROC is 0.6741 (Figure 11A). Number of TP, TN, FP, and FN are 1261, 1146, 728, and 709, respectively (Figure 11B). The top three most important features are Delta (0.1210), Theta (0.1184), and Beta2 (0.1162) (Figure 11C).
A B
C
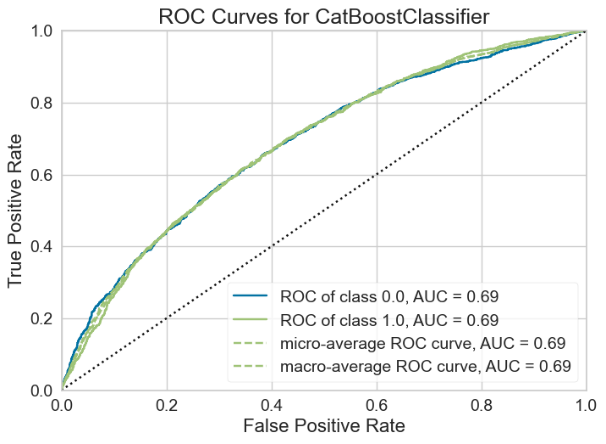
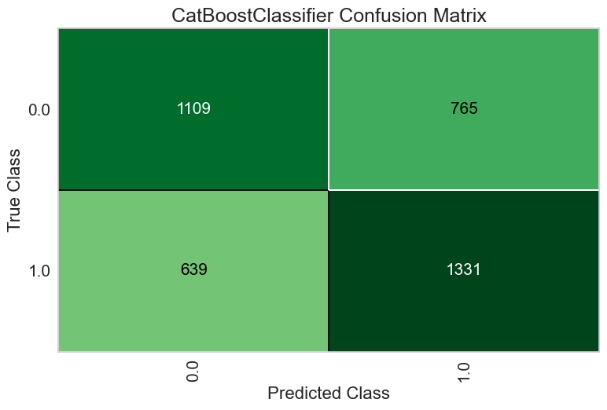
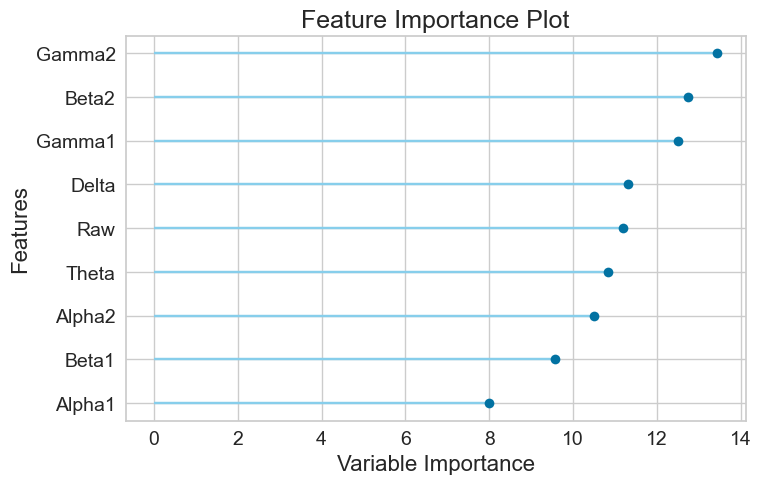
For the Random Forest model, the AUC-ROC is 0.6726 (Figure 12A). Number of TP, TN, FP, and FN are 1331, 1109, 765, and 639, respectively (Figure 12B). The top three most important features are Gamma2 (0.1343), Beta2 (0.1274), and Gamma1 (0.1248) (Figure 12C).
A B
C
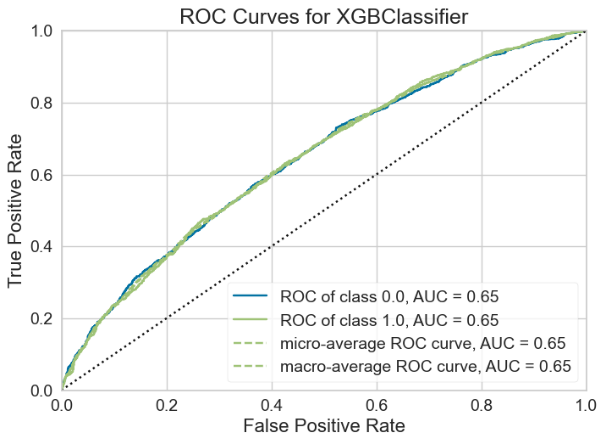
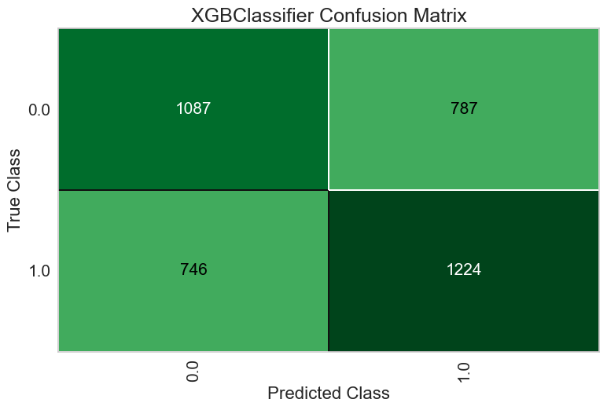
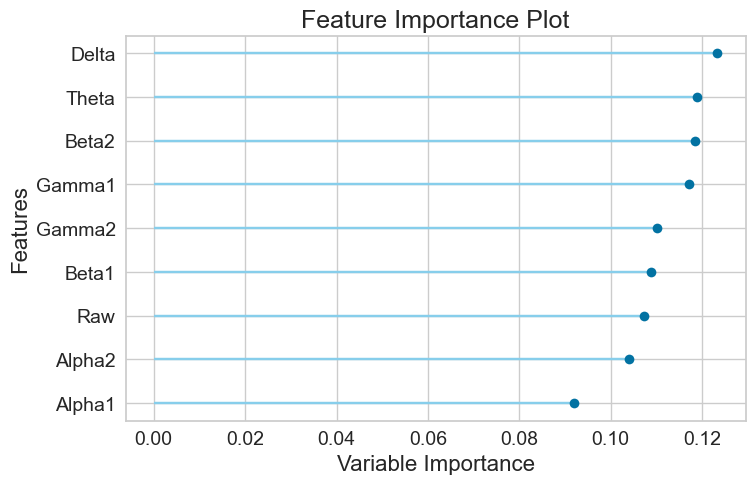
For the Random Forest model, the AUC-ROC is 0.6465 (Figure 13A). Number of TP, TN, FP, and FN are 1224, 1087, 787, and 746, respectively (Figure 13B). The top three most important features are Delta (0.1233), Theta (0.1188), and Beta2 (0.1185) (Figure 13C).
A B
C
Feature importance values and ranks of the three models were summarized as below (Table 3).
|
Random Forest |
CatBoost |
XGBoost |
|
|
Raw |
0.1003 |
0.1118 |
0.1072 |
|
Alpha1 |
0.1028 |
0.0799 |
0.0921 |
|
Alpha2 |
0.1081 |
0.1049 |
0.1040 |
|
Beta1 |
0.1058 |
0.0956 |
0.1087 |
|
Beta2 |
0.1162 |
0.1274 |
0.1185 |
|
Delta |
0.1210 |
0.1130 |
0.1233 |
|
Theta |
0.1184 |
0.1082 |
0.1188 |
|
Gamma1 |
0.1132 |
0.1249 |
0.1172 |
|
Gamma2 |
0.1141 |
0.1344 |
0.1101 |
Finally, it was found that Beta2, Gamma2 and Delta are the overall top three most important features (Table 4).
|
Average Importance |
Rank |
|
|
Beta2 |
0.1207 |
1 |
|
Gamma2 |
0.1195 |
2 |
|
Delta |
0.1191 |
3 |
|
Gamma1 |
0.1184 |
4 |
|
Theta |
0.1151 |
5 |
|
Raw |
0.1065 |
6 |
|
Alpha2 |
0.1056 |
7 |
|
Beta1 |
0.1034 |
8 |
|
Alpha1 |
0.0916 |
9 |
5. Discussion
In the study, we analyzed the relationship between different brain waves and the state of confusion using machine learning models, including Random Forest, CatBoost and XGBoost. The performance of the models was evaluated through confusion matrices and ROC curves (including AUC values, TPR, FPR, etc.). It was found that most brain waves (such as Beta2, Gamma2, etc.) were significantly correlated with the judgment results. In the model comparison, CatBoost performed the best, with its important features including Gamma2 and Beta2, Delta, etc. Overall, brain wave characteristics can effectively predict the state of confusion, and CatBoost is the best prediction model.
5.1. Beta2
Beta waves (especially beta 2 oscillations, 23–30 Hz) are strongly associated with higher-order cognitive functions, including conscious thinking, logical reasoning, attention, and problem solving [21]. Studies have shown that Beta2 oscillations specifically modulate hippocampal neuron activity and are dependent on NMDA receptor delivery [22], that energy levels are positively correlated with the number of new objects in the environment, and that drug blocking memory consolidation enhances Beta2 activity [23]. In addition, beta2 oscillation in the basal forebrain has also been found to be associated with associative learning in rats [24], suggesting that it may play a key role in novelty detection and memory encoding as a "learning initiating signal" across brain regions.
In the current study, beta2 waves have the highest average importance of the three models, which is obtained by the model's algorithm. However, its ability to distinguish whether the subject was confused was not very good, and its P-value showed that it was statistically significant for confusion, but not particularly significant compared to other brain waves. However, in deep learn-based doubt detection (such as 1D CNN), Beta2 waves are often an important input feature to help distinguish between "confused" and "non-confused" states, with classification accuracy up to 99% [25]. This discrepancy may be caused by insufficient experimental data.
5.2. Gamma2
In the current study, the gamma2 wave (>20Hz) has the second highest importance, which is also demonstrated by past research, and is primarily a key neural oscillation responsible for cognitive function, learning, memory, information processing, and consciousness maintenance [25]. Studies have shown that gamma waves are significantly reduced in patients with delirium (confusion) [26, 27], which is related to its cognitive dysfunction. Abnormalities were observed in the direction of neural network connections in patients with consciousness disorders, particularly in brain regions involved in attention, working memory, and executive function, although a statistically significant difference in gamma was not found [28, 29]. These findings suggest that gamma wave activity is not only a marker of cognitive function, but may also be a potential biological indicator of disorders of consciousness, such as disorders of consciousness.
In this study, gamma2 waves showed significant differences in confusion states. This may be because when subjects were confused, they had similar brain waves to patients with mental disorders, which was also an aspect of distinguishing whether subjects could understand the video content.
5.3. Delta
Finally, past researchers have demonstrated that delta waves (1–3Hz) have been involved in sensory rejuvenation, boosting the immune system, natural healing, and restorative/deep sleep [29]. However, at present, no studies have clearly pointed out that delta waves are related to confusion or learning, but it is indeed a more important indicator in this study, and the difference in distinguishing confusion is very significant. Therefore, it is speculated that this correlation does not indicate causation between the two, but is the result of confusion about the content of the video and related physiological reactions, such as the possibility that the subject felt drowsy when watching content that was beyond comprehension.
5.4. Other brain waves
As for the remaining waves, the Gamma1 wave reflects the rapid information transmission and integration between different regions of the brain, and is often closely related to working memory operations [29]. It may be suppressed when dealing with information that is likely to cause confusion or contradiction. The Alpha wave is generally associated with deep relaxation and a calm state. Among them, Alpha1 is usually regarded as a mechanism that inhibits sensory input, helping people focus on internal information, while Alpha2 is more active than Alpha1, representing a slight arousal of attention and a transitional state of task preparation [30]. In this study, the model weight of the Alpha1 wave was the lowest, which is consistent with its physiological function. The Theta wave involves the enhancement of intuition, the stimulation of creativity, and the neural mechanisms of learning and memory [30]. The Beta1 wave mainly represents brain activity during the task initiation stage and is closely related to concentration and execution preparation [21].
|
Frequency (Hz) |
Related Physiological Status |
|
|
Delta |
0.5–4 |
Deep sleep, unconsciousness, brain repair [21, 31] |
|
Theta |
4–8 |
Relaxation, meditation, early sleep [30, 32] |
|
Alpha1 |
8–10 |
Basic relaxation and disengage the senses [30, 33] |
|
Alpha2 |
10–13 |
Relax with a little preparation and pay attention to internal adjustment [30, 33] |
|
Beta1 |
13–23 |
Pay attention and be prepared for the task [20, 34] |
|
Beta2 |
23–30 |
High alertness, stress, tension, anxiety, complex cognition [20, 22, 23] |
|
Gamma1 |
30–45 |
Perceptual integration, higher-order cognition [25, 27, 29] |
|
Gamma2 |
45–80 |
Consciousness integration, deep concentration, and memory activation [24, 25, 27, 29] |
6. Conclusions
In this study, we analyzed experiments on 10 subjects and various oscillation data, including delta, theta, alpha, beta and gamma oscillations. We analyzed the distribution of brain waves, and the connection between the examiner's judgment on whether the subjects were confused and different brain waves. We tested the performance of three models in predicting confusion state: CatBoost, Random Forest and XGBoost. There is also a correlation in the intensity among different brain waves, with Beta1 and Alpha2, Gamma1 and Beta2, Gamma2 and Beta2, Gamma1 and Gamma2 strongly correlated. Most brain waves (Delta, Theta, Alpha1, Alpha2, Beta1, Beta2, Gamma2) can significantly correspond to the examiner's judgment of whether the subjects were confused or not, while there is no significant difference in Gamma1.
Among these three models, Catboost performed the best based on the AUC-ROC curve, precision, recall and the F1 score, then the Random Forest and XGBoost in sequence. Among them, the three most important features in model CatBoost were Gamma2, Beta2 and Gamma1, namely 0.1343, 0.1274 and 0.1248. Among three models, taking the average of importance, the three most important features were Beta2, Gamma2, and Delta, namely 0.1207, 0.1195 and 0.1191. By analyzing the brainwave activities of students when they are confused, specific brainwave patterns can be identified, which is helpful for the future development of personalized learning assistance systems and real-time cognitive state monitoring tools.
References
[1]. Mandler, G. (1990). Interruption (discrepancy) theory: Review and extensions. On the move: The psychology of change and transition, 13, 32.
[2]. D'Mello, S., & Graesser, A. (2014). Confusion and its dynamics during device comprehension with breakdown scenarios. Acta psychologica, 151, 106–116.
[3]. D’Mello, S., Lehman, B., Pekrun, R., & Graesser, A. (2014). Confusion can be beneficial for learning. Learning and Instruction, 29, 153–170.
[4]. Lehman, B., D'Mello, S., & Graesser, A. (2012). Confusion and complex learning during interactions with computer learning environments. The Internet and Higher Education, 15(3), 184–194.
[5]. Pekrun, R., & Stephens, E. J. (2012). Academic emotions.
[6]. Silvia, P. J. (2010). Confusion and Interest: The Role of Knowledge Emotions in Aesthetic Experience. Psychology of Aesthetics, Creativity, and the Arts, 4(2), 75–80.
[7]. Muis, K. R., Psaradellis, C., Lajoie, S. P., Di Leo, I., & Chevrier, M. (2015). The role of epistemic emotions in mathematics problem solving. Contemporary Educational Psychology, 42, 172–185.
[8]. Yang, D., Kraut, R. E., & Rosé, C. P. (2016). Exploring the Effect of Student Confusion in Massive Open Online Courses. Journal of Educational Data Mining, 8(1), 52–83.
[9]. Chevrier, M., Muis, K. R., Trevors, G. J., Pekrun, R., & Sinatra, G. M. (2019). Exploring the antecedents and consequences of epistemic emotions. Learning and instruction, 63, 101209.
[10]. Di Leo, I. (2019). The role and sequencing of academic emotions during mathematics problem solving among elementary students. McGill University (Canada).
[11]. Poolman, P., Frank, R. M., Luu, P., Pederson, S. M., & Tucker, D. M. (2008). A single-trial analytic framework for EEG analysis and its application to target detection and classification. NeuroImage, 42(2), 787–798.
[12]. Seeck, M., Koessler, L., Bast, T., Leijten, F., Michel, C., Baumgartner, C., ... & Beniczky, S. (2017). The standardized EEG electrode array of the IFCN. Clinical neurophysiology, 128(10), 2070–2077.
[13]. Deco, G., Rolls, E. T., & Romo, R. (2009). Stochastic dynamics as a principle of brain function. Progress in neurobiology, 88(1), 1–16.
[14]. Steriade, M., & Llinás, R. R. (1988). The functional states of the thalamus and the associated neuronal interplay. Physiological reviews, 68(3), 649–742.
[15]. Ismail, W. W., Hanif, M., Mohamed, S. B., Hamzah, N., & Rizman, Z. I. (2016). Human emotion detection via brain waves study by using electroencephalogram (EEG). International Journal on Advanced Science, Engineering and Information Technology, 6(6), 1005–1011.
[16]. Stevens Jr, C. E., & Zabelina, D. L. (2019). Creativity comes in waves: an EEG-focused exploration of the creative brain. Current Opinion in Behavioral Sciences, 27, 154–162.
[17]. Wang, N., Zhang, L., & Liu, G. (2015). EEG-based research on brain functional networks in cognition. Bio-Medical Materials and Engineering, 26(s1), S1107–S1114.
[18]. Cheng, B., Fan, C., Fu, H., Huang, J., Chen, H., & Luo, X. (2022). Measuring and computing cognitive statuses of construction workers based on electroencephalogram: a critical review. IEEE Transactions on Computational Social Systems, 9(6), 1644–1659.
[19]. Valentim, C. A., Inacio Jr, C. M. C., & David, S. A. (2021). Fractal methods and power spectral density as means to explore EEG patterns in patients undertaking mental tasks. Fractal and Fractional, 5(4), 225.
[20]. Wang, H., Li, Y., Hu, X., Yang, Y., Meng, Z., & Chang, K. M. (2013, June). Using EEG to Improve Massive Open Online Courses Feedback Interaction. In AIED workshops.
[21]. Abhang, P. A., Gawali, B. W., & Mehrotra, S. C. (2016). Technical aspects of brain rhythms and speech parameters. Introduction to EEG-and speech-based emotion recognition, 1, 51–79.
[22]. Berke, J. D., Hetrick, V., Breck, J., & Greene, R. W. (2008). Transient 23–30 Hz oscillations in mouse hippocampus during exploration of novel environments. Hippocampus, 18(5), 519–529.
[23]. Grossberg, S. (2008). Beta oscillations and hippocampal place cell learning during exploration of novel environments. Boston University Center for Adaptive Systems and Department of Cognitive and Neural Systems.
[24]. Quinn, L. K., Nitz, D. A., & Chiba, A. A. (2010). Learning‐dependent dynamics of beta‐frequency oscillations in the basal forebrain of rats. European Journal of Neuroscience, 32(9), 1507–1515.
[25]. Sahu, R., Dash, S. R., & Baral, A. (2024). Identification of Students’ Confusion in Classes from EEG Signals using Convolution Neural Network. Informatica, 48(1).
[26]. Hunter, A., Crouch, B., Webster, N., & Platt, B. (2020). Delirium screening in the intensive care unit using emerging QEEG techniques: A pilot study. AIMS neuroscience, 7(1), 1.
[27]. Tanabe, S., Mohanty, R., Lindroth, H., Casey, C., Ballweg, T., Farahbakhsh, Z., ... & Sanders, R. D. (2020). Cohort study into the neural correlates of postoperative delirium: the role of connectivity and slow-wave activity. British journal of anaesthesia, 125(1), 55–66.
[28]. Fleischmann, A., Pilge, S., Kiel, T., Kratzer, S., Schneider, G., & Kreuzer, M. (2018). Substance-specific differences in human electroencephalographic burst suppression patterns. Frontiers in human neuroscience, 12, 368.
[29]. Fleischmann, R., Traenkner, S., Kraft, A., Schmidt, S., Schreiber, S. J., & Brandt, S. A. (2019). Delirium is associated with frequency band specific dysconnectivity in intrinsic connectivity networks: preliminary evidence from a large retrospective pilot case-control study. Pilot and feasibility studies, 5, 1–13.
[30]. Park, K. S., Choi, H., Lee, K. J., Lee, J. Y., An, K. O., & Kim, E. J. (2011). Patterns of electroencephalography (EEG) change against stress through noise and memorization test. International Journal of Medicine and Medical Sciences, 3(14), 381-389.
[31]. Detari, L., & Vanderwolf, C. H. (1987). Activity of identified cortically projecting and other basal forebrain neurones during large slow waves and cortical activation in anaesthetized rats. Brain research, 437(1), 1-8.
[32]. Lopes da Silva, F. H., Witter, M. P., Boeijinga, P. H., & Lohman, A. H. (1990). Anatomic organization and physiology of the limbic cortex. Physiological reviews, 70(2), 453-511.
[33]. Adrian, E. D., & Matthews, B. H. (1934). The Berger rhythm: potential changes from the occipital lobes in man. Brain, 57(4), 355-385.
[34]. Stancák, A., Pfeffer, D., Hrudová, L., Sovka, P., & Dostálek, C. (1993). Electroencephalographic correlates of paced breathing. Neuroreport, 4(6), 723-726.
Cite this article
Pan,T. (2025). Identification of Neural Correlates of Confusion during Online Learning Using Electrophysiological Recordings and Machine Learning Modeling. Theoretical and Natural Science,126,91-108.
Data availability
The datasets used and/or analyzed during the current study will be available from the authors upon reasonable request.
Disclaimer/Publisher's Note
The statements, opinions and data contained in all publications are solely those of the individual author(s) and contributor(s) and not of EWA Publishing and/or the editor(s). EWA Publishing and/or the editor(s) disclaim responsibility for any injury to people or property resulting from any ideas, methods, instructions or products referred to in the content.
About volume
Volume title: Proceedings of ICBioMed 2025 Symposium: AI for Healthcare: Advanced Medical Data Analytics and Smart Rehabilitation
© 2024 by the author(s). Licensee EWA Publishing, Oxford, UK. This article is an open access article distributed under the terms and
conditions of the Creative Commons Attribution (CC BY) license. Authors who
publish this series agree to the following terms:
1. Authors retain copyright and grant the series right of first publication with the work simultaneously licensed under a Creative Commons
Attribution License that allows others to share the work with an acknowledgment of the work's authorship and initial publication in this
series.
2. Authors are able to enter into separate, additional contractual arrangements for the non-exclusive distribution of the series's published
version of the work (e.g., post it to an institutional repository or publish it in a book), with an acknowledgment of its initial
publication in this series.
3. Authors are permitted and encouraged to post their work online (e.g., in institutional repositories or on their website) prior to and
during the submission process, as it can lead to productive exchanges, as well as earlier and greater citation of published work (See
Open access policy for details).
References
[1]. Mandler, G. (1990). Interruption (discrepancy) theory: Review and extensions. On the move: The psychology of change and transition, 13, 32.
[2]. D'Mello, S., & Graesser, A. (2014). Confusion and its dynamics during device comprehension with breakdown scenarios. Acta psychologica, 151, 106–116.
[3]. D’Mello, S., Lehman, B., Pekrun, R., & Graesser, A. (2014). Confusion can be beneficial for learning. Learning and Instruction, 29, 153–170.
[4]. Lehman, B., D'Mello, S., & Graesser, A. (2012). Confusion and complex learning during interactions with computer learning environments. The Internet and Higher Education, 15(3), 184–194.
[5]. Pekrun, R., & Stephens, E. J. (2012). Academic emotions.
[6]. Silvia, P. J. (2010). Confusion and Interest: The Role of Knowledge Emotions in Aesthetic Experience. Psychology of Aesthetics, Creativity, and the Arts, 4(2), 75–80.
[7]. Muis, K. R., Psaradellis, C., Lajoie, S. P., Di Leo, I., & Chevrier, M. (2015). The role of epistemic emotions in mathematics problem solving. Contemporary Educational Psychology, 42, 172–185.
[8]. Yang, D., Kraut, R. E., & Rosé, C. P. (2016). Exploring the Effect of Student Confusion in Massive Open Online Courses. Journal of Educational Data Mining, 8(1), 52–83.
[9]. Chevrier, M., Muis, K. R., Trevors, G. J., Pekrun, R., & Sinatra, G. M. (2019). Exploring the antecedents and consequences of epistemic emotions. Learning and instruction, 63, 101209.
[10]. Di Leo, I. (2019). The role and sequencing of academic emotions during mathematics problem solving among elementary students. McGill University (Canada).
[11]. Poolman, P., Frank, R. M., Luu, P., Pederson, S. M., & Tucker, D. M. (2008). A single-trial analytic framework for EEG analysis and its application to target detection and classification. NeuroImage, 42(2), 787–798.
[12]. Seeck, M., Koessler, L., Bast, T., Leijten, F., Michel, C., Baumgartner, C., ... & Beniczky, S. (2017). The standardized EEG electrode array of the IFCN. Clinical neurophysiology, 128(10), 2070–2077.
[13]. Deco, G., Rolls, E. T., & Romo, R. (2009). Stochastic dynamics as a principle of brain function. Progress in neurobiology, 88(1), 1–16.
[14]. Steriade, M., & Llinás, R. R. (1988). The functional states of the thalamus and the associated neuronal interplay. Physiological reviews, 68(3), 649–742.
[15]. Ismail, W. W., Hanif, M., Mohamed, S. B., Hamzah, N., & Rizman, Z. I. (2016). Human emotion detection via brain waves study by using electroencephalogram (EEG). International Journal on Advanced Science, Engineering and Information Technology, 6(6), 1005–1011.
[16]. Stevens Jr, C. E., & Zabelina, D. L. (2019). Creativity comes in waves: an EEG-focused exploration of the creative brain. Current Opinion in Behavioral Sciences, 27, 154–162.
[17]. Wang, N., Zhang, L., & Liu, G. (2015). EEG-based research on brain functional networks in cognition. Bio-Medical Materials and Engineering, 26(s1), S1107–S1114.
[18]. Cheng, B., Fan, C., Fu, H., Huang, J., Chen, H., & Luo, X. (2022). Measuring and computing cognitive statuses of construction workers based on electroencephalogram: a critical review. IEEE Transactions on Computational Social Systems, 9(6), 1644–1659.
[19]. Valentim, C. A., Inacio Jr, C. M. C., & David, S. A. (2021). Fractal methods and power spectral density as means to explore EEG patterns in patients undertaking mental tasks. Fractal and Fractional, 5(4), 225.
[20]. Wang, H., Li, Y., Hu, X., Yang, Y., Meng, Z., & Chang, K. M. (2013, June). Using EEG to Improve Massive Open Online Courses Feedback Interaction. In AIED workshops.
[21]. Abhang, P. A., Gawali, B. W., & Mehrotra, S. C. (2016). Technical aspects of brain rhythms and speech parameters. Introduction to EEG-and speech-based emotion recognition, 1, 51–79.
[22]. Berke, J. D., Hetrick, V., Breck, J., & Greene, R. W. (2008). Transient 23–30 Hz oscillations in mouse hippocampus during exploration of novel environments. Hippocampus, 18(5), 519–529.
[23]. Grossberg, S. (2008). Beta oscillations and hippocampal place cell learning during exploration of novel environments. Boston University Center for Adaptive Systems and Department of Cognitive and Neural Systems.
[24]. Quinn, L. K., Nitz, D. A., & Chiba, A. A. (2010). Learning‐dependent dynamics of beta‐frequency oscillations in the basal forebrain of rats. European Journal of Neuroscience, 32(9), 1507–1515.
[25]. Sahu, R., Dash, S. R., & Baral, A. (2024). Identification of Students’ Confusion in Classes from EEG Signals using Convolution Neural Network. Informatica, 48(1).
[26]. Hunter, A., Crouch, B., Webster, N., & Platt, B. (2020). Delirium screening in the intensive care unit using emerging QEEG techniques: A pilot study. AIMS neuroscience, 7(1), 1.
[27]. Tanabe, S., Mohanty, R., Lindroth, H., Casey, C., Ballweg, T., Farahbakhsh, Z., ... & Sanders, R. D. (2020). Cohort study into the neural correlates of postoperative delirium: the role of connectivity and slow-wave activity. British journal of anaesthesia, 125(1), 55–66.
[28]. Fleischmann, A., Pilge, S., Kiel, T., Kratzer, S., Schneider, G., & Kreuzer, M. (2018). Substance-specific differences in human electroencephalographic burst suppression patterns. Frontiers in human neuroscience, 12, 368.
[29]. Fleischmann, R., Traenkner, S., Kraft, A., Schmidt, S., Schreiber, S. J., & Brandt, S. A. (2019). Delirium is associated with frequency band specific dysconnectivity in intrinsic connectivity networks: preliminary evidence from a large retrospective pilot case-control study. Pilot and feasibility studies, 5, 1–13.
[30]. Park, K. S., Choi, H., Lee, K. J., Lee, J. Y., An, K. O., & Kim, E. J. (2011). Patterns of electroencephalography (EEG) change against stress through noise and memorization test. International Journal of Medicine and Medical Sciences, 3(14), 381-389.
[31]. Detari, L., & Vanderwolf, C. H. (1987). Activity of identified cortically projecting and other basal forebrain neurones during large slow waves and cortical activation in anaesthetized rats. Brain research, 437(1), 1-8.
[32]. Lopes da Silva, F. H., Witter, M. P., Boeijinga, P. H., & Lohman, A. H. (1990). Anatomic organization and physiology of the limbic cortex. Physiological reviews, 70(2), 453-511.
[33]. Adrian, E. D., & Matthews, B. H. (1934). The Berger rhythm: potential changes from the occipital lobes in man. Brain, 57(4), 355-385.
[34]. Stancák, A., Pfeffer, D., Hrudová, L., Sovka, P., & Dostálek, C. (1993). Electroencephalographic correlates of paced breathing. Neuroreport, 4(6), 723-726.